Fact checking @StaceyKirkNZ & @armchair_critic @Income_Equality: How NZ is one of the worst in the world – updated

Last May, the Dominion Post had a feature on how New Zealand inequality was amongst the worst in the world:

Rising inequality has been the norm in most developed countries, but few have seen it increase by as much as New Zealand.

Since the 1980s, New Zealand’s inequality – which had been low by OECD standards – drew closer to levels seen in more unequal countries like the United States.

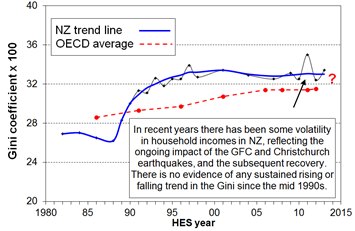
They support this claim with a Gini Coefficient chart that I’ve been unable to source at the OECD. I therefore use another that is freely available in New Zealand and which I have used in the past. My data source on the Gini coefficient has the advantage of been a complete series back to the early 1980s rather than five yearly observations in the OECD data sourced by the Dominion Post.

Figure 1: Inequality in New Zealand and the OECD trend: the Gini coefficient
image

Source: Bryan Perry, Household incomes in New Zealand: Trends in indicators of inequality and hardship 1982 to 2013. Ministry of Social Development (July 2014), Figure J5.

Figure 1 shows there is no evidence of a substantive rise or fall in inequality in New Zealand since the mid 1990s. Nearly all of the increase in inequality was in the late 1980s and early 1990s. Not mentioning that nearly all of the increase was in a short period leads to a poor understanding of the data before their readers. Rising inequality is not an on-going problem in New Zealand. There was a large rise in inequality in the late 1980s and early 1990s.

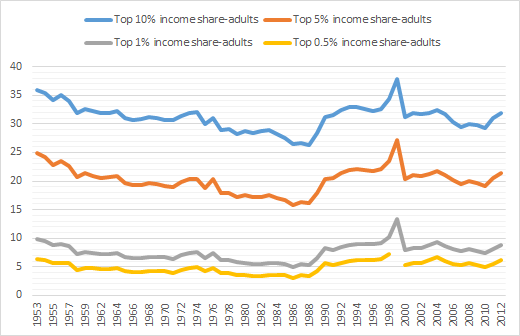
The next figure that I’ve been able to reproduce is the income shares of the top 10%, top 5%, top 1% on top 0.5% income earners in New Zealand  – see figure 2.

Figure 2: Top Income Shares, New Zealand
image

Source: top incomes-parisschoolofeconomics.

Our intrepid reporters in the Dominion Post claim that figure 2 shows that:

In 1986, the top 10 per cent took home 26.5 per cent of New Zealand’s income. In 1999, it was 37.8 per cent and in 2004, it was 33.2 per cent.

Oddly enough, our intrepid reporters decided to stop at 2004 for no particular reason. They also chose to truncate their chart at 1986 for no particular reason other than to lead the coincidence that the top 10% income shares were higher in the 1960s and 1970s that now– see figure 2 . That is, the top 10% in New Zealand earned more in the days before the scourge of neoliberalism came upon the New Zealand then after it – see figure 2. This detail was worth disclosing. Did neoliberalism reduce the income divide in New Zealand between the top 10% and the rest? Figure 2 suggests that it did.

The best that veteran grumbler Max Rashbrooke could spin to make these good old days of higher inequality than now to look like good old days before the scourge of neoliberalism beset New Zealand was to ignore the fortunes of the majority of the population in his dewy eyed view  of his childhood:

New Zealand up until the 1980s was fairly egalitarian, apart from Māori and women, our increasing income gap started in the late 1980s and early 1990s

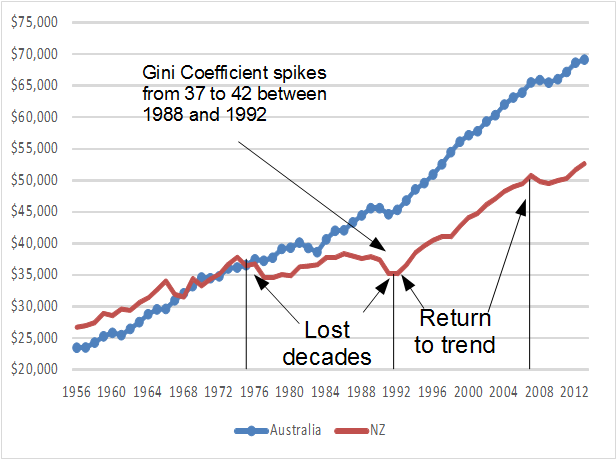
A more worthy analysis of figure 2 is to note that top income shares in New Zealand haven’t changed that much except for a bit of a spike in the late 1980s. This increase in inequality in New Zealand in the late 1980s and early 1990s  – see figures 1 and 2  – was quickly followed by a long economic boom  – see figure 3.

Figure 3: Real GDP per New Zealander and Australian aged 15-64,  2014 US$ (converted to 2014 price level with updated 2011 PPPs), 1.9 per cent detrended, 1956-2013
image

Source: Computed from OECD Stat Extract and The Conference Board. 2015. The Conference Board Total Economy Database™, May 2015, http://www.conference-board.org/data/economydatabase/

This boom after next to two decades of minimal real economic growth per working age New Zealander benefited everyone and, for example, the unemployment rate fell to a record low of 3.5% about 2005. The supposedly more egalitarian 1970s and 1980s were lost decades of growth – see figure 3.

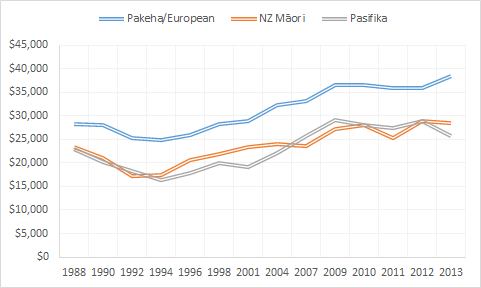
Figure 4: Real equivalised median household income (before housing costs) by ethnicity, 1988 to 2013 ($2013)
image

Source: Bryan Perry, Household incomes in New Zealand: Trends in indicators of inequality and hardship 1982 to 2013. Ministry of Social Development (July 2014).

As shown in figure 4, between 1994 and 2010, real equivalised median New Zealand Pakeha household income rose by 47%; for Māori, this rise was 68%; for Pasifika, the rise in real equivalised median household income was 77%. These trends pass the difference principle developed by John Rawls.

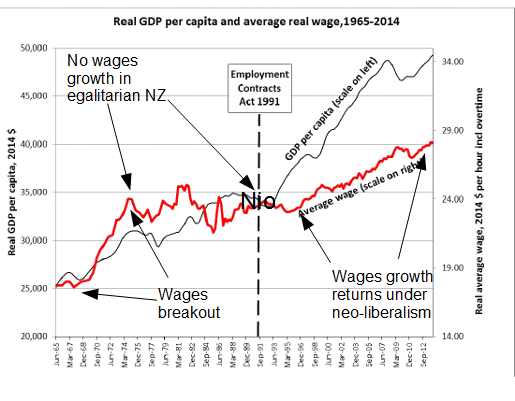
The large improvements in Māori incomes since 1992 were based on rising Māori employment rates, fewer Māori on benefits or zero incomes, more Māori moving into higher paying jobs, and greater Māori educational attainment (Dixon and Maré 2007). Labour force participation rates of Māori increased from 45% in the late 1980s to about 62% in the last few years. Māori unemployment reached a 20-year low of 8 per cent from 2005 to 2008. That and the return of wages growth after years of stagnation as shown in figure 5 is something to celebrate.

Figure 5:  real GDP per capita an average real wage, 1965 – 2014, New Zealand
image

Source: Council of Trade Unions.

The reporters in the Dominion Post also fell for the recent  OECD analysis suggesting a connection between economic growth and inequality:

One study by the OECD suggests rising inequality was responsible for wiping a third off New Zealand’s economic growth in the past 30 years

It estimated the rate of New Zealand’s GDP growth was stunted by as much as 15.5 percentage points between 1990 and 2010 – more than any other OECD economy.

The analysis of the OECD depended crucially upon how greater inequality reduces the ability of the lower income families to invest in human capital:

The evidence strongly suggests that high inequality hinders the ability of individuals from low economic background to invest in their human capital, both in terms of the level of education but even more importantly in terms of the quality of education.

The OECD theory of inequality and lower growth is there is a financing constraint because of inequality that reduces economic growth because of less human capital accumulation by lower income families.

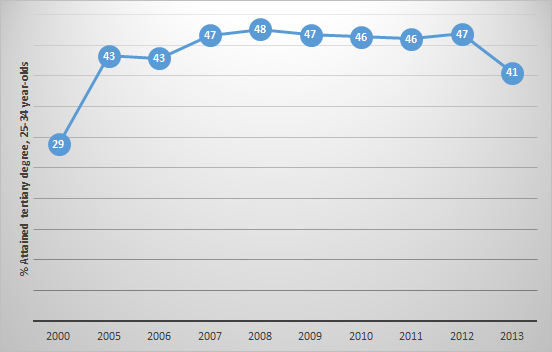
The OECD put a lot of their growth inequality nexus eggs in one basket. The OECD was implying that student loans and other government interventions are not closing credit constraints on financing higher education despite decades of rapidly rising tertiary education attainment, which is partially illustrated in figure 6.

Figure 6: tertiary educational degree attainment (%), New Zealanders aged 25–34, 2000-2013
image

Source: OECD StatExtract.

This is interesting because in 2002, with Pedro Carneiro, James Heckman showed that lack of credit is not a major constraint on the ability of young Americans to attend college. They found that credit constraints prevent, at most, 4% of the U.S. population from attending. Credit constraints is weakening as a rationale for a lack of an accumulation of human capital, and can be easily solved.

Another difficulty for the OECD is the increase in inequality in New Zealand was, as noted before in figures 1 and 2, in the late 1980s and 1990s. To blame low economic growth to the tune of 15 percentage points on events of some 25 or 30 years ago is a long bow.

Higher education has been free for the low income families for several generations. Student loans are readily available. It is hard to believe that such a readily solvable problem is a major source of inequality and lower growth. Moreover, as Aghion said:

Economists and others have proposed many channels through which education may affect growth–not merely the private returns to individuals’ greater human capital but also a variety of externalities.

For highly developed countries, the most frequently discussed externality is education investments’ fostering technological innovation, thereby making capital and labour more productive, generating income growth.

Despite the enormous interest in the relationship between education and growth, the evidence is fragile at best.

The 15 percentage point reduction in New Zealand economic growth since the late 1980s because of inequality is so large over a 30 year period that this half a percentage point reduction on average per annum qualifies as an independent source  of business cycle shocks and an equally implausible driver of real business cycles.

Our intrepid reporters closed by claiming large increases in child poverty:

In December last year, the second annual Child Poverty Monitor showed a slight decrease in the number of Kiwi children living in income poverty, from 27 per cent to 24 per cent. But 30 years ago, it was 14 per cent.

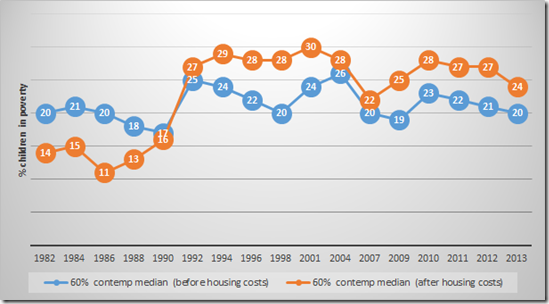
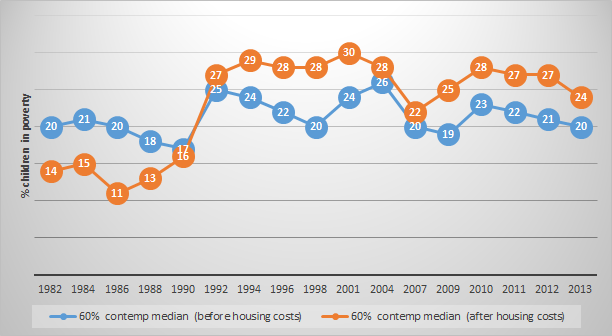
Figure 7 below shows their numbers, which is child poverty in New Zealand for poverty thresholds of 60% relative to a contemporary median measured both before and after housing costs.

Figure 7: % child poverty in New Zealand (before and after housing costs), 60% relative to contemporary median, 1982 – 2013
image_thumb1

Source: Bryan Perry, Household incomes in New Zealand: Trends in indicators of inequality and hardship 1982 to 2013. Ministry of Social Development (July 2014), Tables F.6 and F.7.

The first thing to notice in figure 7 is before housing costs child poverty has been pretty stable for 30 years the New Zealand. Few celebrate this.

Figure 7 does show a large increase in after housing costs child poverty in the late 1980s. Since the early 1990s, after housing costs child poverty has slowly tapered down from the high 30% in the mid-1990s to 24% now – see figure 7.

In the longer run after housing costs child poverty rates in 2013 were close to double what they were in the late 1980s mainly because housing costs in 2013 were much higher relative to income than they were in the late 1980s.

– Bryan Perry, 2014 Household Incomes Report – Key Findings. Ministry of Social Development (July 2014).

Before housing costs child poverty in recent years as been the same as it was in 1982 – see figure 7. Although there were large cuts in the social security benefits in the 1991 mother of all budgets in New Zealand, before housing child poverty increased to 25% but was back to 20% by the mid 1990s.

As figure 7 shows, the problem was not income, but the rising costs of housing that had to be paid out of  benefits and wages. The Left over Left will not let go of the 1991 benefit cuts even 25 years later despite the fact that the issue was rising housing costs rather than perpetually higher before housing costs child poverty.

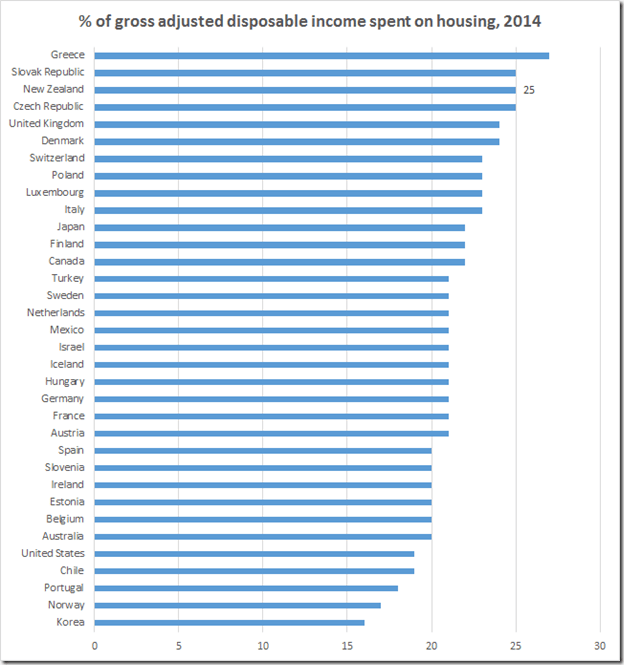
The problem is not income, it is rising costs of housing. Increasing wages and benefits will not solve that if more money is simply chasing the same limited stock of land and urban housing.

A proper comparison of the diverging trends in figure 7 between before housing costs child poverty and after housing costs child poverty rates since 1982 gives a much clearer picture of what is increasing child poverty. It is rising housing costs as a result of regulation on the supply of new urban land.
image

Source: OECD Better Life Index.

The driver of inequality in New Zealand is government regulation of the land supply – policies supported by the middle-class and the left-wing parties. Rising inequality is not inequality between high and low income earners as suggested by the Dominion Post.
The Rahn curve explained

Fact Checking @Income_Equality – child poverty in 2014 was at 24% compared to 14% in 1982

Closing The Gap – The Income Equality Project said today that “child poverty in New Zealand in 2014 was 24% as compared 14% in 1982”. What do they mean by this and what, importantly, does this trend imply for problem definition for child poverty policy?

Figure 1 below shows their numbers, which is child poverty in New Zealand after housing costs for poverty thresholds of 60% relative to a contemporary median as calculated by the Ministry of Social Development’s Brian Perry – the New Zealand expert on these matters.

Figure 1: % child poverty in New Zealand (before and after housing costs), 60% relative to contemporary median, 1982 – 2013

image

Source: Bryan Perry, Household incomes in New Zealand: Trends in indicators of inequality and hardship 1982 to 2013. Ministry of Social Development (July 2014), Tables F.6 and F.7.

The first thing to notice is, which is important, in figure 1 is before housing costs child poverty under the 60% relative to the contemporary median poverty threshold chosen by Closing The Gap – The Income Equality Project has been pretty stable for 30 years the New Zealand. Crisis, what crisis?

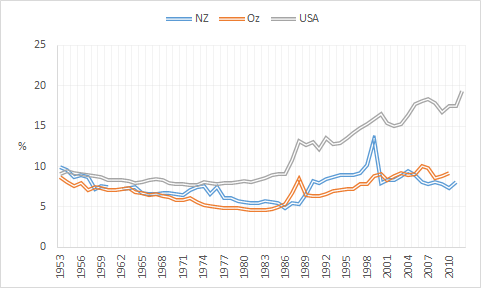
The top 1%’s New Zealand branch has not being doing its job – see figure 2. The New Zealand top 1% has failed miserably in further oppressing the proletariat, extracting more and more of their labour surplus, and grinding working class children into deeper and deeper poverty to increase their already excessive incomes – see figure 2. You’re fired as the until recently registered Democrat Donald Trump would say.

Figure 2: top income shares, New Zealand, Australia and USA

image

Source: top incomes-parisschoolofeconomics

Before housing costs child poverty has not risen for 30 years as shown in figure 1, which is the chosen threshold of child poverty of the Closing The Gap – The Income Equality Project.

The story about trends in child poverty is very different for child poverty when after housing costs child poverty rates are estimated  – see figure 1.

Figure 1 shows a large increase in after housing costs child poverty in New Zealand in the late 1980s when there was a deep recession and double-digit unemployment. Since the early 1990s, as figure 1 shows, after housing costs child poverty has slowly tapered down from the high 30% in the mid-1990s to 24% now and that is despite the global financial crisis, which was the top 1%’s fault if the Left over Left is to be believed.

For before housing costs child poverty –  as can be seen from  figure 1 –  there was an increase in child poverty before housing costs when there was a deep recession at the end of the 1980s. After before housing costs child poverty is now the same as it was both 20 and 30 years ago – see figure 1 .

In the longer run after housing costs child poverty rates in 2013 were close to double what they were in the late 1980s mainly because housing costs in 2013 were much higher relative to income than they were in the late 1980s.

– Bryan Perry, 2014 Household Incomes Report – Key Findings. Ministry of Social Development (July 2014).

Now to the rub. If it is after housing costs child poverty that has risen in New Zealand and stayed high, as it has, the focus should be on what factors are driving up housing costs rather than what factors are driving down wages and incomes of ordinary worker. Before housing costs child poverty is no worse than it was 20 and 30 years ago  – see figure 1.

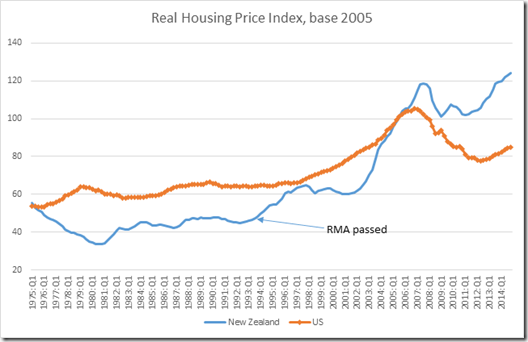
The cause of the large increase in housing costs and housing prices is abundantly clear. Restrictions on the supply of land that result from the Resource Management Act and policies made under that law such as the Auckland urban limit. That is the proper problem definition for public policy. Restrictions on land supply is driving up child poverty because more and more of the incomes of the poor is housing costs.

housing-prices-and-rma_thumb

Source:  Federal Reserve Bank of Dallas.

The most straightforward and fastest way of reducing child poverty and family poverty in New Zealand is lowering housing costs through deregulation of land supply.

Land supply deregulation is well within the realm of public policy choice. Parliament cannot legislate wage increases without accompanying productivity increases, but it can reduce restrictions on the supply of land as a result of the Resource Management Act.

Any discussion of child poverty and family poverty in New Zealand should refer to trends in both before and after housing cost in child poverty.

A comparison of these diverging trends  between before housing cost and after housing costs child poverty rates since 1982 gives a much clearer picture of what is increasing child poverty. The cause is housing costs as a result of ever tightening regulation on the supply of new urban land and in particular in Auckland at the behest of the middle-class voters courted by the Greens and Labour Party. It is the left-wing parties in New Zealand which opposed the most practical steps  to reduce child poverty, which is land supply deregulation.

The Social Security Ponzi scheme in one chart

Labour is incoherent & self-defeating in its opposition to private prisons

The New Zealand Labour Party would make a lot more progress in its opposition to private prisons if it would drop its ideologically blinkered opposition to privatisation. If it was to do that, it would have a much stronger case against private prisons.

That case would be based on the modern economics of industrial organisation and state and private ownership. In particular, the make or buy decision that any organisation, be they public or private must face when deciding whether to make a particular production input in-house or source it externally.

Labour’s current case against private prisons is a bunch of ideological clichés as it illustrated today in a post on Facebook by Jacinda Ardern. Her post was based on her speech in the House of Representatives:

Yes, part of that opposition is my view that no one should make a profit from incarceration, but it’s also about the complete fallacy that somehow a company like SERCO will do the job better.

The notion that no one should make a profit from incarceration is farcical. There are a whole range of private profit making suppliers of goods and services to prisons and prison officers draw a wage.

The case was state ownership, as well stated by Andrei Shleifer is no different than any other ownership decision taken by an organisation facing the inability to contract fully over hard to measure quality issues with the goods or services supplied to it.

Shleifer in “State versus Private Ownership” argues that you make in-house rather than buy in the market under the following conditions:

  1. opportunities for cost reductions that lead to non-contractible deterioration of quality are significant;
  2. innovation is relatively unimportant;
  3. competition is weak and consumer choice is ineffective; and,
  4. reputational mechanisms are also weak.

What particularly should focus Labour’s attention on Andrei Shleifer’s State versus Private Ownership is it is a simplified version of Hart, Oliver, Andrei Shleifer, and Robert W Vishny. 1997. “The Proper Scope of Government: Theory and an Application to Prisons.” Quarterly Journal of Economics. The abstract to that longer paper says the following:

When should a government provide a service in-house, and when should it contract out provision? We develop a model in which the provider can invest in improving the quality of service or reducing cost.

If contracts are incomplete, the private provider has a stronger incentive to engage in both quality improvement and cost reduction than a government employee has. However, the private contractor’s incentive to engage in cost reduction is typically too strong because he ignores the adverse effect on non-contractible quality. The model is applied to understanding the costs and benefits of prison privatization.

The privatisation of prisons is at the margin of the case was state versus private provision of a good or service.

Labour forecloses this entire literature to itself and bases its arguments on ideology. Any other argument Labour makes are just talking points to a fixed ideological position.There is no give-and-take. When one argument is knocked down, Labour just looks for other arguments to defend the same fixed position.

The reason Labour forecloses this large economic literature on state versus private ownership and its application to private versus public prisons is embracing that literature would mean admitting that same literature makes a strong case for the privatisation of a number of other government services and state-owned enterprises. As Shleifer says in State versus Private Ownership:

Private ownership should generally be preferred to public ownership when the incentives to innovate and to contain costs must be strong.

The main argument, the best argument, against the privatisation of publicly provided services and state-owned enterprises is the dilution of quality once it is supplied privately. This risk of compromises and quality to enhance profits is higher when the privatisation is contracting back to government. Detailed contracts must be written to assure quality. As Hart, Shleifer and Vishny say:

Critics of private schools fear that such schools, even if paid for by the government (e.g., through vouchers), would find ways to reject expensive-to-educate children, who have learning or behavioural problems, without violating the letter of their contracts. Critics also worry that private schools would replace expensive teachers with cheaper teachers’ aides, thereby jeopardizing the quality of education.

In the discussion of public versus private health care, the pervasive concern is that private hospitals would find ways to save money by shirking on the quality of care or rejecting the extremely sick and expensive-to-treat patients. In the case of prisons, concern that private providers hire unqualified guards to save costs, thereby undermining safety and security of prisoners, is a key objection to privatization.

Our model tries to explain both why private contracting is generally cheaper, and why in some cases it may deliver a higher, while in others a lower, quality level than in-house provision by the government.

By basing the argument on the strengths and weaknesses of contracting over quality for specific services, Labour would have to drop its straight ideological opposition to privatisation and run on a case-by-case basis over the ability to successfully contract to assure quality.

That sounds far too much like becoming a Blairite – the horror, the horror if you are a Labour Party member in the 21st century concerned more about ideological purity than winning office and improving the lot of the people claim to you represent.

If it were to embrace the modern economics of state versus private ownership, Labour would have to agree with Hart, Shleifer and Vishny when they say:

the case for privatization is stronger when quality reducing cost reductions can be controlled through contract or competition, when quality innovations are important, and when patronage and powerful unions are a severe problem inside the government.

When the government cannot fully anticipate, describe, stipulate, regulate and enforce exactly what it wants and prisons are a good case this and has difficulty enforce in any contract with regard to quality assurance, it’s better to make it in-house as Hart, Shleifer and Vishny show.

A call to the barricades is not be very uplifting if based on incomplete contracting over service quality rather than the evils of capitalist profit. It is unfortunate that the Labour Party sacrifice the interests of those incarcerated in the prison system to its unwillingness to be denounced as a Blairite.

The case for private prisons is based on public prisons may have fewer incentives to keep costs down, including keeping costs down by skimming on quality to increase profits as Andre Shleifer explains:

Ironically, the government sometimes becomes the efficient producer precisely because its employees are not motivated to find ways of holding costs down.

The modern case for government ownership can often be seen from precisely this perspective. Advocates of such ownership want to have state prisons so as to avoid untrained low-wage guards, state water utilities to force investment in purification, and state car makers to make them invest in environmentally friendly products.

As it turns out, however, this case for state ownership must be made carefully, and even in most of the situations where cost reduction has adverse consequences for non-contractible quality, private ownership is still superior.

That is the twist in the tale for Labour. The case against privatisation is merely a balancing act requiring detailed scrutiny of the potential to successfully enforce contracts with private providers over quality assurance.

The case against prison privatisation is simply for the public sector as fewer incentives to weaken quality because this increases the bottom line of the contractor or salaries of management. It’s a trade-off between cost control and quality dilution. Publicly run prisons have fewer incentives to control costs, but they also have fewer incentives to deliberately cut corners on quality to increase dividends or managerial salaries .

There’s nothing new about the non-profit provision of goods and services in the marketplace. A whole range of non-profit firms emerged through market competition in situations where contracting over quality or trust was costly.

Most life insurance companies were initially mutually owned by customers. Because they were a non-profit firm, there were fewer avenues to run off with the premiums through excessive dividends.

Many private universities and private schools are run by charitable trusts as a way of quality assurance. Another way of quality assurance is heavy involvement of alumni through giving and sports to police the reputation of the university or school they once attended or want their children to attend.

An arguable case can be made against prison privatisation, based on sound economic principles as long as you’re willing to admit that in many cases privatisation is a good idea based on the same economic principles. That’s a bridge too far from the Labour Party in New Zealand.

Maybe the reason is Labour knows that although they may be able to make an arguable case against prisons privatisation, they may still lose to better arguments and, in particular, successful experiments in prison privatisation at home and abroad. Better to keep the debate away from evidence-based policy. This awkwardness in seeking out the best argument is due to the proclivity of Labour in opposition to repudiate the successes of its last time in office and look for reasons to make themselves even less electable by going left rather than going back into the centre.

Presidential campaign spending is overwhelmingly on TV ads in swing states

Trends in labour market freedom in the UK, USA, Germany and France – Index of Economic Freedom rankings

The writers of the Index of Economic Freedom at the Heritage foundation really loves the USA and didn’t think much of the Conservative Party – Liberal Democratic Party coalition government because labour market freedom actually fell in the UK during their administration. Bring back Tony Blair, all is forgiven. The information on their website throws no insight into why this reduction in labour market freedom in Britain happened.

Figure 1: Index of Economic Freedom, Argentina, Brazil, Chile and Venezuela, 95 – 2015 image

Source: Index of Economic Freedom 2015.

Fortunately for Germany, labour market freedom increased over the course of the global financial crisis and its aftermath. This helps explains low unemployment in Germany during that period. Nothing much happened in France in regard to labour market freedom.

In honour of the moon landing

Image

Donald Trump and Marco Rubio compared

The top 400 income tax returns in the USA

Image

Unwanted pregnancy rates and education

Where Trump & McCain were in the mid 1970’s

https://twitter.com/bennyjohnson/status/622486985450455040?s=09

From wisdom to conviction – Paul Krugman on the Card–Kruger study of minimum wages (1998 and now)

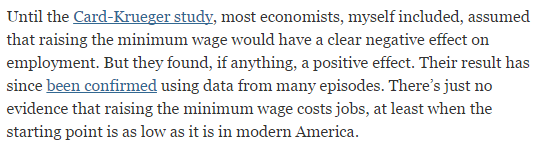
This first screenshot is from the New York Times today of Paul Krugman’s current recollection of his interpretation of the Card – Kruger study of minimum wages in restaurants when that study was published all those years ago.

image

Paul Krugman in his review of Living Wage: What It Is and Why We Need It By Robert Pollin and Stephanie Luce in 1998 was far wiser.

So what are the effects of increasing minimum wages? Any Econ 101 student can tell you the answer: The higher wage reduces the quantity of labour demanded, and hence leads to unemployment. This theoretical prediction has, however, been hard to confirm with actual data.

Indeed, much-cited studies by two well-regarded labour economists, David Card and Alan Krueger, find that where there have been more or less controlled experiments, for example when New Jersey raised minimum wages but Pennsylvania did not, the effects of the increase on employment have been negligible or even positive.

Exactly what to make of this result is a source of great dispute. Card and Krueger offered some complex theoretical rationales, but most of their colleagues are unconvinced; the centrist view is probably that minimum wages “do,” in fact, reduce employment, but that the effects are small and swamped by other forces.

What is remarkable, however, is how this rather iffy result has been seized upon by some liberals as a rationale for making large minimum wage increases a core component of the liberal agenda–for arguing that living wages “can play an important role in reversing the 25-year decline in wages experienced by most working people in America” (as this book’s back cover has it).

Clearly these advocates very much want to believe that the price of labour–unlike that of gasoline, or Manhattan apartments–can be set based on considerations of justice, not supply and demand, without unpleasant side effects.

This will to believe is obvious in this book: The authors not only take the Card-Krueger results as gospel, but advance a number of other arguments that just do not hold up under examination.

The Card– Kruger results have gone from rather iffy in the mind of Paul Krugman to the basis of public policy that, if wrong, costs a lot of low paid workers their jobs. Krugman was well aware in 1998 what a risky path minimum wage increases were:

Now to me, at least, the obvious question is, why take this route? Why increase the cost of labour to employers so sharply, which–Card/Krueger notwithstanding–must pose a significant risk of pricing some workers out of the market, in order to give those workers so little extra income?

Why not give them the money directly, say, via an increase in the tax credit?

Studies of tiny increases in the minimum wage are being used to justify far larger increases in the minimum wage. Krugman was right to be suspect of that in 1998.

Krugman’s statements today in the New York Times about the low starting point in modern America for any minimum wage increases is still keeping that slightly cautious tone in his analysis. Few who read his analysis will carry that passing nuance into their own policy advocacy.

Paul Krugman in 1998 was quite astute as to why people want to believe the minimum wage can be increased without any cost to jobs:

One answer is political: What a shift from income supports to living wage legislation does is to move the costs of income redistribution off-budget. And this may be a smart move if you believe that America should do more for its working poor, but that if it comes down to spending money on-budget it won’t.

Indeed, this is a popular view among economists who favour national minimum-wage increases: They will admit to their colleagues that such increases are not the best way to help the poor, but argue that it is the only politically feasible option.

Nor in 1998 was Krugman blind to the expressive politics, the ideological blindness of those who advocate minimum wage increases and living wages:

But I suspect there is another, deeper issue here–namely, that even without political constraints, advocates of a living wage would not be satisfied with any plan that relies on after-market redistribution.

They don’t want people to “have” a decent income, they want them to “earn” it, not be dependent on demeaning hand-outs…

In short, what the living wage is really about is not living standards, or even economics, but morality. Its advocates are basically opposed to the idea that wages are a market price–determined by supply and demand, the same as the price of apples or coal.

It is most unwise to say there is no evidence of minimum wage increases causing unemployment. That sets a low bar of having to find only one or two studies to refute the claim:

1. Taking his claims as true, why do small businesses lobby against raising the minimum wage?
2.  Why did Tom Holmes find in his seminal 1999 JPE paper that manufacturing clusters on the Right to Work Side of state borders and avoids the union side of the border?
3.  Why did Erin Mansur and I find the same result in our 2013 paper where we build on Holmes’ paper and show that labour intensive manufacturing industries are even more likely to avoid the union side of the border as they are more likely to locate in the adjacent county in the Right to Work State?
4.  The Card-Krueger study is certainly important but the variation they used to estimate their effect is tiny relative to the upcoming doubling of the minimum wage up to $15 in cities such as LA and San Fran. How is Dr. Krugman so sure that he can “extrapolate out of sample” to a policy that has never been tried before?  Does he have a valid structural model that he can use to conduct such extreme policy counter-factuals?

Karl Popper would be proud of Krugman’s bold and risky prediction that strictly forbids the existence of any studies showing adverse unemployment effects of minimum wage increases.

The thing to remember is, if there is not doubt in the literature, if there are not some mixed results, the econometricians are simply not trying hard enough to win tenure, secure promotion and be published on the top journals.

Rent control and housing quality

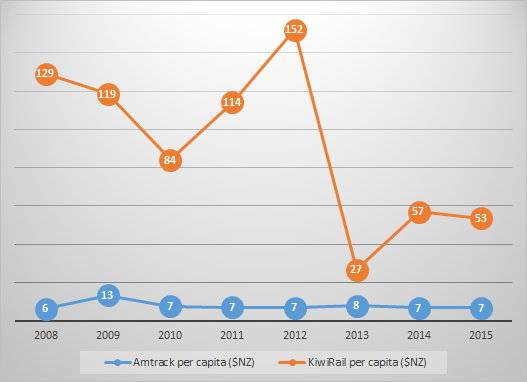
The Amtrak and KiwiRail bailouts compared

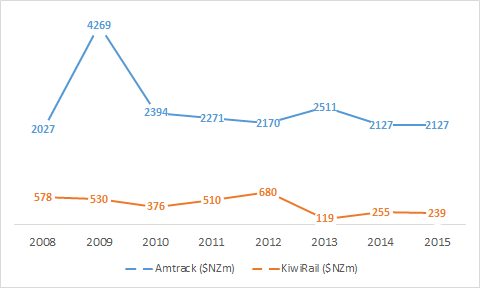
Figure 1: Amtrak and KiwiRail bailouts, (exchange rate US$1:NZ$1.53), 2008 – 2015

image

Sources: Federal Funding Received by Amtrak | Mercatus and New report: Corporate welfare in the 2015 budget – Taxpayers’ Union.

New Zealand with its KiwiRail does a good job of keeping up with the Amtrak bailout especially when you look at figure 2,  which computes the bailouts on a per capita basis.

Figure 2: Amtrak and KiwiRail bailouts per capita (2014 populations), (exchange rate US$1:NZ$1.53), 2008 – 2015

image

Sources: Federal Funding Received by Amtrak | Mercatus and New report: Corporate welfare in the 2015 budget – Taxpayers’ Union.

Previous Older Entries Next Newer Entries

Arin’s Substack

Celebrating humanity's flourishing through the spread of capitalism and the rule of law

David Andolfatto

Celebrating humanity's flourishing through the spread of capitalism and the rule of law

Monetary Non-Neutrality

Celebrating humanity's flourishing through the spread of capitalism and the rule of law

Reason Magazine

Celebrating humanity's flourishing through the spread of capitalism and the rule of law

Coyote Blog

Celebrating humanity's flourishing through the spread of capitalism and the rule of law

Thoughts from the North

Celebrating humanity's flourishing through the spread of capitalism and the rule of law

Fardels Bear

A History of the Alt-Right

Vincent Geloso

Econ Prof at George Mason University, Economic Historian, Québécois

Bassett, Brash & Hide

Celebrating humanity's flourishing through the spread of capitalism and the rule of law

Truth on the Market

Scholarly commentary on law, economics, and more

The Undercover Historian

Beatrice Cherrier's blog

Matua Kahurangi

Celebrating humanity's flourishing through the spread of capitalism and the rule of law

Temple of Sociology

Celebrating humanity's flourishing through the spread of capitalism and the rule of law

Velvet Glove, Iron Fist

Celebrating humanity's flourishing through the spread of capitalism and the rule of law

Why Evolution Is True

Why Evolution is True is a blog written by Jerry Coyne, centered on evolution and biology but also dealing with diverse topics like politics, culture, and cats.

NoTricksZone

Celebrating humanity's flourishing through the spread of capitalism and the rule of law

Homepaddock

A rural perspective with a blue tint by Ele Ludemann

Kiwiblog

DPF's Kiwiblog - Fomenting Happy Mischief since 2003

The Dangerous Economist

Celebrating humanity's flourishing through the spread of capitalism and the rule of law

Watts Up With That?

The world's most viewed site on global warming and climate change

The Logical Place

Tim Harding's writings on rationality, informal logic and skepticism

Doc's Books

A window into Doc Freiberger's library

The Risk-Monger

Let's examine hard decisions!

Uneasy Money

Commentary on monetary policy in the spirit of R. G. Hawtrey

Barrie Saunders

Thoughts on public policy and the media

Liberty Scott

Celebrating humanity's flourishing through the spread of capitalism and the rule of law

Point of Order

Politics and the economy

James Bowden's Blog

A blog (primarily) on Canadian and Commonwealth political history and institutions

Science Matters

Reading between the lines, and underneath the hype.

Peter Winsley

Economics, and such stuff as dreams are made on

A Venerable Puzzle

"The British constitution has always been puzzling, and always will be." --Queen Elizabeth II

The Antiplanner

Celebrating humanity's flourishing through the spread of capitalism and the rule of law

Bet On It

Celebrating humanity's flourishing through the spread of capitalism and the rule of law

History of Sorts

WORLD WAR II, MUSIC, HISTORY, HOLOCAUST

Roger Pielke Jr.

Undisciplined scholar, recovering academic

Offsetting Behaviour

Celebrating humanity's flourishing through the spread of capitalism and the rule of law

JONATHAN TURLEY

Res ipsa loquitur - The thing itself speaks

Conversable Economist

In Hume’s spirit, I will attempt to serve as an ambassador from my world of economics, and help in “finding topics of conversation fit for the entertainment of rational creatures.”

The Victorian Commons

Researching the House of Commons, 1832-1868

The History of Parliament

Articles and research from the History of Parliament Trust

Books & Boots

Reflections on books and art

Legal History Miscellany

Posts on the History of Law, Crime, and Justice

Sex, Drugs and Economics

Celebrating humanity's flourishing through the spread of capitalism and the rule of law

European Royal History

Exploring the Monarchs of Europe

Tallbloke's Talkshop

Cutting edge science you can dice with

Marginal REVOLUTION

Small Steps Toward A Much Better World