
P.J. O’Rourke on the new-found obsession of the 60s generation with safety
01 Aug 2014 Leave a comment

Justice Thomas, a colour-blind Constitution and Brown v. Board of Education (1954)
31 Jul 2014 Leave a comment

How flexible is the New Zealand labour market
31 Jul 2014 1 Comment
in economics of regulation, labour economics, politics - New Zealand, unemployment, welfare reform Tags: 90 day trials, employment law, employment probation periods, employment protection, labour market regulation
The first chart below shows that NZ is the 4th most deregulated labour market for individual dismissals.
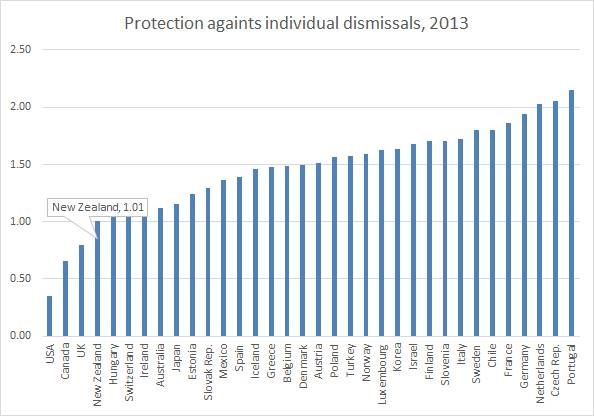
Source: OECD employment protection index
The next figure below shows that NZ is top of the world for deregulation of lay-offs and redundancies.
![clip_image002[7]](https://utopiayouarestandinginit.com/wp-content/uploads/2014/07/clip_image0027.jpg "clip_image002[7]")
Source: OECD employment protection index
The chart below shows that New Zealand is far more flexible than in Western Europe and is pretty near the USA in terms of people moving in and out of the unemployment pool every month with great ease.
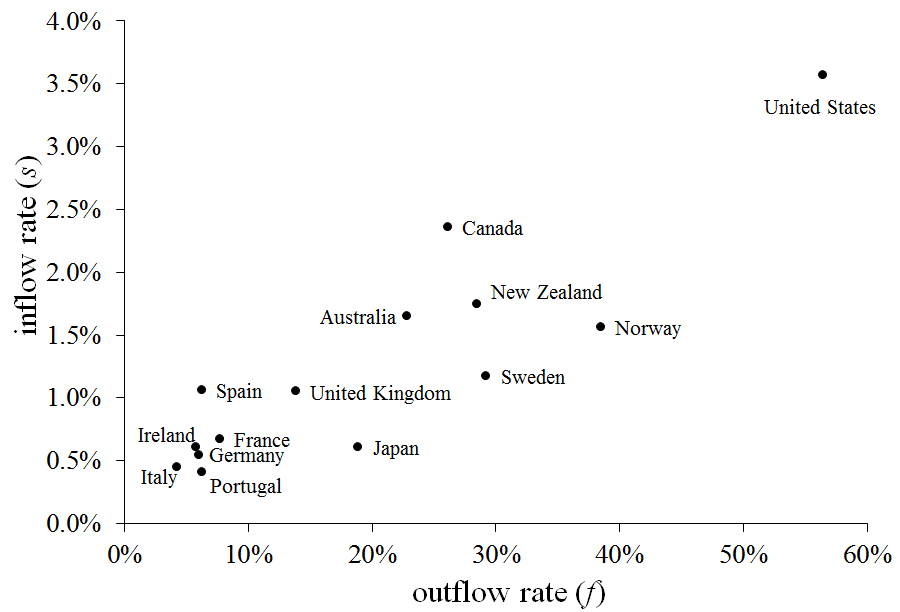
Source: Elsby, Hobijn and Şahin (2013).
There are very high outflow rates from unemployment among the Anglo-Saxon and Nordic economies. The economies of Continental Europe stand in stark contrast. Unemployment outflow rates in these economies lie below 10% at a monthly frequency.
A major labour market reform in recent years in New Zealand was introduction of the option of a 90 day trial for new employees, initially in small businesses and then in all businesses.
The UK recently extended its trial period from one-year to two-years. Trial periods are common in OECD member countries.
There is plenty of evidence to back-up the notion that increased job security leads to less employee effort and more absenteeism. Some examples are:
· Sick leave spiking straight after probation periods ended;
· Teacher absenteeism increasing after getting tenure after 5-years; and
· Academic productivity declining after winning tenure.
The MBIE research into the actual operation of 90-day trials was highly favourable in terms of increased employment, the hiring of riskier applicants and lower costs of ending bad job matches (about 15-20% of trials did not work out). These outcomes are the usual importance of a test drive argument for employment trial periods.
Interestingly, the MBIE research also found that some employers hired new employees on 90-day trials for positions about which these employers were uncertain might be profitable. But for the option of the trial period, these jobs never would have existed.
This suggests that in some firms, 90-day trials are a decisively cheaper alternative to hiring an employee and perhaps making them redundant later if the new position does not pay for itself. No one’s fault: the market just did not sustain the expansion in staff as expected.
The MBIE research shows that winners from 90-day trials are new labour force entrants, the unemployed and beneficiaries, migrants and labour force re-entrants such as mothers.
I kept note of an interesting press report adding to this where Hospitality New Zealand Wellington president Jeremy Smith said he had hired dozens of staff he would not otherwise have considered. Because of the transient nature of the hospitality industry, it was often difficult to check references so a trial period “levelled the playing field”.
The politics of ethnicity-based research in New Zealand
30 Jul 2014 Leave a comment
in applied price theory, discrimination, human capital, income redistribution, labour economics, labour supply, politics - New Zealand, population economics, Public Choice, rentseeking Tags: employment discrimination, inequality, Maori economic development, poverty, Simon Chapple, The Great Enrichment, The Great Fact
When Simon Chapple in 2000 wrote “Māori Socio-Economic Disparity”, which showed that disadvantage in New Zealand is more closely tied to age, marital status, education, skills, and geographic location than it is to ethnicity, broadly conceived, such as Māori ethnicity:
- He was summoned before the Māori Affairs Committee of parliament to defend his paper! His chief executive at the Ministry of Social Policy went along with him to defend what he wrote while employed as a senior analyst at the Department of Labour. Staff at his new ministry launched a petition to have Simon fired.
- The head of the Māori Affairs Ministry accused Simon of breaching the public service code of conduct.
Chapple also found that there are important differences in socio economic development by Māori self-identity. Those who identified only as Māori did worse than those that are identified as Māori and another ethnicity. Identifying only as Māori also correlated with living in rural New Zealand.
In terms of employment discrimination, employers would not know whether a Māori job applicant identified as only as Māori or also with another ethnicity, so discrimination is not a good explanation of Māori disadvantage because of this counterfactual. A major driver of Māori disadvantage, which is identifying on the Census form solely as Maori, is simply unknown to discriminating employers as a basis for discrimination in hiring and promotion.
There were editorials in the Dominion Post, which I cannot find online, and in the New Zealand Herald. The latter said:
The Government is being prodded to recognise that Maori deprivation has more to do with socio-economic factors than ethnicity.
This was the conclusion of a report by the Labour Department’s senior research analyst, Simon Chapple. Helen Clark might well have had that finding partly in mind when she referred to a lot of water having gone under the bridge since the Government first formulated legislation.
Mr Chapple said, in essence, that place of residence, age, education and skills had more to do with poverty than race. In areas such as South Auckland, Northland and the central North Island, there were poor Maori, but there were also poor Pākehā and poor Pasifika.
The Minister attacked him and the paper as well for contradicting the Minister’s claim during the election campaign that everything got worse for Maori in the 1990s.
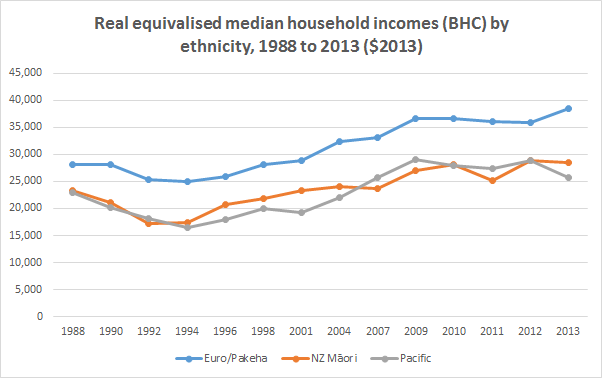
Real equivalised median household income rose 47% from 1994 to 2010; for Māori, this rise was 68%; for Pasifika, 77% (Perry July 2014)
See Karen Baehler’s Ethnicity-based research and politics: snapshots from the United States and New Zealand for more information and a comparison with the similar response to Daniel Patrick Moynihan’s The Negro Family: A Case for National Action in 1965.
About a quarter of Negro families are headed by women. The divorce rate is about 2 1/2 times what it is [compared with whites],” Moynihan said. “The number of fatherless children keeps growing. And all these things keep getting worse, not better, over recent years.”
Moynihan, now retired from the United States Senate, was a senior official in LBJ’s Labor Department in 1965. He wrote his report on a typewriter over a few weeks and had the publications office in the basement of the Labor Department print 100 of them, marked “For Official Use Only.”
- He warned about the breakdown of the African-American family where deprivation and disorganisation had formed their own vicious circle.
- Many civil rights leaders had labelled Moynihan’s report a subtle form of racism because of its unflattering portrayal of the black family (Wilson 1987).
- These accusations of racism helped make the breakdown of the family a taboo subject in social policy in the USA
see The Moynihan Report Revisited: Lessons and Reflections after Four Decades for a review by the best and the brightest in American economics and sociology on Daniel Patrick Moynihan’s prophetic warnings. Holzer says, for example:
Moynihan was extremely insightful and even prescient in arguing that the employment situation of young black men was a “crisis . . . that would only grow worse.”
He understood that these trends involve both limits on labour market opportunities that these young men face as well as skill deficits of and behavioural responses by the young men themselves.
More children are growing-up without a working father living in the home and glean the awareness that work is a central expectation of adult life (Wilson 1987, 1996).
Single-parent households increased from 13 per cent of all Māori households in 1981 to 24.4 per cent in the 2006 Census. In the 2006 Census, 70 per cent of Māori single parent households were on a low income compared to 15 per cent of other Māori one family households (Kiro, Randow and Sporle 2010).
Most of the skill gaps that are present at the age of 18 – skill gaps which substantially explain gaps in adult earnings and employment in all groups – are also present at the age of five (Cunha and Heckman 2007). There is much evidence to show that disadvantaged children have lower levels of soft skills (non-cognitive skills): motivation, persistence, self-discipline, the ability to work with others, the ability to defer gratification and plan ahead, etc. (Heckman 2008). Most of the skills that are acquired at school build on these soft skills that are moulded and reinforced within whānau.
When I started working on labour economics in 2007 I found that the labour economics of Māori was very narrowly written and stayed well clear of the minefield that Simon braved about how ethnicity does not matter that much to Māori social disadvantage.
Why New Zealanders support MMP
28 Jul 2014 Leave a comment
in constitutional political economy, politics - New Zealand, Public Choice Tags: MMP
Most people seem to give the same reason to me in conversations as to why they support the MMP voting system – Mixed Member Proportional representation.
The reason is profoundly democratic: their party vote always counts no matter where they live in the country or how safe or how marginal the local electorate might be.
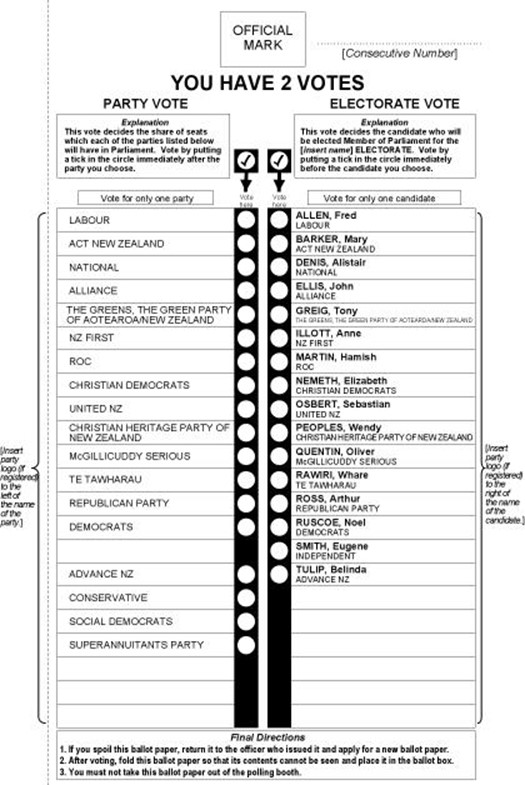
Under first past the post, it didn’t matter who you voted for if you lived in a safe electorate because the local MP of whatever political party would always be elected.
What is underplayed in these conversations is how close all elections are in New Zealand, and how likely it is that your vote might be decisive rather than just one of millions.
Under MMP, the last seat in Parliament is a contest between several parties. If anyone just gets a couple of dozen more votes, they get another seat.
In the current parliament of 121, the National Party Government has 59 seats, with the ACT party one seat and the United Future Party one seat.
One more seat for ACT or one less seat for the National Party would have made a big difference to the election outcome. ACT was only 45 votes short of getting that second seat in the 2011 General Election.
Note: Under MMP, the New Zealand House of Representatives is a mix of MPs from single-member electorates
and those elected from a party list, and a Parliament in which a party’s share of the seats roughly mirrors its share of the overall nationwide party vote. There is a minimum party vote threshold to get into Parliament. The party votes of those parties with less than 5% of the party vote do not count unless they win a constituency seat.
U.S. voter demographics by age
23 Jul 2014 Leave a comment
in politics - USA Tags: voter demographics

All good things comes to those that wait – they deserve each other
23 Jul 2014 Leave a comment
in politics - Australia Tags: Adam Bandt, bad karma, Clive Palmer, vengeance is mine said the Lord

For those who have better things to do in their lives than follow minor parties in Australian politics, Clive Palmer is from a socially conservative economic nationalist party called the Palmar United Party; Bandt is from a socially liberal economic nationalist party– the Greens. Both are MPs sitting in the Australian House of Representatives on the cross-benches.
Margaret Thatcher’s brilliant last Prime Minister’s Question Time
20 Jul 2014 Leave a comment
in politics Tags: Margaret Thatcher
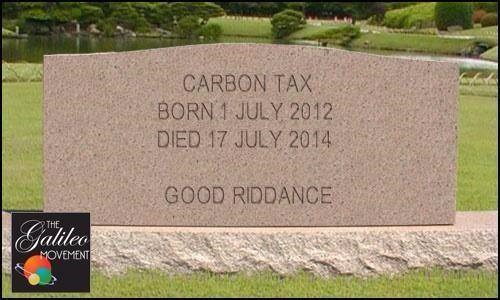
Australia’s carbon debate mirrors global follies
19 Jul 2014 Leave a comment
in environmental economics, global warming, politics - Australia Tags: carbon tax, expressive voting





Recent Comments