In praise of measurement error: good thing no one noticed the severe deflation in Australia and in New Zealand in the late 1990s for otherwise the do-gooders might have felt the need to do something about it. Good thing no one is panicking over the recent mild deflation in New Zealand as well.
Mass kidnappings is the only charitable explanation for their failure to be dancing in the streets by Eart Day activists over the greening of the planet courtesy of capitalism since Earth Day 1970?
As a soon-to-be parent, I find this fascinating and terrifying. The diminishing range of children visualized: http://t.co/7NiFN9Eaw0— Austen Allred (@AustenAllred) April 18, 2015
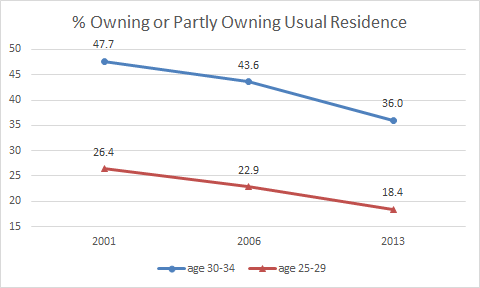
Might be more interesting to breakdown the pie charts as a single time series for 25 to 29 and 30 to 34 year-olds as the latter are more likely to be settling down and buying a house.
The number of New Zealanders who own or partly owned their residence in the really 30s has dropped from almost one in two falling towards one in three since 2001. Generation Rent is very much the majority of New Zealanders aged 30 to 34.
For those New Zealanders aged 25 to 29, instead of one in four at least partly owning their residences, as was the case in 2001, the number of those aged 25 to 29 buying or owning their own house has dropped to less than one in five.
Generation Rent for those aged 25 to 29 has gone from a majority tendency to the dominant state for those in their late 20s. In both cases, the emergence of Generation Rent has sped up since 2006.
The emergence of generation rent coincided with a sharp increase in prices in real terms in New Zealand while housing prices against rents became far less competitive.
Jackie Blue, despite the resources of the Human Rights Commission, did not Google her own web site for the biography of the Chief Commissioner of the Human Rights Commission.
KiwiBlog has noted that the headline of “Ex All Black becomes Chief Executive” is common with David Kirk referred to as an ex All Black despite a successful business career.
Cara McDaniel went to the mammoth task of constructing average tax rates for 15 OECD countries over the period 1950-2003 for consumption, investment, labour and capital:
Total tax revenue is divided into revenue generated from four different sources: consumption expenditures, investment expenditures, labour income and capital income.
To find the average tax rate, tax revenue from each source is then divided by the appropriate income or expenditure base.
She used that data to examine the role of taxes and productivity growth as forces influencing market hours. She used a calibrated growth model extended to include home production and subsistence consumption, both of which were key features influencing market hours. Her model was simulated for 15 OECD countries. She found the primary force driving changes in market hours is found to be changing labour income tax rates and productivity catch-up relative to the United States is found to be an important secondary force.
I thought I would summarise the tax rate data computed by Cara McDaniel for Australia and New Zealand.
McDaniel’s data on average tax rates on household incomes in Australia and New Zealand suggests that the average tax rate New Zealand household incomes fell by a third since 1986. No estimates were calculated for earlier years for New Zealand.
As for Australia, taxes steadily increased between 1959 and 1987 stabilised until 2005 and then fell a bit.
There is a big spike in the average tax rate on consumption expenditure in New Zealand in 1986 when a GST replaced the pre-existing sales taxes. The average tax rate on New Zealand consumption expenditures and tapered away until the end of2009 and started to increase again.
Not much happened in Australia regarding the average tax rate in consumption expenditures since about 1983 despite the introduction of a GST in 1998.
The average tax rate in capital income in Australia is much higher than in New Zealand. On the other hand, the average tax rate on investment expenditure is much higher New Zealand as compared to Australia.
Taxes on investment expenditures increased quite significantly at the same time that a GST was introduced in New Zealand.
All in all, New Zealand cut taxes on personal income but that tax cut seemed to be pretty much offset by higher taxes on personal consumption through the introduction of a 10% and then 12.5% GST.
The most interesting finding in this database is the sharp increase in the average tax on investment expenditures in the mid-1980s. This prolonged New Zealand’s lost decades – the two decades of next to no GDP growth per working age New Zealander.
Real GDP per New Zealander and Australian aged 15-64, converted to 2013 price level with updated 2005 EKS purchasing power parities, 1956-2013
A local doctor thinks we can abolish child poverty in New Zealand with $1 billion in increases to welfare benefits and family allowances.
During the 1987 Australian Federal election campaign, Labour Party Prime Minister Bob Hawke announced a Family Allowance Supplement that would ensure no Australian child need live in poverty by 1990.
Child poverty was to be no more in Australia by 1990. These changes in social welfare benefits and family allowance supplements would ensure that every family would be paid one per week dollar more than the poverty threshold applicable to their family situation. I know child poverty was to be done in this way because I worked in the Prime Minister’s Department at this time.
It was a silly shorthand thing,” Mr Hawke has told News Limited newspapers. “I should have just said what was in the distributed speech.” “We set ourselves this first goal: by 1990 no Australian child will be living in poverty,” Mr Hawke said on June 23, 1987 at an election campaign launch. The comment entered Australian political folklore after it was supposed to improve the ALP’s major social welfare reform. The printed version had it as: “By 1990 no Australian child need live in poverty.” Mr Hawke’s words returned to haunt him as his pledge was impossible to keep.
About 580,000 Australian children lived in poverty in 1987. In 2007, at least 13 per cent of children, or 730,000 people, were poor. This was after social welfare benefits and family allowance supplements were increased to $1 above the child poverty threshold.
There is an infallible test of the practicality of Left over Left dreams such as the abolition of child poverty by writing bigger and bigger cheques to those currently poor.
If you could abolish child poverty simply by increasing welfare benefits and family allowances, the centre-right parties would be all over it like flies to the proverbial as a way of camping over the middle ground and winning the votes of socially conscious swinging voters for decades to come. Many people who would naturally vote for the centre-right parties on all other issues vote over to centre-left parties out of a concern for poverty and a belief that centre-left parties will give a better deal to the poor.
Countries all round the world have attempted to buy their way out of poverty by lifting welfare benefits and family allowance rates with no success. Simon Chapple is also quite clear that social welfare benefits reduce the incentive to work.
The payment of welfare benefits to families who do not work creates a number of potential issues. Firstly, as it guarantees an income to people not in paid employment, including those with children, it creates incentives not to work. While theoretically indisputable, much debate surrounds how large this effect is in practice, and how best to offset it.
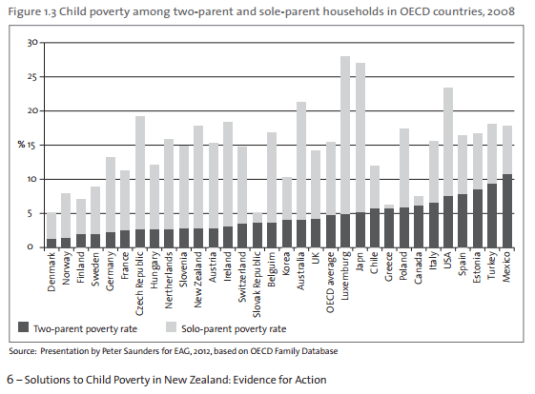
There is child poverty in northern European and Scandinavia despite the most generous possible welfare states. Most of this child poverty is among single parent families in all industrialised countries.
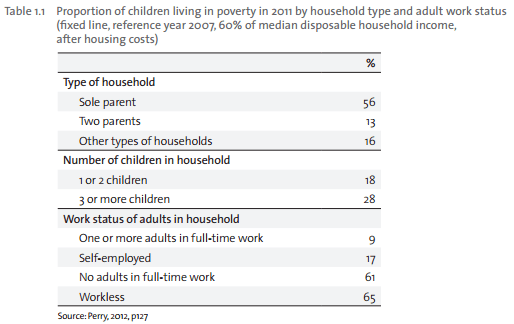
Around 60 percent of New Zealand children in poverty are in social welfare beneficiary households, and most of these are sole-parent households.
Child poverty rates are lower in the Nordic states but the Nordic states expectation that mothers will return to the workforce rapidly – when their child is 1 to 3 years old. Employment is front and centre in the Nordic welfare state strategy to reduce child poverty.
The notion that poverty is simply the result of a lack of money and giving people more money will abolish child poverty has never worked. As the OECD (2009, p. 171) observed:
It would be naïve to promote increasing the family income for children through the tax-transfer system as a cure-all to problems of child well-being.
The only major success in reducing beneficiary numbers anywhere has been time limits in the USA in 1996. Time limits on welfare for single parents reduced caseloads by two thirds, 90% in some states.
After the 1996 US Federal welfare reforms, the subsequent declines in welfare participation rates and gains in employment were largest among the single mothers previously thought to be most disadvantaged: young (ages 18-29), mothers with children aged under seven, high school drop-outs, and black and Hispanic mothers. These low-skilled single mothers were thought to face the greatest barriers to employment. Blank (2002) found that:
…nobody of any political persuasion predicted or would have believed possible the magnitude of change that occurred in the behaviour of low-income single-parent families.
Employment are never married mothers increased by 50% after the US well for a reforms: employment a single mothers with less than a high school education increased by two thirds: employment on-going single mothers string ages of 18 in 24 approximately doubled. With the enactment of welfare reform in 1996, black child poverty fell by more than a quarter to 30% in 2001. Over a six-year period after welfare reform, 1.2 million black children were lifted out of poverty. In 2001, despite a recession, the poverty rate for black children was at the lowest point in national history.
This great success of US welfare reforms was after a quarter of six century of no progress, poverty among single mothers and among black children declined dramatically.
The best solution to child poverty is to move their parents into a job. Simon Chapple is also quite clear in his book last year with Jonathan Boston that a sole parent in full-time work, and a two parent family with one earner with one full-time and one part-time worker, even at low wages, will earn enough to lift their children above most poverty thresholds. Welfare benefits trap children in poverty.
Sustained full-time employment of sole parents and the fulltime and part-time employment of two parents, even at low wages, are sufficient to pull the majority of children above most poverty lines, given the various existing tax credits and family supports.
The best available analysis, the most credible analysis, the most independent analysis in New Zealand or anywhere else in the world that having a job and marrying the father of your child is the secret to the leaving poverty is recently by the Living Wage movement in New Zealand.
According to the calculations of the Living Wage movement, earning only $19.25 per hour with a second earner working only 20 hours affords their two children, including a teenager, Sky TV, pets, international travel, video games and 10 hours childcare. This analysis of the Living Wage movement shows that finishing school so your job pays something reasonable and marrying the father of your child affords a comfortable family life.
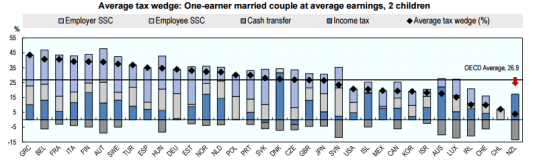
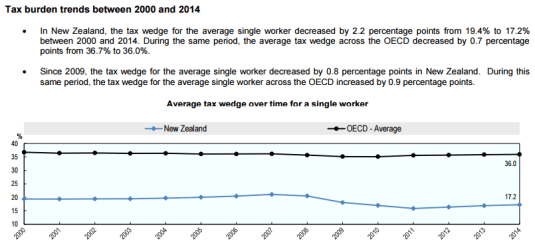
Taxes on wages have risen by about 1 percentage point for the average worker in OECD countries between 2010 and 2014 even though the majority of governments did not increase statutory income tax rates…
The highest tax wedges for one-earner families with two children at the average wage were in Greece (43.4%), Belgium (40.6%) and France (40.5%). New Zealand had the smallest tax wedge for these families (3.8%), followed by Chile (7%), Switzerland (9.8%) and Ireland (9.9%). The average for OECD countries was 26.9%… Child related benefits and tax provisions tend to reduce the tax wedge for workers with children compared with the average single worker. In New Zealand in 2014, this reduction (13.4 percentage points) was greater than for the OECD average (9.1 percentage points).
ONE News can exclusively reveal the Workplace Relations Minister is leaning towards outlawing the contracts and other employment provisions that he sees as unfair…
Mr Woodhouse has previously said a ban of zero-hour contracts would be an overreaction, but signalled the outlawing of aspects including:
•Restraint of trade clauses that stop someone working for a competing business if an employer does not provide the desired hours of work.
•The cancellation of shifts at short or no notice.
One reason for this is to neutralise a wedge issue with the Labour Party. The labour parties in both New Zealand and United Kingdom plan to outlaw zero hours contracts.
Aaron Director pointed out that there are many real world business practices that behave differently from the caricatures in textbooks and arouse suspicious responses from economists (as well as from lay observers including lay observers with no ideological agenda).
Director said that visions of market power dance their heads and some of these suspect practices have been regulated for reasons he attributed in a large part to intellectual laziness. Ronald Coase made the same observation about knee-jerk responses to perplexing new business practices:
One important result of this preoccupation with the monopoly problem is that if an economist finds something—a business practice of one sort or other—that he does not understand, he looks for a monopoly explanation.
And as in this field we are very ignorant, the number of ununderstandable practices tends to be rather large, and the reliance on a monopoly explanation, frequent.
Much of the lasting influence of Aaron Director and of Ronald Coase came from their ability to show that simple judgements about business practices often cannot withstand rigorous scrutiny.
The organisation of and the contracting practices in the labour market is not a complicated despite the best efforts of the Left over Left and unions to pretend that it is so, as Richard Epstein explains:
Labour markets are not characterized by tricky externalities. They do not pollute streams or require the creation of public goods.
They are not characterized by genuine breakdowns in information, as workers are in a position to observe the conditions of their employment on a day-to-day basis.
Left to their own devices, without explicit support from union activities, they will be highly competitive, and thus work hard to allocate scarce human capital to its most productive use.
Workers have the option to quit for higher wages, and employers can always seek out low cost techniques to reduce their labour costs. Any short-term dislocation for firms or individuals is more than offset by the overall increase in the system productivity, spurred in part by clear signals that should increase investments in human capital.
In the UK,the Work Foundation found that 80% of those on zero hours contracts are not looking for another job; only 26% wanted longer hours. This implies that 74% were content with their current work times arrangements.
The inherent inequality of bargaining power between employers and workers and the reserve army of the unemployed must not be all that they are cracked up to be these days if low paid workers have to sign legally enforceable restraint of trade agreements, which is a common complaint about zero hours contracts. The worker does not have guaranteed hours but must promise not to work for someone else in the same line of business.
Obviously, the few members of the reserve army of the unemployed lucky enough to have a low pay, insecure job that offers no regular hours have so many other job options that their employers must get them to agree not to quit and job-hop at will. Jobs must be readily available to low paid workers for otherwise why do employers insist on this restraint of trade in employment agreements?
If there is an inherent inequality of bargaining power between the bosses and the workers, why do employers seek restraint of trade agreements against these downtrodden workers who are supposed to have few options but to accept the miserable zero hours job offer before them?
The question that must always be asked is why do people deemed competent to vote and drive cars sign zero hours contract? What is in it for them – for the worker who signs these contracts – especially for workers who already have a job and are switching to a zero hours contract? David Friedman asked this question about the economics of restraint of trade agreements for employees:
…the employer who insists on an employee signing a non- competition agreement will find that he must pay, in additional wages or other terms of employment, the cost that the agreement imposes upon the employee, as measured by the employee and revealed in his actions.
It follows that the employer will insist on such an agreement only if he believes that its value to him is greater than its cost to the employee… The contract is designed, after all, with the objective of getting the other party to sign it.
If I am designing the contract and offering it to many other parties, that may put me in a position to commit myself to insisting on terms that give me a large fraction of the benefit that the contract produces. But it is still in my interest to maximize the size of that net benefit-which I do by only insisting on terms that are worth at least as much to me as they cost the other party.
If zero hours contracts are as bad as the Left over Left claim, the job quit rates for these contracts should be high, and people moving from existing jobs should be under-represented in this section of the labour force. If a worker already has a job, they have few reasons to sign up to such a purportedly poor job offer. Show me the evidence.
The welfare state has a long history of providing some of its support to the needy in kind rather than in cash. This can range from soup kitchens to public housing as well as food stamps.
In the USA, food stamps provide provide food-purchasing assistance for low- and no-income people living. Food stamps can only be exchanged for food.
Instead of requiring the poor and needy to attend a soup kitchen, they can be given vouchers to buy food at supermarkets and take it home and cook at themselves. These days some sort of debit card system can be used where purchases are restricted to food at supermarkets and other participating retailers.
A close parallel with food stamps, properly understood, is free school breakfast programs. The welfare state is providing in-kind support to hungry children. This is done at school, to ensure that the children eat the meals.
Rather than rely on their parents to spend their welfare benefits and income support on food for their children, the food is given directly to the children when they arrive at school in the morning. In New Zealand, these free school breakfast programs are restricted to schools in low income areas.
There is a Feed the Kids Bill in Parliament sponsored by the Green Party. I have frequently criticised this proposal as it doesn’t provide breakfast to needy children at the weekends and school holidays. They are left to go hungry. Abandoned by their so called social justice champions through lack of imagination and self-awareness.
If children are showing up at school without their breakfast on a regular basis, their parents should reported that the child protection authorities for intervention. This can start with budget advice and assistance with applying for any additional and emergency financial support they are eligible for from Work and Income New Zealand.
Soup kitchens not only provides people with food, it provides various other assistance to help people to get back on their feet.
If you were proposing a food stamps program in New Zealand because children are going hungry, you’ll be laughed at if you suggested it should only apply the part of the year such as during the school term.
That is precisely what the Greens are doing. The only difference is how they are organised the provision of in-kind support to children, this case, food. Instead of their parents collecting a debit card that can only be used to buy food, the food is eaten by their children at school.
Why Evolution is True is a blog written by Jerry Coyne, centered on evolution and biology but also dealing with diverse topics like politics, culture, and cats.
In Hume’s spirit, I will attempt to serve as an ambassador from my world of economics, and help in “finding topics of conversation fit for the entertainment of rational creatures.”
“We do not believe any group of men adequate enough or wise enough to operate without scrutiny or without criticism. We know that the only way to avoid error is to detect it, that the only way to detect it is to be free to inquire. We know that in secrecy error undetected will flourish and subvert”. - J Robert Oppenheimer.


 Soup kitchens not only provides people with food, it provides various other assistance to help people to get back on their feet.
Recent Comments