
In these more prudish times, anti-prohibitionists cannot be this blunt about personal liberty
22 Dec 2014 Leave a comment
A taxonomy of 24 authoritarian types
22 Dec 2014 Leave a comment
in liberalism, politics - New Zealand, politics - USA Tags: economics, expressive voting, ideologies, Personality traits
Did the World Bank just solve the puzzle of low NZ growth relative to Australia?
20 Dec 2014 1 Comment
in economic growth, macroeconomics, politics - New Zealand Tags: lost decades
The World Bank published a major 300 odd page report that discussed puzzles of economic growth around the world included a chapter on New Zealand’s slow economic growth relative to Australia.
The World Bank publication is copyrighted 2015, so I assume that it has been published very recently. However, the data analysis in the chapter on New Zealand stop in 2002.
The conclusions of the World Bank with regard to the emergence of the trans-Tasman income gap were as follows:
The extent of economic freedom—as determined by propelling institutions—evolved in a similar manner in both countries.
The small differences in propelling institutions in both countries mostly netted out and as such cannot account for the differences in economic performance.
One exception was the fiscal position of the state—a rise in public expenditure after the first oil crisis entailed increased tax burdens in both countries.
A particularly sharp rise in taxation in New Zealand (in comparison to Australia) occurred during the country’s second downturn.
Differences in the size of the public sector figure prominently in the analysis of the World Bank of the emergence of the trans-Tasman income gap. The measure by the World Bank of the size of the public sector in New Zealand and Australia is reproduced below – its figure 3.3.
Figure 3.3 Government expenditure in Australia and New Zealand, 1970–2002
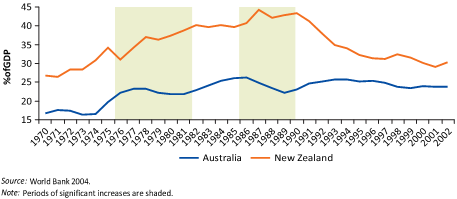
In particular, the World Bank was concerned about the rapid growth in the size of the public sector in New Zealand while the size of the public sector was shrinking in Australia:
In 1977–82 Australia’s government expenditure rose more slowly than that of New Zealand (and in 1975–80 Australia’s expenditure was smaller than New Zealand’s by 13 percent of GDP.
Then, as relative economic growth declined in New Zealand, between 1987 and 1990 public expenditure increased by around 5 percent of GDP from the 1982–86 level. In the meantime, public expenditure in Australia fell by 4 percent of GDP.
As a result, the difference in the general government expenditure level between New Zealand and Australia increased to over 18 percent of GDP in 1987–90.
After 1990 and until 2002 government spending in New Zealand decreased steadily—from approximately 44 percent of GDP in 1990 to roughly 30 percent of in 2002.
In Australia this expenditure was maintained at an average of 25 percent of GDP over the same period (see figure 3.3 with highlighted periods of significant increases of government expenditures in New Zealand).
A spike in the size of state sector in the 1980s may explain a delay in productivity growing rapidly again, but the state sector in New Zealand is now smaller.
Indeed, figure 3.3 above shows that the public sector in New Zealand as measured by general government expenditure has fallen by a quarter in size, by 10 percentage points of GDP in a matter of seven years between 1990 and 1996. There should be rapid growth because of the greatly reduced crowding out by the state sector but that rapid growth is not there.
Figure 2 shows that GDP growth per working age New Zealander resumed at its trend rate of 2% after 1992. This resumption of growth was in conjunction with the decline in the size of public sector tax burden rather than after it. Figure 2 shows that there was no significant growth in real GDP per working age New Zealander from 1974 to 1992. New Zealand lost almost two decades of productivity growth. Real GDP per New Zealander aged 15-64 on a purchasing power parity basis dropped from equality with Australia up until 1974 to a 30 per cent gap by 1992.
Figure 2: Real GDP per New Zealander and Australian aged 15-64, converted to 2013 price level with updated 2005 EKS purchasing power parities, 1956-2012
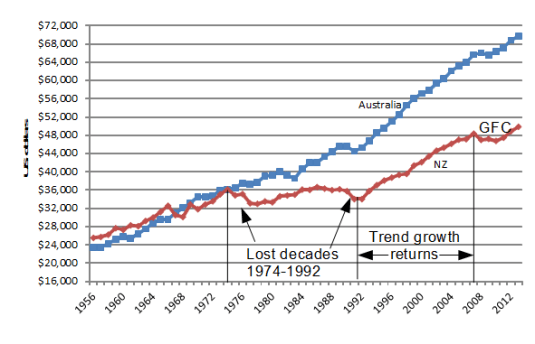
Source: Computed from OECD Stat Extract and The Conference Board, Total Database, January 2014, http://www.conference-board.org/economics
There was no growth rebound when the burden of an oversized public sector was lifted. That is the greater puzzle. The World Bank did not address that greater puzzle. If there is a global pool of useful technological knowledge accessible at a low cost by suitably prepared people, what stops New Zealand from using this knowledge to grow faster until it catches-up with Australia and the USA?
Another puzzle for the World Bank is that it is using general government expenditure estimates by the OECD.
When tax revenue as a percentage of GDP is used to measure the size of the public sector and the burden on private sector initiative, figure 3 shows that the tax burden in the two countries is not that different and is in the low 30% range, not the 40% plus range as is suggested by the general government expenditure data in Figure 3.3.
Figure 3: tax revenue as a percentage of New Zealand and Australian GDP, 1965-2011
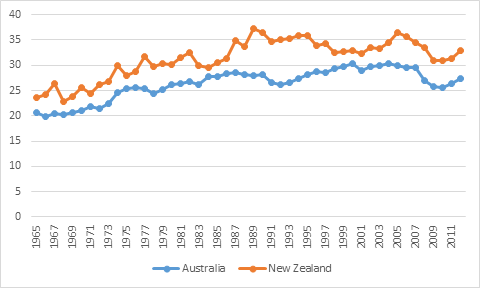
Source: OECD Stats
There are no 14 point gaps in tax burdens in figure 3 as suggested in the World Bank’s analysis. This is because the World Bank’s using general government expenditure shown in its figure 3.3 reproduced above.
A major conclusion about the causes of New Zealand’s poor growth performance in the last few decades should be robust to different measures of the size of the public sector, but it is not.
Economic reforms returned real GDP growth per New Zealander aged 15-64 from no growth from 1974 to 1992 to the previous two per cent trend rate from 1993. There was no sustained productivity growth rebound beyond 2 per cent growth a year for New Zealand to recover the lost ground in the 1980s and 1970s. That is the great puzzle that the World Bank did not address, much less solve.

Was Moynihan, right? The role of prospective success in assortative mating in family poverty
19 Dec 2014 1 Comment


The war on drugs: Drug induced mortality rates compared
18 Dec 2014 Leave a comment
in applied welfare economics, comparative institutional analysis, economics of regulation, political change, politics - Australia, politics - New Zealand, politics - USA Tags: drug decriminalisation, marijuana decriminalisation, Portugal, war on drugs
How much do the top income earners actually earn in NZ?
16 Dec 2014 Leave a comment
in economic history, income redistribution, labour economics, politics - New Zealand, Rawls and Nozick Tags: top 1%

Source: topincomes-parisschoolofeconomics
Note: top income share data for adults for New Zealand adults go back only as far as 1953.
To begin with, a large number of people who see themselves as middle class will have to reclassify themselves in terms of class membership.
More importantly, they will have to pick up on their class consciousness because they are either in the top 10% as any successful professional is because the average income of the top 10% in New Zealand is $128,000. With a bit of luck, these members of the ruling class will be able to afford a house in Auckland without having to borrow from mum and dad.
Pretty much every successful professional is in the top 5% in New Zealand, with an average income of $170,000.
These rich have a lot of people look down upon and order about as junior or senior members of the ruling class, even if they did know they were a member of the ruling class until they looked at the diagram above. Welcome to the ruling class. Goodbye to the middle-class. Get over it.
As for the top 1% in New Zealand, they have an average income in 2011 of $336,000. Once again, successful professionals, successful entrepreneurs and what’s left of the rentier class will have to accept that supreme power as the ruling class of the capitalist system is open to just about anybody who does well at university and enters the professions. Are there no standards?
As for the top 0.5%, data on the top 0.1% stopped in 1989, they earned an average of $457,000 a year in 2011. That is starting to look like good money, though you do have to brush shoulders with celebrities, athletes and more than a few successful small entrepreneurs, but at least you are starting to earn a lot more than your average suburban doctor who is a member of the top 10%.
The ruling class is not what it used to be – the rentier class, old money. That the rich of today – the ruling class of the capitalist system – is open to many ordinary people who are new rich or just plain urban professionals, athletes, musicians and celebrities is a common finding all round the world. As Piketty and Saez explained for the USA:
This rise in top income shares is not due to the revival of top capital incomes, but rather to the very large increases in top wages (especially top executive compensation).
As a consequence, top executives (the “working rich”) have replaced top capital owners at the top of the income hierarchy over the course of the twentieth century.
Many of the rich both in New Zealand and overseas are working rich who made their money themselves and came from middle class or upper middle-class backgrounds.
Many of these rich are well educated smart people rather than the inheritors of wealth. The working rich and most of the rich of the 21st century must be well educated because so many of them are professionals in occupations where you must succeed at university to get in the ground floor, or they are athletes, musicians and other celebrities who must work their way up from the bottom.
A large number of New Zealanders who regarded themselves as middle class action are part of the rich – the top 10%, top 5% and banging on the doors of the top 1% or better – so they better start carrying themselves about with the airs and graces of the ruling class. Better practice by putting a plum in your mouth.
p.s. There was a big spike in top incomes in 1999. It seems like a lot of people in New Zealand brought forward income in 1998 and 1999 in anticipation of the election of a Labour Party government in the 1999 New Zealand general election, and an immediate increase in the top tax rate from 33% to 39% for incomes over $60,000.
The top 10% are a bunch of bludgers in New Zealand too
16 Dec 2014 Leave a comment
in economics of education, income redistribution, politics - Australia, politics - New Zealand, politics - USA Tags: education premium, top 1%
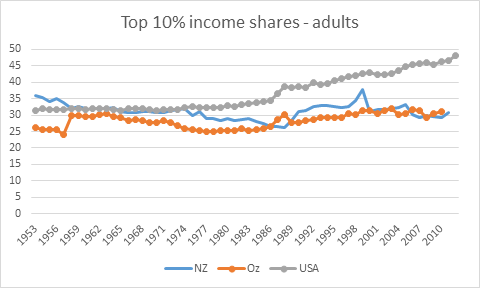
Source: topincomes-parisschoolofeconomics
One reason why the top 10% in New Zealand have been a pretty ordinary lot compared to the USA is New Zealand’s university graduate premium – the college premium as it is known in the USA – is at the very bottom of the OECD ladder at about 18% – rock bottom 32nd out of 32 – the wooden spoon.
The College premium in the USA is about 64%, as shown in the OECD data below from OECD Education at Glance. Naturally, this high College premium in the USA should show up in well educated, highly skilled people earning a lot more than those that don’t go to college and don’t go to graduate school.
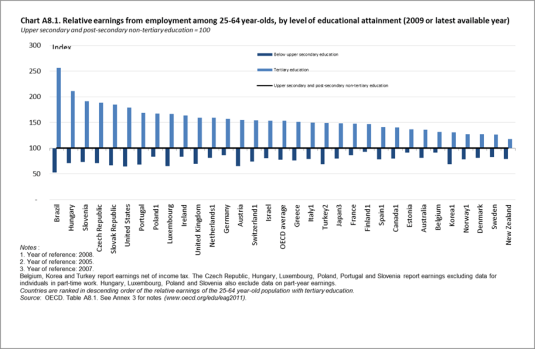
Stats link: http://dx.doi.org/10.1787/888932460515
Little wonder that the USA top 10% are breaking away from the pack. This slow increase in the income share of the top 10% since the early 1970s coincided with large numbers, including many more women in long duration professional degrees, going to university.
Prior to the mid-1970s, the College premium in the USA had been falling for about a decade because of large numbers of people going on to College and many of these two graduate school to get a draft deferment.
People married younger then so by the time people were at the end of College or graduate school, they were usually married with children and got of further draft deferment and aged out of the draft system.
The top 1% in New Zealand have been bone lazy for at least 60 years now
16 Dec 2014 2 Comments
in income redistribution, politics - Australia, politics - New Zealand Tags: top 1%

Source: topincomes-parisschoolofeconomics
Note: top 1% income share data for adults for New Zealand adults go back only as far as 1953.
The top 1% in New Zealand have had a good 60 years to immiserate the proletariat and what are they done? Nothing!
The top 1% share of national income is much the same as it was in 1953! The Australian top 1% haven’t done much better. Bludgers, the lot of them.
What do the Occupy movement have to protest about in New Zealand if the rich haven’t been getting richer?

Further evidence of the dynamic, deregulated nature of the New Zealand labour market
15 Dec 2014 2 Comments
in economics of regulation, labour economics, law and economics, politics - Australia, politics - New Zealand, politics - USA, unemployment Tags: employment law, employment protection, labour market dynamics, labour market regulation
The chart below shows that New Zealand is far more flexible than Western Europe and is pretty near the USA in terms of people moving in and out of the unemployment pool every month with great ease. There are very high outflow rates from unemployment among the Anglo-Saxon and Nordic economies. The economies of Continental Europe stand in stark contrast. Unemployment outflow rates in these economies lie below 10% at a monthly frequency.
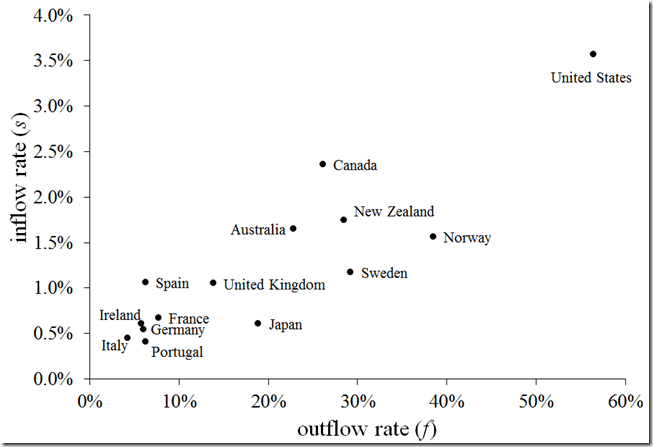
Source: Unemployment Dynamics in the OECD, Elsby, Hobijn and Şahin (2013).
Global warming – where there is and is not a consensus to deny | Ordinary Times
14 Dec 2014 Leave a comment
in applied welfare economics, climate change, environmental economics, environmentalism, global warming, Karl Popper, politics - Australia, politics - New Zealand, politics - USA, Public Choice Tags: climate alarmism, expressive voting, global warming

The motte for climate change activists are the following:
- Global temperatures are rising.
- Greenhouse gases lead to increased temperatures.
- Greenhouse gases emitted by humans have led to measurable increases in temperature beyond what would have occurred without any humans.
The above points are highly defensible because Science. I believe they are true (though I do so only via trust in others rather than having evaluated any of the research involved personally).
Activists, however, do not sit in this motte for long. They often go on to make a lot of other claims in the bailey:
- Long-term projections of the Earth’s climate are accurate.
- Catastrophe will result in a few decades due to human carbon emissions.
- Nuclear energy is not a viable alternative to fossil fuels.
- Carbon capture is not viable.
- Geoengineering is not viable.
- Unilateral subsidization of renewables by Western industrialized nations is an effective way to reduce global emissions of greenhouse gases.
- Subsidies of energy-efficient products are a better use of resources rather than research and development.
- Subsidizing vehicles that pollute less than other vehicles will provide a net reduction in greenhouse emissions.
- LEED-certified buildings are more energy-efficient than old buildings.
- Building new LEED-certified buildings reduces net greenhouse emissions relative to not building them.
- Sending oil by railcar will result in less net emissions than sending oil through a pipeline (e.g. the Keystone pipeline).
Not all activists make all of these claims, but I think most make at least some claims that are less defensible than those in the motte.
The end result is that anyone who opposes any of the views, even questionable ones sitting in the bailey, can be branded an anti-science denialist. Strictly speaking, this is unfair since there certainly isn’t a scientific consensus on questions like whether it makes sense to spend thousands of dollars subsidizing Chevy Volts while taxing bicycles and safety helmets at 8%.
via An Example of the Motte and Bailey Doctrine | Ordinary Times.


Recent Comments