Be careful for what you wish for when you call for moderation and bipartisanship in politics
20 Apr 2015 Leave a comment
in economic history, income redistribution, politics - USA, Public Choice, rentseeking Tags: bipartisanship, expressive voting, growth in government, ideology, median voter theorem, political polarisation, rational irrationality
Computers are taking gerrymandering to a whole new level
19 Apr 2015 Leave a comment
in politics - USA, Public Choice Tags: gerrymandering
You know I heart you Chicago, but u killing me tonight. Mayoral race notwithstanding, this is gerrymandered 2nd ward http://t.co/Fnq75tup06—
Caroline Vanderoef (@CAVandy) February 25, 2015
The political ideology of libertarians
19 Apr 2015 Leave a comment
in liberalism, libertarianism, politics - USA Tags: voter demographics
What are the revenue effects of capital gains tax cuts?
19 Apr 2015 Leave a comment
in politics - Australia, politics - New Zealand, politics - USA, public economics Tags: dynamic scoring, laffer curve, optimal taxation, taxation of capital income
Average tax rates on consumption, investment, labour and capital in USA, UK and Canada, 1950-2013
17 Apr 2015 5 Comments
in business cycles, economic growth, economic history, fiscal policy, global financial crisis (GFC), great recession, macroeconomics, politics - USA, public economics Tags: British economy, Canada, sick man of Europe, tax incidence, tax reform
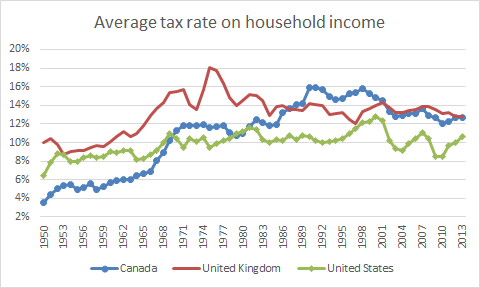
Income taxes in the USA and UK didn’t change all that much after the mid-70s. Prior to that, income tax rose quite steadily in the UK in the 1950s and 1960s and not surprisingly, Britain was the sick man of Europe in the 1970s. Income taxes rose quite steadily in Canada for most of the post-war period up until 1990 and then levelled out for most of that decade before a small tapered downwards.
Source: Cara McDaniel.
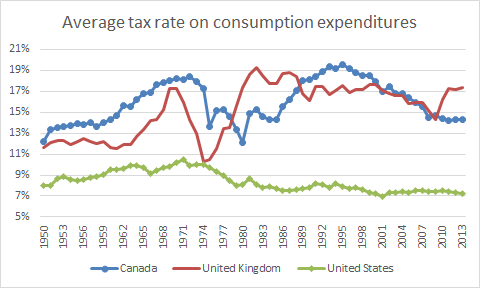
Taxes on consumption expenditure were very different stories across the Atlantic. There has been a tapering down in the average tax rate on American consumption expenditure since 1970 after modest increases before that. Canadian taxes on consumption expenditure rose steadily until the 1970s, then drop steadily in the 1970s and than rose in the 1980s and dropped again after 1992. British taxes on consumption expenditure rose sharply in the late 1960s, dropped sharply and then rose again in the 1970s and was pretty steady after that.
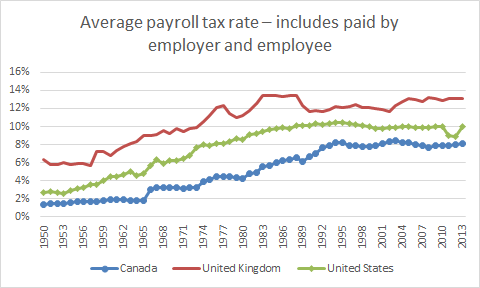
The sleeper tax in all three countries was payroll taxes to fund social security and the welfare state. These rose steadily in the USA, UK and Canada up until the 1990s.
Source: Cara McDaniel.
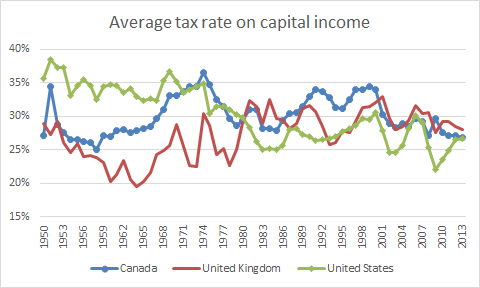
Despite all that nonsense about neoliberalism from the Left over Left, the average rate of tax on capital income did not appear to change much at all over the last 50 years. There was a modest taper in US capital income taxation from the mid-30s to the mid-20s over the entire post-war period. The average Canadian tax rate on income from capital rose steadily in the 60s, fell steadily in the 70s before rising again in the mid-1980s and fell again after 2000. The average British tax rate on capital income rose steadily in the 60s and 70s, coinciding with the emergence of Britain as a sick man of Europe, and then stabilised in the the 1980s onwards but with a dip in the late 80s before a rise in the early 1990s.. Despite the large cuts in the statutory corporate tax rate in the UK, there was only a mild taper in the average tax rate on capital income in the UK.
Source: Cara McDaniel.
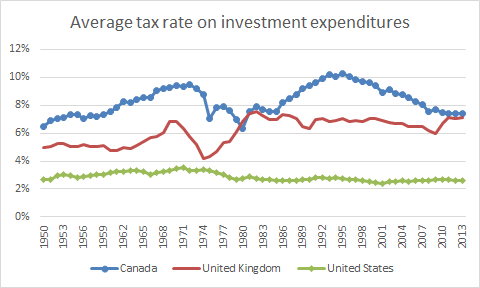
The average tax rate on investment expenditures is pretty stable in the USA for the entire post-war period. The only significant increase in the average tax rate on investment expenditures in the UK coincided with the emergence of the sick man in Europe after a drop in the early 70s. The average tax rate on investment expenditures do not change at all in the UK after the 1970s. The Canadian average tax rate on investment expenditures is higher than elsewhere. It rose steadily in the 50s and 60s, dropped in the 70s and rose again in the 80s before tapering from 1992 onwards.
Source: Cara McDaniel.
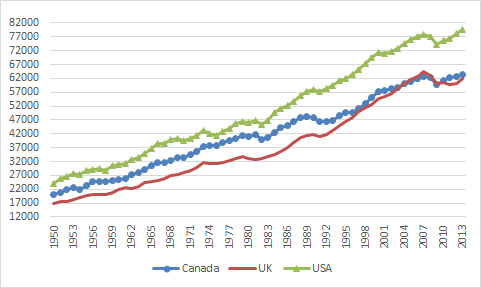
These higher on rising taxes and the UK and Canada did nothing for either country in catching up with the USA. The figure 1 below shows real GDP per working age per American, Canadian and British.
Figure 1: Real GDP per Canadian, British and American aged 15-64, converted to 2013 price level, updated 2005 EKS purchasing power parities, 1950-2013
Source: Computed from OECD StatExtract and The Conference Board, Total Database, January 2014, http://www.conference-board.org/economics
The USA is pulling away from Canada and the UK in GDP per working age person. The exception is British economy from about 1990 onwards which caught up with Canada.
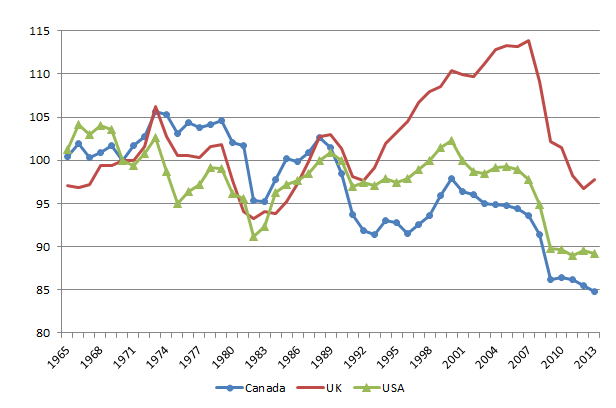
Figure 2, which is detrended GDP data, illustrates the British economic boom in the 1990s. Each country’s annual economic growth rate is detrended by 1.9%, the detrending value currently used by Ed Prescott. A flat line is growth at 1.9%, a rising line is above trend growth, a falling line is below trend growth.
Figure 2: Real GDP per Canadian, British and American aged 15-64, converted to 2013 price level, updated 2005 EKS purchasing power parities, detrended 1.9%, 1950-2013
Source: Computed from OECD Stat Extract and The Conference Board, Total Database, January 2014, http://www.conference-board.org/economics
Figure 2 shows that Canada has been in a long-term decline since the mid-1980s with much of this decline coinciding with periods of rising taxes on income from labour.
The British economy boomed in the 1990s, after the tax hikes of the 1970s and early 80s were reversed. This growth dividend was squandered by the Blair government in the 2000.
Figure 2 also shows that US growth was rather stable with some ups and downs up until 2007, expect during the productivity slowdown in the 1970s. The first major departure from trend growth of 1.9% was with the onset of the great recession.
Support over time from marijuana decriminalisation was twin peaked in the USA
17 Apr 2015 Leave a comment
in economics of crime, law and economics, politics - USA Tags: marijuana decriminalisation, medical marijuana decriminalisation, voter demographics

The Obamas’ tax return
17 Apr 2015 Leave a comment
in politics - USA, public economics Tags: obama
You know you're curious– take a look at Obama's 1040: urbn.is/1JHnxvd #taxday http://t.co/M958cQoLVv—
Urban Institute (@urbaninstitute) April 15, 2015
DNA and death row exonerations
17 Apr 2015 Leave a comment
in law and economics, politics - USA Tags: capital punishment, crime and punishment, definitely
Renewable energy to supply same market share in 2040 as in 1949
17 Apr 2015 Leave a comment
CHART: New EIA forecast — Fossil fuels will supply >81% of our energy for at least the next quarter century http://t.co/Oju3njQrfD—
Mark J. Perry (@Mark_J_Perry) April 15, 2015
Think renewables will be important source of future energy? Not so, fossil fuels will provide 81% of energy in 2040 http://t.co/9LOoqC3VRK—
Mark J. Perry (@Mark_J_Perry) March 15, 2015
Becoming president is part of the college premium
16 Apr 2015 Leave a comment
in economics of education, politics - USA Tags: 2016 presidential election, College premium, graduate premium
These men lacked college degrees but they ran for president & guess what happened next …
pewresearch.org/fact-tank/2015… http://t.co/L05DXnSvtz—
Conrad Hackett (@conradhackett) March 29, 2015
Who Pays Taxes in America in 2015?
16 Apr 2015 Leave a comment
in politics - USA, public economics Tags: tax incidence
/cdn0.vox-cdn.com/uploads/chorus_asset/file/3601626/ctj_taxrate.0.png)
State and local taxes are rather regressive.
/cdn0.vox-cdn.com/uploads/chorus_asset/file/3601618/ctj_taxshares.0.png)


via Think the poor don’t pay taxes? This chart proves you very wrong. – Vox and How Much Do the Top 1 Percent Pay of All Taxes?
Nobody is particularly popular at the moment in the presidential primaries
16 Apr 2015 Leave a comment

Annual hours worked, USA, West Germany, Germany and France, 1950-2013
15 Apr 2015 Leave a comment
in economic growth, Euro crisis, fiscal policy, labour economics, labour supply, macroeconomics, politics - USA Tags: annual hours worked, Eurosclerosis, taxation and the labour supply, welfare state
The French and Germans work much less than the Americans
(via: bit.ly/1b2DfWo) http://t.co/S8XwIeLNBr—
Max Roser (@MaxCRoser) April 15, 2015
Max Roser tweeted this chart today showing that French and Germans work far fewer hours than Americans. His measure is annual hours worked divided by the number of persons engaged. Max Roser’s starter shows that French and German annual hours worked in a steady decline since 1950.
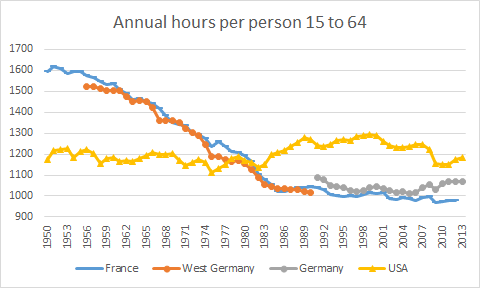
My measure below is annual hours worked per American, French, West Germany and German aged 15 to 64. My data shows a different picture. There are stable hours worked per working age American. European hours per worked per working age European fell rapidly up until 1986 or so and then stabilised. Each set of data, my data and Max Roser’s data, requires its own explanation. My explanation is the sharp rises in taxes Europe in the 1970s and 80s.
Source:OECD StatExtract and The Conference Board Total Economy Database, January 2014.
Each set of data, my data and Max Roser’s data, requires its own explanation. My explanation is the sharp rises in taxes net welfare state transfers in Europe in the 1970s and 80s.
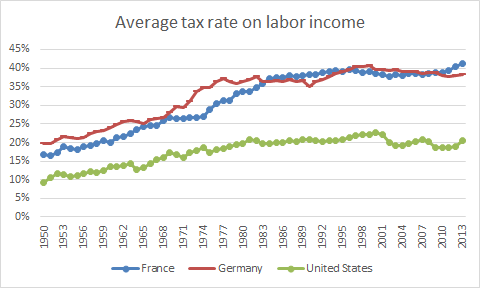
Source: caramcdaniel.com
As an illustration, average tax rates on American labour incomes doubled between 1950 in 1980 and then was stable. Labour supply started recover after this point in time as well.
Average tax rates on French and German labour income more than doubled between 1950 to about 1990 and then stopped rising by much after that. At the same time, the fall in hours worked per working age German and French stopped. The average tax rate by that time in Europe was twice that of the USA.


Recent Comments