Maggie Thatcher on the Greek crisis
17 Jul 2015 Leave a comment
in applied welfare economics, budget deficits, comparative institutional analysis, constitutional political economy, currency unions, economic growth, economic history, economics of regulation, Euro crisis, fiscal policy, income redistribution, macroeconomics, Marxist economics, Public Choice, rentseeking Tags: Greece, growth of government, Margaret Thatcher, size of government
The average worker doesn’t pay much in income taxes in New Zealand. Then who does?
17 Jul 2015 Leave a comment
in politics - Australia, politics - New Zealand, politics - USA, public economics, taxation Tags: growth of government, size of government, tax burdens, taxation and the labour supply


The growth of federal taxes in America in the 20th century
09 Jul 2015 Leave a comment
in economic history, politics - USA, public economics Tags: growth of government, size of government

A blow to Director’s Law?
03 Jul 2015 Leave a comment
in constitutional political economy, income redistribution, Public Choice, public economics, rentseeking Tags: British economy, British politics, Director's Law, expressive voting, growth of government, median voter theorem, size of government
No, most U.K. homes do not get more in benefits than they pay in tax ow.ly/3y0nEo http://t.co/LaXvGa8ro2—
Bloomberg VisualData (@BBGVisualData) July 02, 2015
…the poorest 30 percent of households receive significantly more in cash benefits than they pay in tax. The next 10 percent receive on average £596 pounds a year more in cash benefits than they pay in tax, and the top 60 percent all pay more in tax than they get back in cash benefits.
New data from the ONS show the huge growth in state dependency under New Labour. Analysis at cps.org.uk/files/factshee… http://t.co/OLjRoxt3eg—
CPS Think Tank (@CPSThinkTank) June 29, 2015
The Nordics use optimal tax theory to fund their welfare states
12 Jun 2015 Leave a comment
in applied price theory, economic history, politics - USA, Public Choice, public economics Tags: Denmark, growth of government, Norway, optimal tax theory, Scandinavia, size of government, Sweden, welfare state
Efficient taxes gather more revenue and therefore are capable of funding a larger public sector with less political resistance from groups who are net taxpayers. The so-called neoliberal reforms of the 1980s and 1990s actually saved the welfare state by putting it on a revenue raising structure that provoked less political resistance.
A switch to more efficient taxes through tax reforms allows governments to raise the same amount or larger amount of revenue for the same level of political resistance from taxpayers. This is because less revenue and output is wasted by discouraging labour supply, investment, savings and investment in capital with high marginal rates of tax on narrower tax basis. Everyone gains from converging on more efficient modes redistribution.
The Nordic countries have been on to this application of optimal tax theory to expanding the size of government and the welfare state for a long time. The Nordics have high but flat taxes on labour income, low taxes on business income and a high, broad-based consumption tax be it called a VAT or GST as illustrated by a just published Tax Foundation report.
To begin with, the USA has a smaller government because it relies more income taxes than on consumption taxes.

Governments in Europe switched towards consumption taxes such as the VAT or GST because this allowed them to raise a large amount of revenue with broad-based taxes at low rates. A VAT or GST exempts exports and business to business transactions from taxes so that reduced taxpayer resistance.
Scandinavian income taxes raise much more revenue than in the USA because they are rather flat. That is, they tax most people at these high rates, not just high-income taxpayers. The top tax rate in the Scandinavian countries cuts in at about one and a half times average income or less rather than eight times average income as in the USA.
Flat high tax "How do Scandinavian countries pay for their govt spending?" bit.ly/1KZ7jOs @JimPethokoukis http://t.co/33oRg8Ozqh—
Old Whig (@aClassicLiberal) June 11, 2015
The marginal income tax rates including this top income tax rate cuts in a low level of income is also rather high in the Nordic countries relative to the USA’s top income tax rate with the exception of Norway.

Nonetheless the Nordic countries are alert to not killing the goose that laid the golden egg. Company taxes are relatively low in Scandinavian countries as compared to the USA so that businesses do not flee to other jurisdictions.

Top marginal tax rates on dividends and capital gains are not above-average in the Nordic states but their taxes on less mobile tax bases such as from labour and consumption are much higher.

A large welfare state such as those in the Nordic countries require a significant amount of revenue, so the tax base in these countries must be broad. This also means higher taxes on consumption through the VAT or GST and higher taxes on middle-income taxpayers.
Business taxes are a less reliable source of revenue because of capital flight and disincentives to invest. Thus, the Nordics do not place above-average tax burdens on capital income and focus taxation on labour and consumption.
via Sources of Government Revenue across the OECD, 2015 | Tax Foundation and How Scandinavian Countries Pay for Their Government Spending | Tax Foundation.
Average tax rates versus tax revenue as a percentage of the GDP
31 May 2015 Leave a comment
in economic history, politics - USA, public economics, taxation Tags: average tax rates, growth of government, size of government
Tax revenue as a percentage of GDP for the European offshoots (USA, Canada, Australia and New Zealand), 1965–2013
30 May 2015 2 Comments
in economic history, politics - Australia, politics - New Zealand, politics - USA, public economics Tags: Australia, Canada, growth of government
The tax take is noticeably higher in Canada and New Zealand and has been for a long time.
Figure 1: US, Canadian, Australian and New Zealand tax revenues as a percentage of GDP, 1965–2013

Source: OECD StatExtract.
Scandinavian tax revenues as a % of GDP, 1965–2013
29 May 2015 Leave a comment
in economic history, public economics, Sam Peltzman Tags: Denmark, Finland, growth of government, Norway, Sweden
Peltzman was right! Scandinavian growth in the size of government stopped in the early 1980s.
Figure 1: Danish, Finnish, Norwegian and Swedish tax revenues as a percentage of GDP, 1965–2013

Source: OECD StatExtract.
French, German, British and US tax revenues as % of GDP, 1965 – 2013
28 May 2015 Leave a comment
in economic history, politics - USA, public economics, taxation Tags: British economy, France, Germany, growth of government
Figure 1: Tax revenue as percentage of French, German, British and US GDP, 1965–2013

Source: OECD StatExtract.
Director’s Law in action in the 1970s
26 May 2015 Leave a comment
in economic history, politics - Australia, politics - New Zealand, politics - USA Tags: Director's Law, growth of government
Long live the Slopegraph. Long live Edward Tufte. tinyurl.com/naeh7rc http://t.co/C8Lgnupxz9—
Amity Shlaes (@AmityShlaes) May 16, 2015
Is Growth of Government Inevitable? | Sam Peltzman video
12 Nov 2014 Leave a comment
in economics of regulation, income redistribution, liberalism, Public Choice, public economics, rentseeking, Sam Peltzman Tags: growth of government, Sam Peltzman

The United States’ Big Welfare State
28 May 2014 Leave a comment
in applied welfare economics, politics - USA Tags: growth of government, welfare state
The United States has long had a larger welfare state than most other Western democracies. Surprised? You may not be aware of the new research on “net social spending.”
Net social spending includes not just government expenditures on social programs, but also tax credits for social purposes and, as a debit, government taxation of social benefits. It turns out that many of the so-called “generous” European welfare states tax social benefits at a high rate. Meanwhile, the United States uses the tax code to help the poor, through the Earned Income Tax Credit. We should also include mandatory private social payments, which are not directly paid by the government.
Using the OECD data, I have plotted total net social expenditure over time for 26 rich countries (click the image to zoom in).
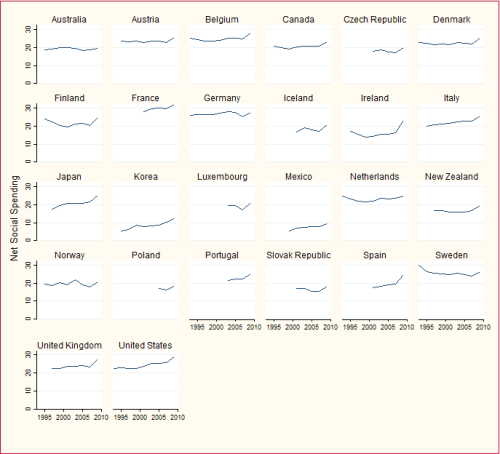
As of 2009, the United States had the second largest welfare state in the world, at 28.8%…
View original post 90 more words

Recent Comments