Relatively few work long hours in the Nordic countries!
30 Jun 2015 Leave a comment
in labour economics, labour supply Tags: Denmark, Finland, Iceland, labour demographics, Norway, Scandinavia, Sweden, taxation and the labour supply, welfare state
The Nordics use optimal tax theory to fund their welfare states
12 Jun 2015 Leave a comment
in applied price theory, economic history, politics - USA, Public Choice, public economics Tags: Denmark, growth of government, Norway, optimal tax theory, Scandinavia, size of government, Sweden, welfare state
Efficient taxes gather more revenue and therefore are capable of funding a larger public sector with less political resistance from groups who are net taxpayers. The so-called neoliberal reforms of the 1980s and 1990s actually saved the welfare state by putting it on a revenue raising structure that provoked less political resistance.
A switch to more efficient taxes through tax reforms allows governments to raise the same amount or larger amount of revenue for the same level of political resistance from taxpayers. This is because less revenue and output is wasted by discouraging labour supply, investment, savings and investment in capital with high marginal rates of tax on narrower tax basis. Everyone gains from converging on more efficient modes redistribution.
The Nordic countries have been on to this application of optimal tax theory to expanding the size of government and the welfare state for a long time. The Nordics have high but flat taxes on labour income, low taxes on business income and a high, broad-based consumption tax be it called a VAT or GST as illustrated by a just published Tax Foundation report.
To begin with, the USA has a smaller government because it relies more income taxes than on consumption taxes.

Governments in Europe switched towards consumption taxes such as the VAT or GST because this allowed them to raise a large amount of revenue with broad-based taxes at low rates. A VAT or GST exempts exports and business to business transactions from taxes so that reduced taxpayer resistance.
Scandinavian income taxes raise much more revenue than in the USA because they are rather flat. That is, they tax most people at these high rates, not just high-income taxpayers. The top tax rate in the Scandinavian countries cuts in at about one and a half times average income or less rather than eight times average income as in the USA.
Flat high tax "How do Scandinavian countries pay for their govt spending?" bit.ly/1KZ7jOs @JimPethokoukis http://t.co/33oRg8Ozqh—
Old Whig (@aClassicLiberal) June 11, 2015
The marginal income tax rates including this top income tax rate cuts in a low level of income is also rather high in the Nordic countries relative to the USA’s top income tax rate with the exception of Norway.

Nonetheless the Nordic countries are alert to not killing the goose that laid the golden egg. Company taxes are relatively low in Scandinavian countries as compared to the USA so that businesses do not flee to other jurisdictions.

Top marginal tax rates on dividends and capital gains are not above-average in the Nordic states but their taxes on less mobile tax bases such as from labour and consumption are much higher.

A large welfare state such as those in the Nordic countries require a significant amount of revenue, so the tax base in these countries must be broad. This also means higher taxes on consumption through the VAT or GST and higher taxes on middle-income taxpayers.
Business taxes are a less reliable source of revenue because of capital flight and disincentives to invest. Thus, the Nordics do not place above-average tax burdens on capital income and focus taxation on labour and consumption.
via Sources of Government Revenue across the OECD, 2015 | Tax Foundation and How Scandinavian Countries Pay for Their Government Spending | Tax Foundation.
Now what was it that the Nordics had over New Zealand in education?
05 Jun 2015 Leave a comment
in economics of education, politics - New Zealand Tags: education spending, Finland, Iceland, Nordic countries, Norway, Scandinavia, Sweden, teacher pay
Scandinavian tax revenues as a % of GDP, 1965–2013
29 May 2015 Leave a comment
in economic history, public economics, Sam Peltzman Tags: Denmark, Finland, growth of government, Norway, Sweden
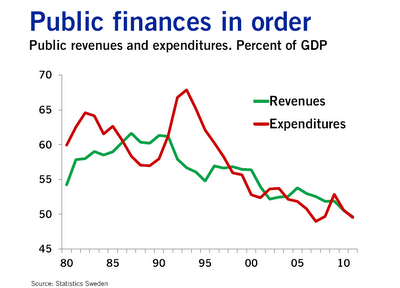
Peltzman was right! Scandinavian growth in the size of government stopped in the early 1980s.
Figure 1: Danish, Finnish, Norwegian and Swedish tax revenues as a percentage of GDP, 1965–2013

Source: OECD StatExtract.
Why is the gender gap so large and the glass ceiling so thick in Sweden?
14 May 2015 1 Comment
in discrimination, economics of love and marriage, gender, human capital, labour economics, occupational choice, politics - USA Tags: asymmetric marriage premium, do gooders, economics of families, gender wage gap, maternity leave, Sweden, The fatal conceit, unintended consequences
The gender wage gap is no better than the OECD average, despite generous maternity and paternity leave. What gives?
America: one day a year celebrating mothers, fathers.
Sweden: 480 days paid leave per child. vox.com/2014/5/12/5708… http://t.co/weFDrTj7Jb—
Ezra Klein (@ezraklein) May 11, 2015

Source: Closing the gender gap: Act now – http://dx.doi.org/10.1787/9789264179370-en
How big is the wage gap in your country? bit.ly/18o8icV #IWD2015 http://t.co/XTdntCRfDQ—
(@OECD) March 08, 2015
One important question is whether government policies are effective in reducing the gap. One such policy is family leave legislation designed to subsidize parents to stay home with new-born or newly adopted children.
One of the RLE articles shows that for high earners in Sweden there is a large difference between the wages earned by men and women (the so-called “glass ceiling”), which is present even before the first child is born. It increases after having children, even more so if parental leave taking is spread out.
These findings suggest that the availability of very long parental leave in Sweden may be responsible for the glass ceiling because of lower levels of human capital investment among women and employers’ responses by placing relatively few women in fast-track career positions. Thus, while this policy makes holding a job easier and more family-friendly, it may not be as effective as some might think in eradicating the gender gap.

via New volume on gender convergence in the labour market | IZA Newsroom.
Swedosclerosis and the British disease compared, 1950–2013
03 May 2015 2 Comments
in economic growth, economic history, entrepreneurship, macroeconomics, Public Choice, public economics Tags: British disease, British economy, Margaret Thatcher, poor man of Europe, Sweden, Swedosclerosis, taxation and the labour supply, welfare state
In 1970, Sweden was labelled as the closest thing we could get to Utopia. Both the welfare state and rapid economic growth – twice as fast as the USA for the previous 100 years.
Of course the welfare state was more of a recent invention. Assar Lindbeck has shown time and again in the Journal of Economic Literature and elsewhere that Sweden became a rich country before its highly generous welfare-state arrangements were created
Sweden moved toward a welfare state in the 1960s, when government spending was about equal to that in the United States – less that 30% of GDP.
Sweden could afford to expand its welfare state at the end of the era that Lindbeck labelled ‘the period of decentralization and small government’. Swedes in the 60s had the third-highest OECD per capita income, almost equal to the USA in the late 1960s, but higher levels of income inequality than the USA.
By the late 1980s, Swedish government spending had grown from 30% of gross domestic product to more than 60% of GDP. Swedish marginal income tax rates hit 65-75% for most full-time employees as compared to about 40% in 1960. What happened to the the Swedish economic miracle when the welfare state arrived?
In the 1950s, Britain was also growing quickly, so much so that the Prime Minister of the time campaigned on the slogan you never had it so good.

By the 1970s, and two spells of labour governments, Britain was the sick man of Europe culminating with the Winter of Discontent of 1978–1979. What happened?

Sweden and Britain in the mid-20th century are classic examples of Director’s Law of Public Expenditure. Once a country becomes rich because of capitalism, politicians look for ways to redistribute more of this new found wealth. What actually happened to the Swedish and British growth performance since 1950 relative to the USA as the welfare state grew?
Figure 1: Real GDP per Swede, British and American aged 15-64, converted to 2013 price level with updated 2005 EKS purchasing power parities, 1950-2013, $US

Source: Computed from OECD Stat Extract and The Conference Board, Total Database, January 2014, http://www.conference-board.org/economics
Figure 1 is not all that informative other than to show that there is a period of time in which Sweden was catching up with the USA quite rapidly in the 1960s. That then stopped in the 1970s to the late 1980s. The rise of the Swedish welfare state managed to turn Sweden into the country that was catching up to be as rich as the USA to a country that was becoming as poor as Britain.
Figure 2: Real GDP per Swede, British and American aged 15-64, converted to 2013 price level with updated 2005 EKS purchasing power parities, detrended, 1.9%, 1950-2013

Source: Computed from OECD Stat Extract and The Conference Board, Total Database, January 2014, http://www.conference-board.org/economics
Figure 2 which detrends British and Swedish growth since 1950 by 1.9% is much more informative. The US is included as the measure of the global technological frontier growing at trend rate of 1.9% in the 20th century. A flat line indicates growth at 1.9% for that year. A rising line in figure 2 means above-trend growth; a falling line means below trend growth for that year. Figure 2 shows the USA growing more or less steadily for the entire post-war period. There were occasional ups and downs with no enduring departures from trend growth 1.9% until the onset of Obamanomics.
Figure 2 illustrates the volatility of Swedish post-war growth. There was rapid growth up until 1970 as the Swedes converged on the living standards of Americans. This growth dividend was then completely dissipated.
Swedosclerosis set in with a cumulative 20% drop against trend growth. The Swedish economy was in something of a depression between 1970 and 1990. Swedish economists named the subsequent economic stagnation Swedosclerosis:
- Economic growth slowed to a crawl in the 1970s and 1980s.
- Sweden dropped from near the top spot in the OECD rankings to 18th by 1998 – a drop from 120% to 90% of the OECD average inside three decades.
- 65% of the electorate receive (nearly) all their income from the public sector—either as employees of government agencies (excluding government corporations and public utilities) or by living off transfer payments.
- No net private sector job creation since the 1950s, by some estimates!
Prescott’s definition of a depression is when the economy is significantly below trend, the economy is in a depression. A great depression is a depression that is deep, rapid and enduring:
- There is at least one year in which output per working age person is at least 20 percent below trend; and
- there is at least one year in the first decade of the great depression in which output per working age person is at least 15 percent below trend; and
-
There is no significant recovery during the period in the sense that there is no subperiod of a decade or longer in which the growth of output per working age person returns to rates of 2 percent or better.
The Swedish economy was not in a great depression between 1970 and 1990 but it meets some of the criteria for a depression but for the period of trend growth between1980 and 1986.
Between 1970 and 1980, output per working age Swede fell to 10% below trend. This happened again in the late 80s to the mid-90s to take Sweden 20% below trend over a period of 25 years.
Some of this lost ground was recovered after 1990 after tax and other reforms were implemented by a right-wing government. The Swedish economic reforms from after 1990 economic crisis and depression are an example of a political system converging onto more efficient modes of income redistribution as the deadweight losses of taxes on working and investing and subsidies for not working both grew.
The Swedish economy since 1950 experienced three quite distinct phases with clear structural breaks because of productivity shocks. There was rapid growth up until 1970; 20 years of decline – Swedosclerosis; then a rebound again under more liberal economic policies.
The sick man of Europe actually did better than Sweden over the decades since 1970. The British disease resulted in a 10% drop in output relative to trend in the 1970s, which counts as a depression.

There was then a strong recovery through the early-1980s with above trend growth from the early 1980s until 2006 with one recession in between in 1990. So much for the curse of Thatchernomics?
After falling behind for most of the post-war period, the UK had a better performance compared with other leading countries after the 1970s.
This continues to be true even when we include the Great Recession years post-2008. Part of this improvement was in the jobs market (that is, more people in work as a proportion of the working-age population), but another important aspect was improvements in productivity…
Contrary to what many commentators have been writing, UK performance since 1979 is still impressive even taking the crisis into consideration. Indeed, the increase in unemployment has been far more modest than we would have expected. The supply-side reforms were not an illusion.
John van Reenen goes on to explain what these supply-side reforms were:
These include increases in product-market competition through the withdrawal of industrial subsidies, a movement to effective competition in many privatised sectors with independent regulators, a strengthening of competition policy and our membership of the EU’s internal market.
There were also increases in labour-market flexibility through improving job search for those on benefits, reducing replacement rates, increasing in-work benefits and restricting union power.
And there was a sustained expansion of the higher-education system: the share of working-age adults with a university degree rose from 5% in 1980 to 14% in 1996 and 31% in 2011, a faster increase than in France, Germany or the US. The combination of these policies helped the UK to bridge the GDP-per-capita gap with other leading nations.
Swedish cops on vacation break up NY subway fight
26 Apr 2015 Leave a comment
in economics of crime, law and economics Tags: crime and punishment, law enforcement, New York City, police, Sweden
“We’re no heroes, just tourists.” nyp.st/1PnVhkt http://t.co/EIGtwlajzQ—
New York Post (@nypost) April 23, 2015
via Swedish cops on vacation break up subway fight | New York Post.
Why did this underground tunnel end offshore?
10 Apr 2015 Leave a comment
in transport economics Tags: Denmark, Sweden, tunnels
Underwater bridge – This is the border between Denmark and Sweden http://t.co/gW4GbKWHaR—
Mind Blowing (@TheMindBlowing) February 23, 2015

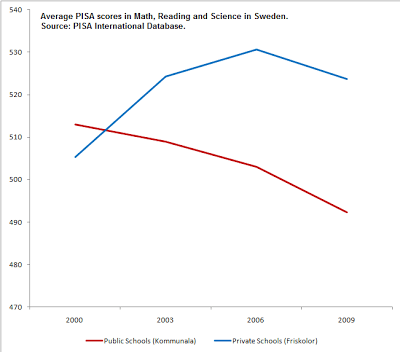
On the Swedish school voucher system
15 Jan 2015 Leave a comment
in economics of education Tags: charter schools, School choice, school vouchers, Sweden
Sweden has offered permanent residence to all Syrians fleeing the conflict
06 Dec 2014 1 Comment
in Economics of international refugee law, war and peace Tags: refugees, Sweden, Syria

Asylum applications to Sweden
2012: 44,000
2013: 55,000
2014: 83,000 (projected)
2015: 95,000 (projected)
The population of Sweden is about twice that New Zealand and a million more. The population of Syria is almost 23,000,000.

Nearly half of Syria’s population has been displaced since the start of the civil war in 2011. Half. It’s the equivalent of 135 million Americans being forced to move.
I admire Sweden’s generosity, but not their wisdom. Three million Syrians have become refugees abroad and 6.5 million more have fled their homes for other locations within the country.
Sweden’s March Towards Capitalism – Reason.com
28 Jul 2014 1 Comment
in applied price theory Tags: deregulation, privatisation, Sweden, tax cuts
Sweden is not a socialist success story but instead owes its economic growth to the lowered tax rates and deregulation of the early 1990s, which allowed innovation and investment to flourish.
Bergh also discusses how Sweden’s national voucher program revitalized the country’s educational system
The rise of the Swedish welfare state, Swedosclerosis and Director’s Law
08 Apr 2014 3 Comments
in applied welfare economics, economic growth, macroeconomics, Public Choice Tags: labour supply, Sweden, taxes, welfare state
Sweden is a common example of a generous welfare state that is compatible with a prosperous society. One interpretation of the UN Development Index is you improve your national ranking by becoming more like Sweden.
Assar Lindbeck has shown time and again in the Journal of Economic Literature and elsewhere that Sweden became a rich country before its highly generous welfare-state arrangements were created
Sweden moved toward a welfare state in the 1960s, when government spending was about equal to that in the United States – less that 30% of GDP.
Sweden could afford this at the end of the era that Lindbeck labelled ‘the period of decentralization and small government’. Sweden was one of the fastest growing countries in the world between 1870 and 1960.
Swedes had the third-highest OECD per capita income, almost equal to the USA in the late 1960s, but higher levels of income inequality than the USA.
By the late 1980s, Swedish government spending had grown from 30% of gross domestic product to more than 60% of GDP. Swedish marginal income tax rates hit 65-75% for most full-time employees as compared to about 40% in 1960.
Swedish economists named the subsequent economic stagnation Swedosclerosis:
- Economic growth slowed to a crawl in the 1970s and 1980s.
- Sweden dropped from near the top spot in the OECD rankings to 18th by 1998 – a drop from 120% to 90% of the OECD average inside three decades.
- 65% of the electorate receive (nearly) all their income from the public sector—either as employees of government agencies (excluding government corporations and public utilities) or by living off transfer payments.
- No net private sector job creation since the 1950s, by some estimates!
In 1997, Lindbeck suggested that the Swedish Experiment was unravelling.

Sweden is a classic example of Director’s Law of Public Expenditure. Once a country becomes rich because of capitalism, politicians look for ways to redistribute more of this new found wealth.
Studies starting from Sam Peltzman (1980) showed that government grew in line with the growth in the size and homogeneity of the middle class that became organised and politically articulate enough to implement a version of Director’s law. Director’s law augmented by Gary Becker’s 1983 model of competition among pressure groups for political influence explain much of modern public policy.
Government spending grew in many countries in the mid-20th century because of demographic shifts, more efficient taxes, more efficient spending, shifts in the political power from those taxed to those subsidised, shifts in political power among taxed groups, and shifts in political power among subsidised groups.
The Swedish economic reforms from after 1990 economic crisis and depression are an example of a political system converging onto more efficient modes of income redistribution as the deadweight losses of taxes on working and investing and subsidies for not working both grew. Improvements in the efficiency of taxes or spending reduce political pressure to suppress the growth of the welfare state and thus increase or prevent cuts to both total tax revenue and spending.
After the rise of Swedosclerosis, the taxed, regulated and subsidised groups had an increased incentive to converge on new lower cost modes of redistribution. More efficient taxes, more efficient spending, more efficient regulation and a more efficient state sector reduced the burden of taxes on the taxed groups. Most subsidised groups benefited as well because their needs were met in ways that provoked less political opposition.
Reforms ensued led by parties on the Left and Right, with some members of existing political groupings benefiting from joining new political coalitions.
The Nordic median voter was alive to the power of incentives and to not killing the goose that laid the golden egg. The deadweight losses of taxes, transfers and regulation limit inefficient policies and the sustainability of redistribution.
For example, while tax rates are high in Sweden and the rest of Scandinavia, hours worked in Scandinavia are significantly higher than in Continental Europe.
Richard Rogerson found in Taxation and market work: is Scandinavia an outlier? that how the government spends tax revenues imply different rates of labour supply with regard to tax rate increases.
Rogerson considered that differences in the composition of government spending can potentially account for the high rate of labour supply in Sweden and elsewhere in Scandinavia. Specifically, examining the conditions on which how tax revenue is returned to Swedes as income transfers or other conditional payments is central to understanding the labour supply effects of taxes:
- If higher taxes fund disability payments which may only be received when not in work, the effect on hours worked is greater relative to a lump-sum transfer with no conditions; and
- If higher taxes subsidise day care for individuals who work, then the effect on hours of work will be less than under the lump-sum transfer with no conditions.
A much higher rate of government employment and greater expenditures on child and elderly care explain the high rates of Swedish labour supply.
Swedes are taxed heavily, but key parts of this tax revenue are then given back to them conditionally if they keep working. Policies that significantly cut the total wealth available for redistribution by Swedish governments were avoided relative to the germane counter-factual, which are other even costlier modes of income redistribution.

Recent Comments