
Was Occupy Wall Street based on a measurement error?
26 Mar 2016 Leave a comment
in applied welfare economics, economic history, entrepreneurship, human capital, labour economics, poverty and inequality Tags: entrepreneurial alertness, superstar wages, superstars, top 0.1%, top 1%
Piketty and Saez (2003, updated) estimated the share of income held by the top 1% from 13 percent in 1991 to 23 percent in 2012. The new Bricker et al. research shows only a 7 percentage point increase to 18 percent in 2012. The share held by the super-rich, the top 0.1% has increased much at all.
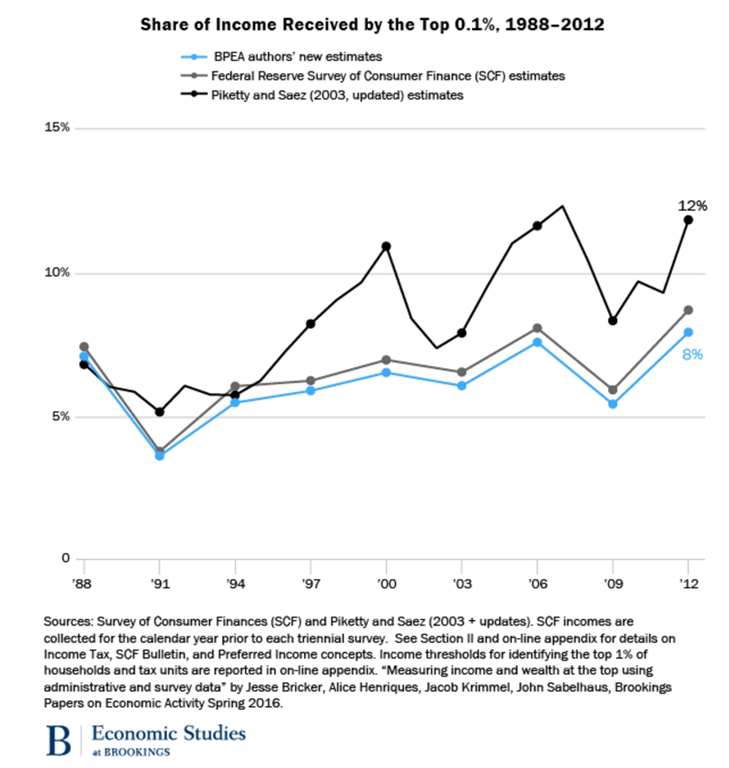
Source: Measuring income and wealth at the top using administrative and survey data via How super-rich Americans get that way is changing – AEI | Pethokoukis Blog » AEIdeas.

Source: Measuring income and wealth at the top using administrative and survey data via How super-rich Americans get that way is changing – AEI | Pethokoukis Blog » AEIdeas.
@James_ARobins yet another @MaxRashbrooke #inequality fact check
17 Mar 2016 Leave a comment
in applied welfare economics, economic growth, economic history, labour economics, poverty and inequality, unemployment Tags: antimarket bias, pessimism bias, rational irrationality, The Great Enrichment, top 1%

Source: Do inequality and poverty matter? | Pundit – Brian Easton (2016) .
I will outsource to Brian Easton, the CTU, the CTU’s Bill Rosenberg and Closer Together Whakatata Mai – reducing inequalities because the continual correction of Max Rashbrooke on poverty and inequality is becoming tiring.
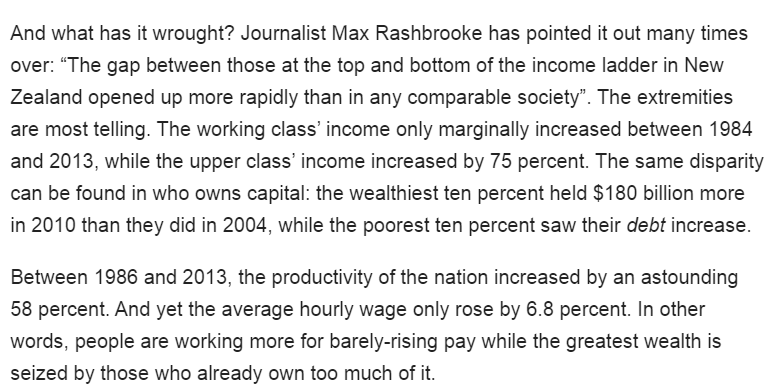
Source: Love in the time of crisis, James Robins, Wednesday, 16 March 2016, Newstalk NZ.
A brief history of inequality-from Treasury paper Fig4. Note Employment Contracts Act,GST,income tax,benefit cuts,WFF http://t.co/y4w3cUsgjD—
Bill Rosenberg (@WJRosenbergCTU) June 27, 2015
Inequality has not risen for at least 20 years as Bill Rosenberg tweeted. The rise in inequality in the late 1980s and early 1990s was followed by an employment boom that lasted to 2009.
Unemployment was as low as 3 1/2% for several years despite a large increase in labour force participation. Furthermore, the gender wage gap in New Zealand fell rapidly to now be the smallest in any industrialised country.
As the Facebook photos show, there has been strong income and wage growth despite the grizzling of the left. The return of income growth and wages growth after 20 years of real wage stagnation followed the economic reforms of the 1980s and the passage of the Employment Contracts Act in 1991.
As the CTU shows below, the economic reforms in the 1980s put an end to a sharp decline in the relative economic performance of the New Zealand economy.
New Zealand physical and human capital (by a skill level), 1986 – 2001
17 Mar 2016 Leave a comment
in applied welfare economics, economic history, economics of education, entrepreneurship, human capital, labour economics, politics - New Zealand, poverty and inequality Tags: pension fund socialism, top 1%, Withering away of the proletariat
New Zealand working class is wealthier than the entire capitalist class. Their human capital, shown in the chart below as the human capital of the unskilled and non-degree workers, far exceeds the value of the physical capital stock of New Zealand.
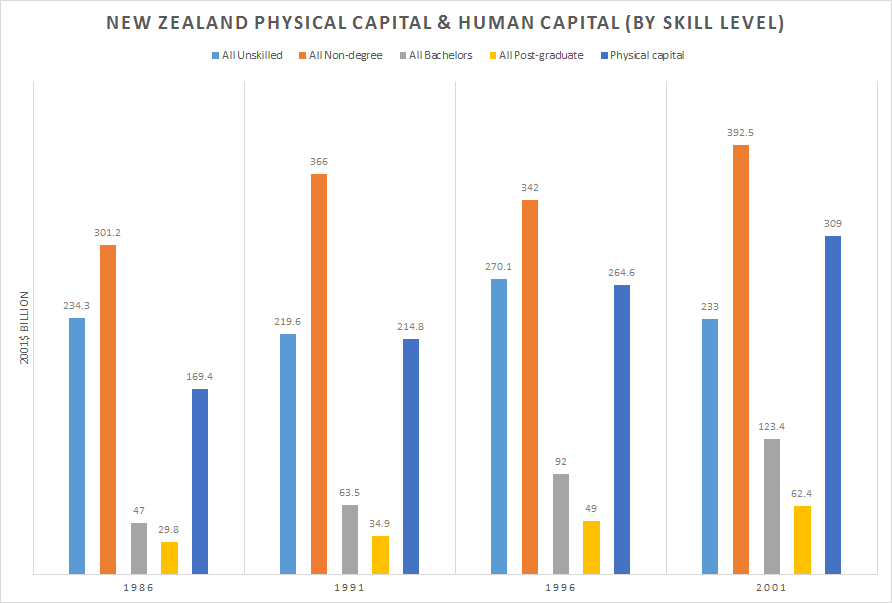
Source: Lˆe Thi. Vˆan Tr`ınh, Estimating the monetary value of the stock of human capital for New Zealand, University of Canterbury PhD thesis (September 2006).
Only part of this physical capital stock is owned by the capitalist class given we live in the era of pension fund socialism. About a 3rd of that physical capital stock is owner occupied homes.
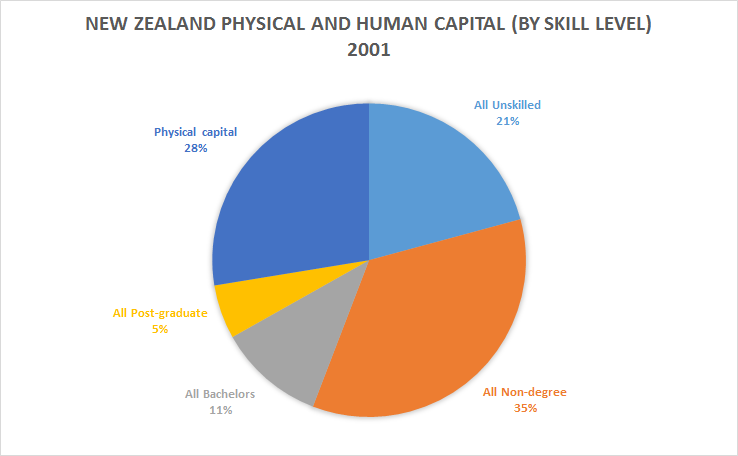
Source: Lˆe Thi. Vˆan Tr`ınh, Estimating the monetary value of the stock of human capital for New Zealand, University of Canterbury PhD thesis (September 2006).
The only reason that the share of unskilled and non-degree workers is in any way declining is the withering away of the proletariat. More and more people are joining the middle-class and going on to higher education.
Andrew Little is looking to update Labour's definition of the 'working class': stuff.co.nz/national/polit… http://t.co/AQ9mJL7CQf—
NZ Stuff Politics (@NZStuffPolitics) November 30, 2014
.
The value of New Zealand owner occupied homes, net capital stock and human capital stock since 1987
17 Mar 2016 Leave a comment
in applied welfare economics, economic history, economics of education, entrepreneurship, human capital, labour economics, politics - New Zealand, poverty and inequality, urban economics Tags: household wealth, housing prices, pessimism bias, top 1%
Tring Le found that the human capital stock was consistently 2.6 times the value of the physical capital stock of New Zealand.
I decided to apply that ratio to the net capital stock of New Zealand estimates of Statistics New Zealand back to 1987 to see what we get. It is pretty standard for the value of human capital to be two to two and one-half times the value of physical capital.

Source: National Accounts (Industry Benchmarks): Year ended March 2013 and Lˆe Thi. Vˆan Tr`ınh, Estimating the monetary value of the stock of human capital for New Zealand, University of Canterbury PhD thesis (September 2006), Table 4.8: Human and physical capital stocks.
All the above chart says it is most wealth in New Zealand is held by ordinary people either as their human capital or the value of their homes.
Tax burdens of the top 10% across the OECD
14 Mar 2016 Leave a comment
in politics - New Zealand, politics - USA, public economics Tags: taxation and entrepreneurship, taxation and investment, taxation and labour supply, top 1%
The role of inheritance in top incomes
25 Feb 2016 Leave a comment
in applied welfare economics, economic history, entrepreneurship, human capital, labour economics, poverty and inequality Tags: entrepreneurial alertness, superstars, top 1%
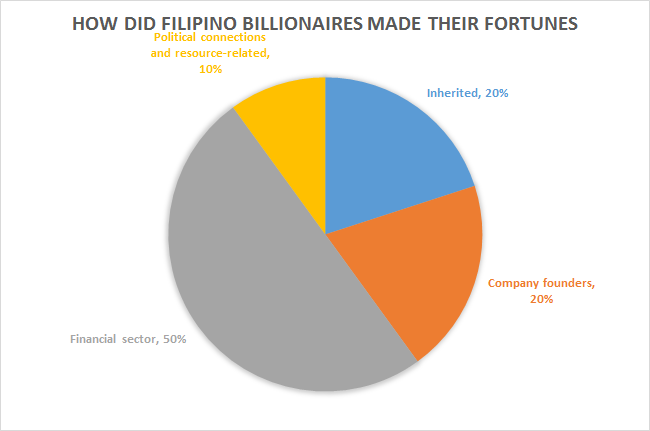
How did Pinoy billionaires make their money?
18 Feb 2016 1 Comment
in applied welfare economics, economic history, entrepreneurship, financial economics, industrial organisation Tags: billionaires, entrepreneurial alertness, Philippines, superstars, top 1%
A surprisingly large number of Filipino billionaires are in the financial sector.
How did India’s billionaires make their fortunes
17 Feb 2016 Leave a comment
in applied welfare economics, development economics, economic history, economics of regulation, entrepreneurship, growth disasters, growth miracles, industrial organisation Tags: billionaires, entrepreneurial alertness, India, superstars, top 1%
A decent number of India’s billionaires founded a company.

How did British billionaires make their money
16 Feb 2016 Leave a comment
in applied welfare economics, economic history, economics of regulation, entrepreneurship, financial economics, human capital, industrial organisation, labour economics, poverty and inequality, survivor principle Tags: billionaires, British economy, entrepreneurial alertness, superstars, top 1%

Inheriting wealth is not what it used to be in Britain. There are all these upstarts running businesses or working in the City.

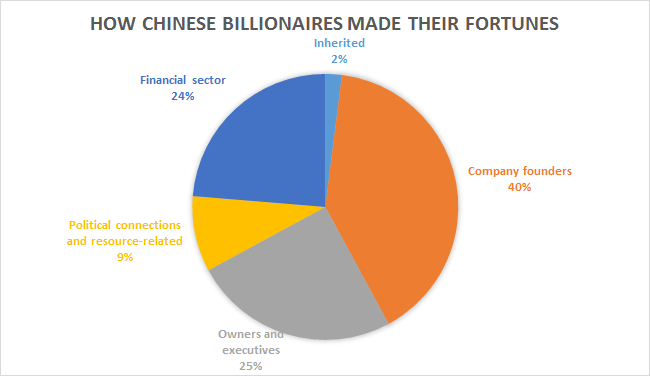
How did the Chinese billionaires make their money?
15 Feb 2016 Leave a comment
in applied price theory, development economics, economic history, entrepreneurship, growth miracles, human capital, industrial organisation, labour economics Tags: billionaires, China, entrepreneurial alertness, superstars, top 1%
@jacindaardern @ChrisHipkins why abolishing tuition fees entrenches inequality
14 Feb 2016 Leave a comment
in applied price theory, applied welfare economics, human capital, politics - New Zealand, poverty and inequality Tags: distributive justice, expressive politics, free tuition, rational irrationality, social justice, top 1%

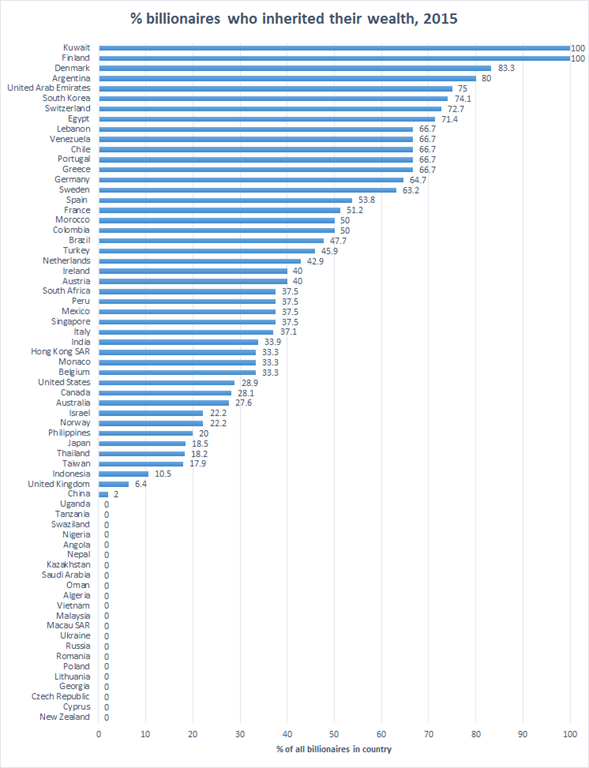
Percentage of billionaires who inherited their wealth
14 Feb 2016 Leave a comment
in applied welfare economics, entrepreneurship, labour economics, poverty and inequality Tags: entrepreneurial alertness, inherited wealth, superstar wages, superstars, top 1%
China has been capitalist for long enough for a billionaire to actually inherit his wealth.


Recent Comments