What do the top income earners in Australia earn on average?

Source: topincomes-parisschoolofeconomics

As with New Zealand, plenty of people in the top income brackets in Australia would regard themselves as middle class – entrepreneurs and professionals who made their way up from the bottom.

As with New Zealand, there is a major spike in top earnings around the time of the 1985 tax reform when the top tax rate was cut from 66% to 49% in Australia.

Source: topincomes-parisschoolofeconomics

As for trans-Tasman comparisons, the top 10% and top 5% in Australia do earn more than their compatriots in New Zealand.

The top 1% in Australia are much better performers than the top 1% in New Zealand, but then again wages and incomes are about a third higher in Australia as compared to New Zealand.

The Australian 0.5% are clearly superior to their New Zealand rivals, earning at least 50% more than them on average.

The New Zealand chart is in New Zealand dollars in 2011; the Australian chart is in Australian dollars in 2010.

A reason for the higher earnings of the Australian top 1% is the larger economy offers a greater superstar effect.

Globalisation and technological changes would allow the Australian best performers, including the top managers and top chief executives, in a given field to serve a bigger market and thus reap a greater share of its revenue. But this would also reduce the spoils available to the less gifted in the business. Australia, as the seven times larger economy, allows their best performers to serve bigger domestic markets.


How much do the top income earners actually earn in NZ?

Source: topincomes-parisschoolofeconomics

Note: top income share data for adults for New Zealand adults go back only as far as 1953.

To begin with, a large number of people who see themselves as middle class will have to reclassify themselves in terms of class membership.

More importantly, they will have to pick up on their class consciousness because they are either in the top 10% as any successful professional is because the average income of the top 10% in New Zealand is $128,000. With a bit of luck, these members of the ruling class will be able to afford a house in Auckland without having to borrow from mum and dad.

Pretty much every successful professional is in the top 5% in New Zealand, with an average income of $170,000.

These rich have a lot of people look down upon and order about as junior or senior members of the ruling class, even if they did know they were a member of the ruling class until they looked at the diagram above. Welcome to the ruling class. Goodbye to the middle-class. Get over it.

As for the top 1% in New Zealand, they have an average income in 2011 of $336,000. Once again, successful professionals, successful entrepreneurs and what’s left of the rentier class will have to accept that supreme power as the ruling class of the capitalist system is open to just about anybody who does well at university and enters the professions. Are there no standards?

As for the top 0.5%, data on the top 0.1% stopped in 1989, they earned an average of $457,000 a year in 2011. That is starting to look like good money, though you do have to brush shoulders with celebrities, athletes and more than a few successful small entrepreneurs, but at least you are starting to earn a lot more than your average suburban doctor who is a member of the top 10%.

The ruling class is not what it used to be – the rentier class, old money. That the rich of today – the ruling class of the capitalist system – is open to many ordinary people who are new rich or just plain urban professionals, athletes, musicians and celebrities is a common finding all round the world. As Piketty and Saez explained for the USA:

This rise in top income shares is not due to the revival of top capital incomes, but rather to the very large increases in top wages (especially top executive compensation).

As a consequence, top executives (the “working rich”) have replaced top capital owners at the top of the income hierarchy over the course of the twentieth century.

Many of the rich both in New Zealand and overseas are working rich who made their money themselves and came from middle class or upper middle-class backgrounds.

Many of these rich are well educated smart people rather than the inheritors of wealth. The working rich and most of the rich of the 21st century must be well educated because so many of them are professionals in occupations where you must succeed at university to get in the ground floor, or they are athletes, musicians and other celebrities who must work their way up from the bottom.

A large number of New Zealanders who regarded themselves as middle class action are part of the rich – the top 10%, top 5% and banging on the doors of the top 1% or better – so they better start carrying themselves about with the airs and graces of the ruling class. Better practice by putting a plum in your mouth.

p.s. There was a big spike in top incomes in 1999. It seems like a lot of people in New Zealand brought forward income in 1998 and 1999 in anticipation of the election of a Labour Party government in the 1999 New Zealand general election, and an immediate increase in the top tax rate from 33% to 39% for incomes over $60,000.


The top 10% are a bunch of bludgers in New Zealand too

Source: topincomes-parisschoolofeconomics

One reason why the top 10% in New Zealand have been a pretty ordinary lot compared to the USA is New Zealand’s university graduate premium – the college premium as it is known in the USA – is at the very bottom of the OECD ladder at about 18% – rock bottom 32nd out of 32 – the wooden spoon.

The College premium in the USA is about 64%, as shown in the OECD data below from OECD Education at Glance. Naturally, this high College premium in the USA should show up in well educated, highly skilled people earning a lot more than those that don’t go to college and don’t go to graduate school.

Stats link: http://dx.doi.org/10.1787/888932460515

Little wonder that the USA top 10% are breaking away from the pack. This slow increase in the income share of the top 10% since the early 1970s coincided with large numbers, including many more women in long duration professional degrees, going to university.

Prior to the mid-1970s, the College premium in the USA had been falling for about a decade because of large numbers of people going on to College and many of these two graduate school to get a draft deferment.

People married younger then so by the time people were at the end of College or graduate school, they were usually married with children and got of further draft deferment and aged out of the draft system.

The top 1% in New Zealand have been bone lazy for at least 60 years now

Source: topincomes-parisschoolofeconomics

Note: top 1% income share data for adults for New Zealand adults go back only as far as 1953.

The top 1% in New Zealand have had a good 60 years to immiserate the proletariat and what are they done? Nothing!

The top 1% share of national income is much the same as it was in 1953! The Australian top 1% haven’t done much better. Bludgers, the lot of them.

What do the Occupy movement have to protest about in New Zealand if the rich haven’t been getting richer?

Does inequality lead to a financial crisis? | VOX, CEPR’s Policy Portal

Figure 1. Change in loans versus changes in top 1% income shares, 14 countries, 1972–2008

via Does inequality lead to a financial crisis? | VOX, CEPR’s Policy Portal.

How New Zealand’s rich-poor divide killed its egalitarian paradise | Max Rashbrooke | The Guardian – a boy’s own fact check

What is claimed to have gone wrong by the op-ed in The Guardian overnight?

A stark rich-poor divide, the OECD argued, had taken over a third off the country’s economic growth rate in the last 20 years. But how could this be?

The simple answer is that in the two decades from 1985 onwards, New Zealand had the biggest increase in income gaps of any developed country.

Incomes for the richest Kiwis doubled, while those of the poorest stagnated. Middle income earners didn’t do too well, either.

Are these claims true? That is, in the two decades from 1985 onwards, have the incomes of the richest Kiwis doubled, while those of the poorest stagnated and have a middle income earners not done too well either?

Figure 1 shows that prior to the recent recession starting in 2009, there were 15 years of steady growth in median household incomes. As will be shown, most of the period covered both by the op-ed in the Guardian, and by the OECD paper was an economic boom.

Figure 1: Real household income trends before housing costs (BHC) and after housing costs (AHC), 1982 to 2013 ($2013)

clip_image002

Source: Bryan Perry, Household incomes in New Zealand: Trends in indicators of inequality and hardship 1982 to 2013. Ministry of Social Development (July 2014).

Perry (2104) found that net income gains from the mid-1990s to 2013 were similar for all income groups, so income inequality in 2013 was also similar to the mid-1990s – see Figure 2.

Figure 2: Real household incomes (BHC), changes for top of income deciles, 1994 to 2013

clip_image002[7]

Source: (Perry 2014).

Importantly,  in the OECD analysis, much was made of what was happening  to the 40% income decile. As can be seen from figure 2, this decile gained as much as any other group in New Zealand from the income growth  between  1994 and 2013.

The Gini coefficient in figure 3 , which years the most common measure of inequality, shows no evidence of a rise in income inequality since the mid-1990s. The trend-line of the genie coefficient in figure 3 is almost flat since the early 1990s .

Figure 3: Gini coefficient New Zealand 1980-2015

clip_image004

Source: (Perry 2014).

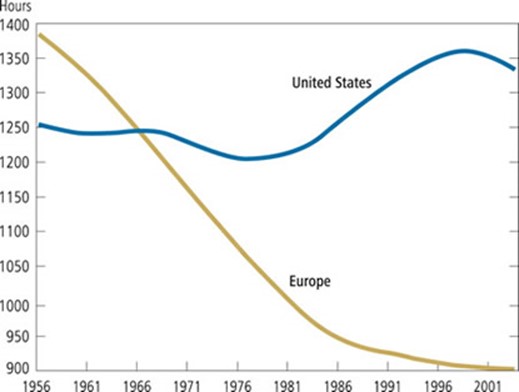
To make things more awkward,  the large increase in income inequality in New Zealand in the late 1980s and early 1990s shown in figure 3 was followed by a 15 year economic boom after 20 years of economic stagnation  – next to no income growth  – as is shown in figure 4.

Figure 4: Real GDP per New Zealander and Australian aged 15-64, converted to 2013 price level with updated 2005 EKS purchasing power parities, 1956-2013

Source: Computed from OECD Stat Extract and The Conference Board, Total Database, January 2014, http://www.conference-board.org/economics

The lost decades of the growth in the 1970s and 1980s were  replaced with a long boom. Trend growth of 2% per year returned after this increase in inequality – see figure 4.

The gains since the economic boom since the early 1990s has been broadly based both up and down the income distribution  and by ethnicity. As shown in figure 5, between 1994 and 2010, real equivalised median household income rose 47% from 1994 to 2010; for Māori, this rise was 68%; for Pasifika, the rise was 77%.

Figure 5: Real equivalised median household income (before housing costs) by ethnicity, 1988 to 2013 ($2013).

clip_image002[9]

Source: (Perry 2014).

These improvements in Māori incomes since 1992 were based on rising Māori employment rates, fewer Māori on benefits, more Māori moving into higher paying jobs, and greater Māori educational attainment should be celebrated and consolidated. Māori unemployment reached a 20-year low of 8 per cent from 2005 to 2008.

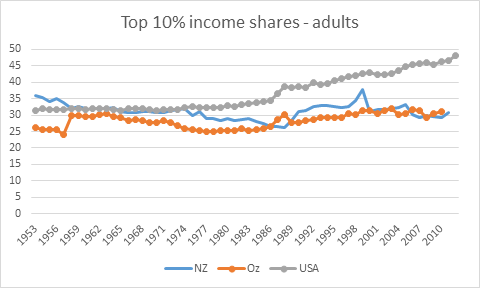
As for the top 1%,  as shown by Figure 6, their income share has been steady at 8-9% since the mid-1990s. It was only in the USA the top 1% share continued to rise strongly, from 13% to 19%.

Figure 6:  income shares of the top 1% of earners,  New Zealand, Australia and USA

image

source: Top incomes database

Over the last more than two decades in New Zealand, there has been sustained income growth spread across all of society. Perry (2014) concluded that:

Overall, there is no evidence of any sustained rise or fall in inequality in the last two decades.

The level of household disposable income inequality in New Zealand is a little above the OECD median.

The share of total income received by the top 1% of individuals is at the low end of the OECD rankings.

What is claimed as the causes of this growing rich-poor divide that is also slowing growth by a third?

Tracing the causes of a growing income gap is like trying to map earthquake fault lines – never a precise science – but it is hard to ignore the correlation between the timing of the increase and the country’s post-1984 political revolution.

Embracing reforms known elsewhere as Thatchernomics and Reaganomics with unprecedented enthusiasm, New Zealand halved its top tax rate, cut benefits by up to a quarter of their value, and dramatically reduced the bargaining power – and therefore the share of national income – of ordinary workers.

Thousands of people lost their jobs as manufacturing work went overseas, and there was no significant response with increased trade training or skills programmes, a policy failure that is on-going.

At the same time, New Zealand stopped building affordable houses in any serious quantity, forcing poorer households to spend ever-increasing amounts on rent and mortgages.

As will be recalled from Figure 4, the economic reforms in New Zealand were followed by a long economic  boom starting in 1992 that only came to an end with the onset of the global financial crisis.

Figure 7  shows that from 1994, the proportion of the lowest income households spending more than 30% of their income on housing fell steadily, reaching 34% by 204.

Figure 7: Proportion of households spending more than 30% of their income on housing costs by income quintile, New Zealand 1988–2013 HES years

Source: Perry (2014)

Housing affordability was improving for much of the period in which the op-ed in the Guardian was claiming it was getting worse. The increase in housing unaffordability in the late 1980s and early 1990s coincided with a deep recession and a cut in welfare benefits.

Housing affordability has become an issue in New Zealand because of rising prices. Supply is not keeping up with demand.

There were considerable increases in prices throughout the house price distribution between 2004 and 2008. Median house price increasing by over 50% between 2004 and 2008; the price rises were largest among the lower price houses.

It was not a case of a decline in demand under the hypothesis that is put forward in the op-ed in the Guardian. For that hypothesis to hold, housing prices would somehow have to fall in the price range of ordinary workers. That is not the case.

Furthermore,  the large increase in housing prices and decline in housing affordability  occurred a decade and more after the increase in inequality in the late 1980s and early 1990s. The timing is out.

Another inconvenience for the rich poor divide hypothesis is during the housing  price boom after 2004 rent to disposable income for all income quintiles remained relatively constant. Rents were stable.

Poorer households are more likely to rent, and therefore much less likely to be affected by the housing affordability crisis in New Zealand as that was mostly about home ownership.

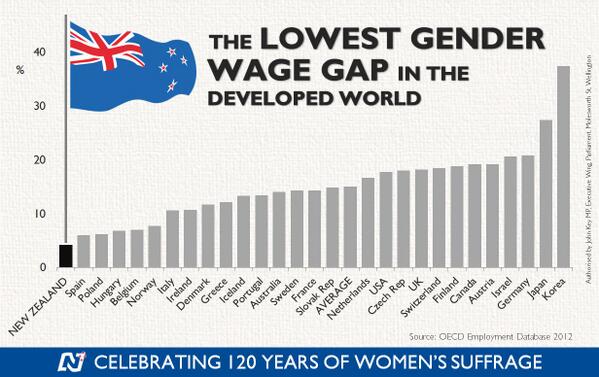
Gender analysis! Gender analysis? Where is the gender analysis? Over the last 20 to 30 years, the gender gap has closed substantially in terms of wages and employment. Young women now outnumber young men two to one at university.

New Zealand has the smallest gender wage gap in the Western world. That is inconsistent with the notion in New Zealand has a rich poor divide. Instead New Zealand appears to be an egalitarian paradise as long as you are not a boy!

The major driver of inequality in New Zealand and overseas is the rising number of two-income households made up of two well-educated parents and one or two children and many more single parent households on low pay or no one in paid employment in the house. Well-educated couples form into high income households;  fewer of the less educated marry and too many end up a single mothers.

clip_image002

Source: closertogether.org.nz

The main cause of poverty in New Zealand is dependency on welfare benefits and in particular the number of single parents. Child poverty in beneficiary families is 75% to 80%, much higher than in families with at least one adult in full-time employment (11% in 2012 and 2013). The payment of welfare benefits to families who do not work guarantees an income to people not in a job, but it creates incentives not to work.

image

The economic and sociological literatures overseas increasingly suggesting that skill disparities resulting from a lower quality education and less access to good parenting, peer and neighbourhood environments produce most of the income gaps of racial and ethnic minorities rather than factors such as labour market discrimination.

via How New Zealand’s rich-poor divide killed its egalitarian paradise | Max Rashbrooke | Comment is free | The Guardian.

Trends in Income Inequality and its Impact on Economic Growth – OECD working paper (9 December 2014) – updated

Figure 1: Estimated consequences of changes in inequality (1985 – 2005) on subsequent cumulative growth (1990-2010)

image

Drawing on harmonised data covering the OECD countries over the past 30 years, the econometric analysis suggests that income inequality has a negative and statistically significant impact on subsequent growth.

In particular, what matters most is the gap between low income households and the rest of the population.

In contrast, no evidence is found that those with high incomes pulling away from the rest of the population harms growth.

The paper also evaluates the “human capital accumulation theory” finding evidence for human capital as a channel through which inequality may affect growth.

Analysis based on micro data from the Adult Skills Survey (PIAAC) shows that increased income disparities depress skills development among individuals with poorer parental education background, both in terms of the quantity of education attained (e.g. years of schooling), and in terms of its quality (i.e. skill proficiency).

Educational outcomes of individuals from richer backgrounds, however, are not affected by inequality.

via Trends in Income Inequality and its Impact on Economic Growth – Papers – OECD iLibrary.

The OECD analysis published overnight in Paris suggest that the increase in equality in New Zealand the late 1980s is still scarring economic growth today by about 15 percentage points in lost cumulative economic growth.

The analysis of the OECD  published overnight depends crucially upon how greater inequality reduces the ability of the lower income families to invest in human capital:

The evidence strongly suggests that high inequality hinders the ability of individuals from low economic background to invest in their human capital, both in terms of the level of education but even more importantly in terms of the quality of education.

The OECD theory of inequality and lower growth is there is a financing constraint because of inequality that reduces economic growth because of less human capital accumulation by lower income families.

This is interesting because in 2002, with Pedro Carneiro, James Heckman showed that lack of credit is not a major constraint on the ability of young Americans to attend college. They found that credit constraints prevent, at most, 4% of the U.S. population from attending. Credit constraints is weakening as a rationale for a lack of an accumulation of human capital, and can be easily solved.

The OECD is putting a lot of their growth inequality nexus eggs in one basket. That student loans and other government interventions are not closing credit constraints on financing higher education.

To add to that basket , they are placing a lot of weight in human capital as a driver of growth, and in New Zealand’s case,  of technology absorption, which is a main foundation of economic growth in New Zealand. The evidence that human capital is a key contributor  to higher economic growth is weakening ruck rather than strengthening.

The trend rate of productivity growth did not accelerate over the 20th century despite a massive rise in investments in human capital and R&D because of the rising cost of discovering and adapting new technological knowledge. The number of both R&D workers and highly educated workers increased many-fold over the 20th century in New Zealand and other OECD member countries including the global industrial leaders such as the USA, Japan and major EU member states.

Higher education has been free for the low income families for several generations. Student loans are readily available. It is hard to believe that such a readily solvable problem is a major source of inequality and lower growth.

Cross-country differences in total factor productivity are due to differences in the technologies that are actually used by a country and the degree in the efficiency with which these technologies are used. Differences in total factor productivity, rather than differences in the amount of human capital or physical capital per worker explain the majority of cross-country differences in per capita real incomes (Lucas 1990; Caselli 2005; Prescott 1998; Hall and Jones 1999; Jones and Romer 2010).

Differences in the skills of the individual worker or in the total stock of human capital of all workers in a country cannot explain  cross national differences in value added per worker at the industry level.

  • The USA competes with Japan for productivity leadership in many manufacturing industries.
  • The Japanese services sector productivity can be as little as a one-third of that of the USA.
  • Japanese labour productivity is almost twice Germany’s in producing automobiles and is better that Germany by a large margin for many other manufactured goods.
  • The USA is uniformly more productive in services sector labour productivity. For example, British, French and German telecom workers were 38 to 56 per cent as productive as their American counter-parts.

The USA, Japan, France, the UK and Germany all have relatively well-educated, experienced and tested labour forces. For example, the 1993 McKinsey’s study inquired into the education and skills levels of Japanese and German steel workers. Comparably skilled German steel workers were half as productive as their Japanese counterparts (Prescott and Parente 2000, 2005).

As for the source of the growing income inequality, there is a long literature dating back 25-years arguing that skill-biased technological change is increasing the returns to investing in education

Important is the OECD conclusion that inequality in terms of the rich getting richer does not harm growth. To make sure I have not misquoted them , I quote once again from their abstract, where the OECD summarises its own findings:

Drawing on harmonised data covering the OECD countries over the past 30 years, the econometric analysis suggests that income inequality has a negative and statistically significant impact on subsequent growth.

In particular, what matters most is the gap between low income households and the rest of the population.

In contrast, no evidence is found that those with high incomes pulling away from the rest of the population harms growth.

That  conclusion of the OECD  almost saves me from having to go on about how inequality has not increased in New Zealand for the last 20 years, see figure 2, and that the top 1% have not increased their share of income in recent decades  – see figure 3. The fact that the rich can get richer without harming the poor is an important conclusion that will surely not be reported by the media.

Figure 2: Gini coefficient New Zealand 1980-2015

Figure 3: Top 1% income shares, USA, New Zealand and Australia, 1970-2012

Another inconvenience for the OECD is the last major increase in Gini coefficient in New Zealand was followed by a 15 year economic firm – see figures 2 and 4.

Figure 4: Real GDP per New Zealander and Australian aged 15-64, converted to 2013 price level with updated 2005 EKS purchasing power parities, 1956-2013

The NZ top 1% share has been steady at 8-9% since the mid-1990s  see figure 4; the top 1%’s share rose strongly in the USA in recent decades, from 13% in the mid-1980s to 19% in 2012.

The Occupy crowd blame everything from the global financial crisis to a bad environment on growing inequality and the growing riches of living top 1%. Such an argument has no foundation in fact in New Zealand. The last major increase in Inequality was a long time ago in New Zealand.

The OECD is also rather casual about how policies to redistribute wealth and increasing incomes. While Western Europe is diverse, as a group, the higher taxes  in the European Union reduced incentives to work. Employment as a percentage of the population has been consistently lower in Western Europe than in the USA since the 1950s, with an average employment rate gap of 10 percentage points over 1980-2007.

Large increases in taxes on income from labour since the 1970s, enhanced incentives for retire early, and the interaction of generous employment insurance with the larger skill losses among workers displaced by the greater economic turbulence since 1980 all acted to reduce both real GDP and hours worked per week per working age person by up to a third in Western Europe as compared to the USA since the 1970s (Prescott 2004, 2007; Rogerson 2006, 2008; Ohanian et al. 2008; Ljungqvist and Sargent 1998, 2007, 2008). For example, Ohanian, Rao and Rogerson 2008 in “Work and taxes: allocation of time in OECD countries” found that:

  1. A steep decline in average hours worked per adult and large variations across OECD member countries in the magnitude of this decline.
  2. Changes in labour taxes accounted for a large share of the trend differences.
  3. Countries with high tax rates devote less time to market work, but more time to home activities, such as cooking and cleaning.
  4. This reallocation of time from market work to home work is much stronger for females than for males.

Europeans pay more taxes, work fewer hours per year, have longer vacations, retire sooner, and invest less in human capital in an era in which trends in technology have significantly increased the demand for skilled workers, more innovation, more intense competition and greater entrepreneurial alertness. In The Impact of Labor Taxes on Labor Supply: An International Perspective (AEI Press, 2010) Rogerson finds that:

• a 10 percentage point increase in the tax rate on labour leads to a 10 to 15 per cent decrease in hours of work.
• Even a 5 per cent decrease in hours worked would mean a decline in labour output equating to a serious recession.
• While recessions are temporary, permanent changes in government spending patterns have long-lasting repercussions.
• Although government spending provides citizens with important benefits, such benefits must be weighed against the disincentive effects of increased labour taxes.
• Policymakers who fail to account for the decrease in labour output risk expanding government programs beyond their optimal scale.

Robert Lucas estimated in 1990 that eliminating all taxes on income from capital would increase the U.S. capital stock by about 35% and consumption by 7%.

Hans Fehr, Sabine Jokisch, Ashwin Kambhampati, and Laurence J. Kotlikoff (2014) found that eliminating the corporate income tax completely would raise the U.S. capital stock (machines and buildings) by 23%, output by 8% and the real wages of unskilled and skilled workers each by 12%.

In summary, this one paper by the OECD, which is a working paper makes profound conclusions about taxation and economic growth that contradict a large literature based on the lack of statistical significance of coefficients in the OECD’s regressions.

More fundamentally, linking lower economic growth to inequality through credit constraints on the human capital accumulation of the lower middle class is a weak reed to hang its argument. Human capital is not a good explanation of variations in growth across time or between countries.

What happened to income inequality in New Zealand in the late 1980s is not a credible explanation for lower growth 30 years later. Lower economic growth because of greater inequality is certainly an easy problem to solve if all that is required is more action on the financing constraint on human capital accumulation.

Occupy Wall Street and the Tea Party compared

Occupy Wall Street protesters didn’t like what they found when they actually met the bottom 1%

Occupy Wall Street protesters are in their second month of being stationed at Zuccotti Park.

The Occupy Wall Street protesters had free food provided by kitchens staffed by volunteers.

Occupy Wall Street Chefs Stop Cooking Fancy Meals

These self appointed representatives of the bottom 99% didn’t appreciate brushing shoulders with the bottom 1 percent of the social stratum:

The Occupy Wall Street volunteer kitchen staff launched a “counter” revolution yesterday — because they’re angry about working 18-hour days to provide food for “professional homeless” people and ex-cons masquerading as protesters.

For three days beginning tomorrow, the cooks will serve only brown rice and other spartan grub instead of the usual menu of organic chicken and vegetables, spaghetti bolognese, and roasted beet and sheep’s-milk-cheese salad.

They will also provide directions to local soup kitchens for the vagrants, criminals and other freeloaders who have been descending on Zuccotti Park in increasing numbers every day.

To show they mean business, the kitchen staff refused to serve any food for two hours yesterday in order to meet with organizers to air their grievances, sources said…

Overall security at the park had deteriorated to the point where many frightened female protesters had abandoned the increasingly out-of-control occupation, security- team members said.

Bryan Caplan on the pathologies of poverty

Bryan Caplan drew up a nice list of factors that contribute to poverty

  • alcoholism: Alcohol costs money, interferes with your ability to work, and leads to expensive reckless behaviour.
  • drug addiction: Like alcohol, but more expensive, and likely to eventually lead to legal troubles you’re too poor to buy your way out of.
  • single parenthood: Raising a child takes a lot of effort and a lot of money.  One poor person rarely has enough resources to comfortably provide this combination of effort and money.
  • unprotected sex: Unprotected sex quickly leads to single parenthood.  See above.
  • dropping out of high school: High school drop-outs earn much lower wages than graduates.  Kids from rich families may be able to afford this sacrifice, but kids from poor families can’t.
  • being single: Getting married lets couples avoid a lot of wasteful duplication of household expenses.  These savings may not mean much to the rich, but they make a huge difference for the poor.
  • non-remunerative crime: Drunk driving and bar fights don’t pay.  In fact, they have high expected medical and legal expenses.  The rich might be able to afford these costs.  The poor can’t.

Caplan argues that there is an undeserving poor if they fail to follow the following reasonable steps to avoid poverty and hardship:

  1. Work full-time, even if the best job you can get isn’t fun.
  2. Spend your money on food and shelter before getting cigarettes and cable t.v.
  3. Use contraception if you can’t afford a child

The Top 1% of income earners in NZ are lazy – the Occupy Movement have nothing to protest about – updated

The NZ top 1% share has been steady at 8-9% since the mid-1990s. The top 1%’s share rose strongly in the USA in recent decades, from 13% in the mid-1980s to 19% in 2012.

Figure 1: Top 1% income shares, USA, New Zealand and Sweden, 1970-2012

clip_image002

Source: The World Top Income Database at http://topincomes.g-mond.parisschoolofeconomics.eu/#Database

The top 1% in New Zealand is so lazy that Sweden is overtaking it – See figure 1.

The Occupy crowd blame everything from the global financial crisis to a bad environment on growing inequality and the top 1%. Such an argument has no foundation in fact in New Zealand.

Income inequality as measured by the Gini coefficient has not risen much in New Zealand for 20 years – See figure 2. How can the poor be getting getting poorer, ground under by  the yoke of capitalism, if the rich are not getting richer. The occupy movement should apply for unemployment benefits and seek career guidance.

Figure 2: Gini coefficient New Zealand 1980-2015

clip_image002[7]

Source: Bryan Perry, Household incomes in New Zealand: Trends in indicators of inequality and hardship 1982 to 2013. Ministry of Social Development (July 2014).

The last major increase in income inequality in New Zealand was  in the late 1980s and early 1990s and that was followed by a long economic boom – See figure 3 .

Figure 3:  Real GDP per New Zealander and Australian aged 15-64, converted to 2013 price level with updated 2005 EKS purchasing power parities, 1956-2012

image

Source: Computed from OECD Stat Extract and The Conference Board, Total Database, January 2014, http://www.conference-board.org/economics .

This long boom was after two decades of next to no economic growth in the 1970s and 1980s in New Zealand  – see figure 3 . This depression between 1974 and 1992 was New Zealand’s lost decades.

Figure 4 shows that both the lost decades of economic growth in New Zealand and the emergence of the trans-Tasman income gap the seemed to somewhat coincide with the top 1% of earners in Australia increasing their share of income from 6% to 10% of total incomes while the New Zealand top 1% sat on their hands. They are such lazy devils.

Figure 4: Top 1% income shares, USA, New Zealand and Australia, 1970-2012

image

Source: The World Top Income Database at http://topincomes.g-mond.parisschoolofeconomics.eu/#Database

Why is inequality and the top 1% all the rage at the moment

Image

How the rich got rich

Image

Stephen Williamson on Marginal Taxation

Karl Smith's avatarModeled Behavior

He says a lot. I’ll try to address piece by piece.

Next, some people have shown interest in this paper by Diamond and Saez. A key result that seemed to get these people excited is the calculation of a top optimal marginal tax rate (including all taxes) of 73%, relative to the current rate of 42.5%. There are two key assumptions that Diamond and Saez make to come up with the 73% optimal rate. First, we should not care about the welfare (at the margin) of the rich people. This argument is based solely on the notion that marginal utility of income is low for the top income-earners. Second, Diamond and Saez use a “behavioral elasticity” of tax revenue with respect to the tax rate of 0.25. To see how this matters, if you use their formula and an elasticity of one, you get an optimal top tax rate…

View original post 1,215 more words

The Far Left view of the welfare state

HT: Dan Mitchell

Previous Older Entries Next Newer Entries

Bassett, Brash & Hide

Celebrating humanity's flourishing through the spread of capitalism and the rule of law

Truth on the Market

Scholarly commentary on law, economics, and more

The Undercover Historian

Beatrice Cherrier's blog

Matua Kahurangi

Celebrating humanity's flourishing through the spread of capitalism and the rule of law

Temple of Sociology

Celebrating humanity's flourishing through the spread of capitalism and the rule of law

Velvet Glove, Iron Fist

Celebrating humanity's flourishing through the spread of capitalism and the rule of law

Why Evolution Is True

Why Evolution is True is a blog written by Jerry Coyne, centered on evolution and biology but also dealing with diverse topics like politics, culture, and cats.

Down to Earth Kiwi

Celebrating humanity's flourishing through the spread of capitalism and the rule of law

NoTricksZone

Celebrating humanity's flourishing through the spread of capitalism and the rule of law

Homepaddock

A rural perspective with a blue tint by Ele Ludemann

Kiwiblog

DPF's Kiwiblog - Fomenting Happy Mischief since 2003

The Dangerous Economist

Celebrating humanity's flourishing through the spread of capitalism and the rule of law

Watts Up With That?

The world's most viewed site on global warming and climate change

The Logical Place

Tim Harding's writings on rationality, informal logic and skepticism

Doc's Books

A window into Doc Freiberger's library

The Risk-Monger

Let's examine hard decisions!

Uneasy Money

Commentary on monetary policy in the spirit of R. G. Hawtrey

Barrie Saunders

Thoughts on public policy and the media

Liberty Scott

Celebrating humanity's flourishing through the spread of capitalism and the rule of law

Point of Order

Politics and the economy

James Bowden's Blog

A blog (primarily) on Canadian and Commonwealth political history and institutions

Science Matters

Reading between the lines, and underneath the hype.

Peter Winsley

Economics, and such stuff as dreams are made on

A Venerable Puzzle

"The British constitution has always been puzzling, and always will be." --Queen Elizabeth II

The Antiplanner

Celebrating humanity's flourishing through the spread of capitalism and the rule of law

Bet On It

Celebrating humanity's flourishing through the spread of capitalism and the rule of law

History of Sorts

WORLD WAR II, MUSIC, HISTORY, HOLOCAUST

Roger Pielke Jr.

Undisciplined scholar, recovering academic

Offsetting Behaviour

Celebrating humanity's flourishing through the spread of capitalism and the rule of law

JONATHAN TURLEY

Res ipsa loquitur - The thing itself speaks

Conversable Economist

Celebrating humanity's flourishing through the spread of capitalism and the rule of law

The Victorian Commons

Researching the House of Commons, 1832-1868

The History of Parliament

Articles and research from the History of Parliament Trust

Books & Boots

Reflections on books and art

Legal History Miscellany

Posts on the History of Law, Crime, and Justice

Sex, Drugs and Economics

Celebrating humanity's flourishing through the spread of capitalism and the rule of law

European Royal History

Exploring the Monarchs of Europe

Tallbloke's Talkshop

Cutting edge science you can dice with

Marginal REVOLUTION

Small Steps Toward A Much Better World

NOT A LOT OF PEOPLE KNOW THAT

“We do not believe any group of men adequate enough or wise enough to operate without scrutiny or without criticism. We know that the only way to avoid error is to detect it, that the only way to detect it is to be free to inquire. We know that in secrecy error undetected will flourish and subvert”. - J Robert Oppenheimer.

STOP THESE THINGS

The truth about the great wind power fraud - we're not here to debate the wind industry, we're here to destroy it.

Lindsay Mitchell

Celebrating humanity's flourishing through the spread of capitalism and the rule of law

Alt-M

Celebrating humanity's flourishing through the spread of capitalism and the rule of law

croaking cassandra

Economics, public policy, monetary policy, financial regulation, with a New Zealand perspective

The Grumpy Economist

Celebrating humanity's flourishing through the spread of capitalism and the rule of law

International Liberty

Restraining Government in America and Around the World