Over the last few days I’ve been reading a few pieces on UK monetary policy and high inflation. The first was a speech from the Deputy Governor responsible for economics and monetary policy, Ben Broadbent (over there senior central bankers actually give serious and thoughtful speeches on things the Bank has responsibility for), and the second was a new paper by long-term adviser, analyst and researcher Tim Congdon. There is a lot of overlap because Congdon’s paper is broader (“Why has inflation come back”) but his analytical approach has tended to emphasise the monetary aggregates, while Broadbent’s speech which is narrower in focus is specifically on the question of what information value for monetary policymakers there is (or isn’t) in the monetary aggregates over the longer term and in the specific context of the inflation of the last couple of years. Both are worth reading.
My own view on the…
View original post 2,353 more words


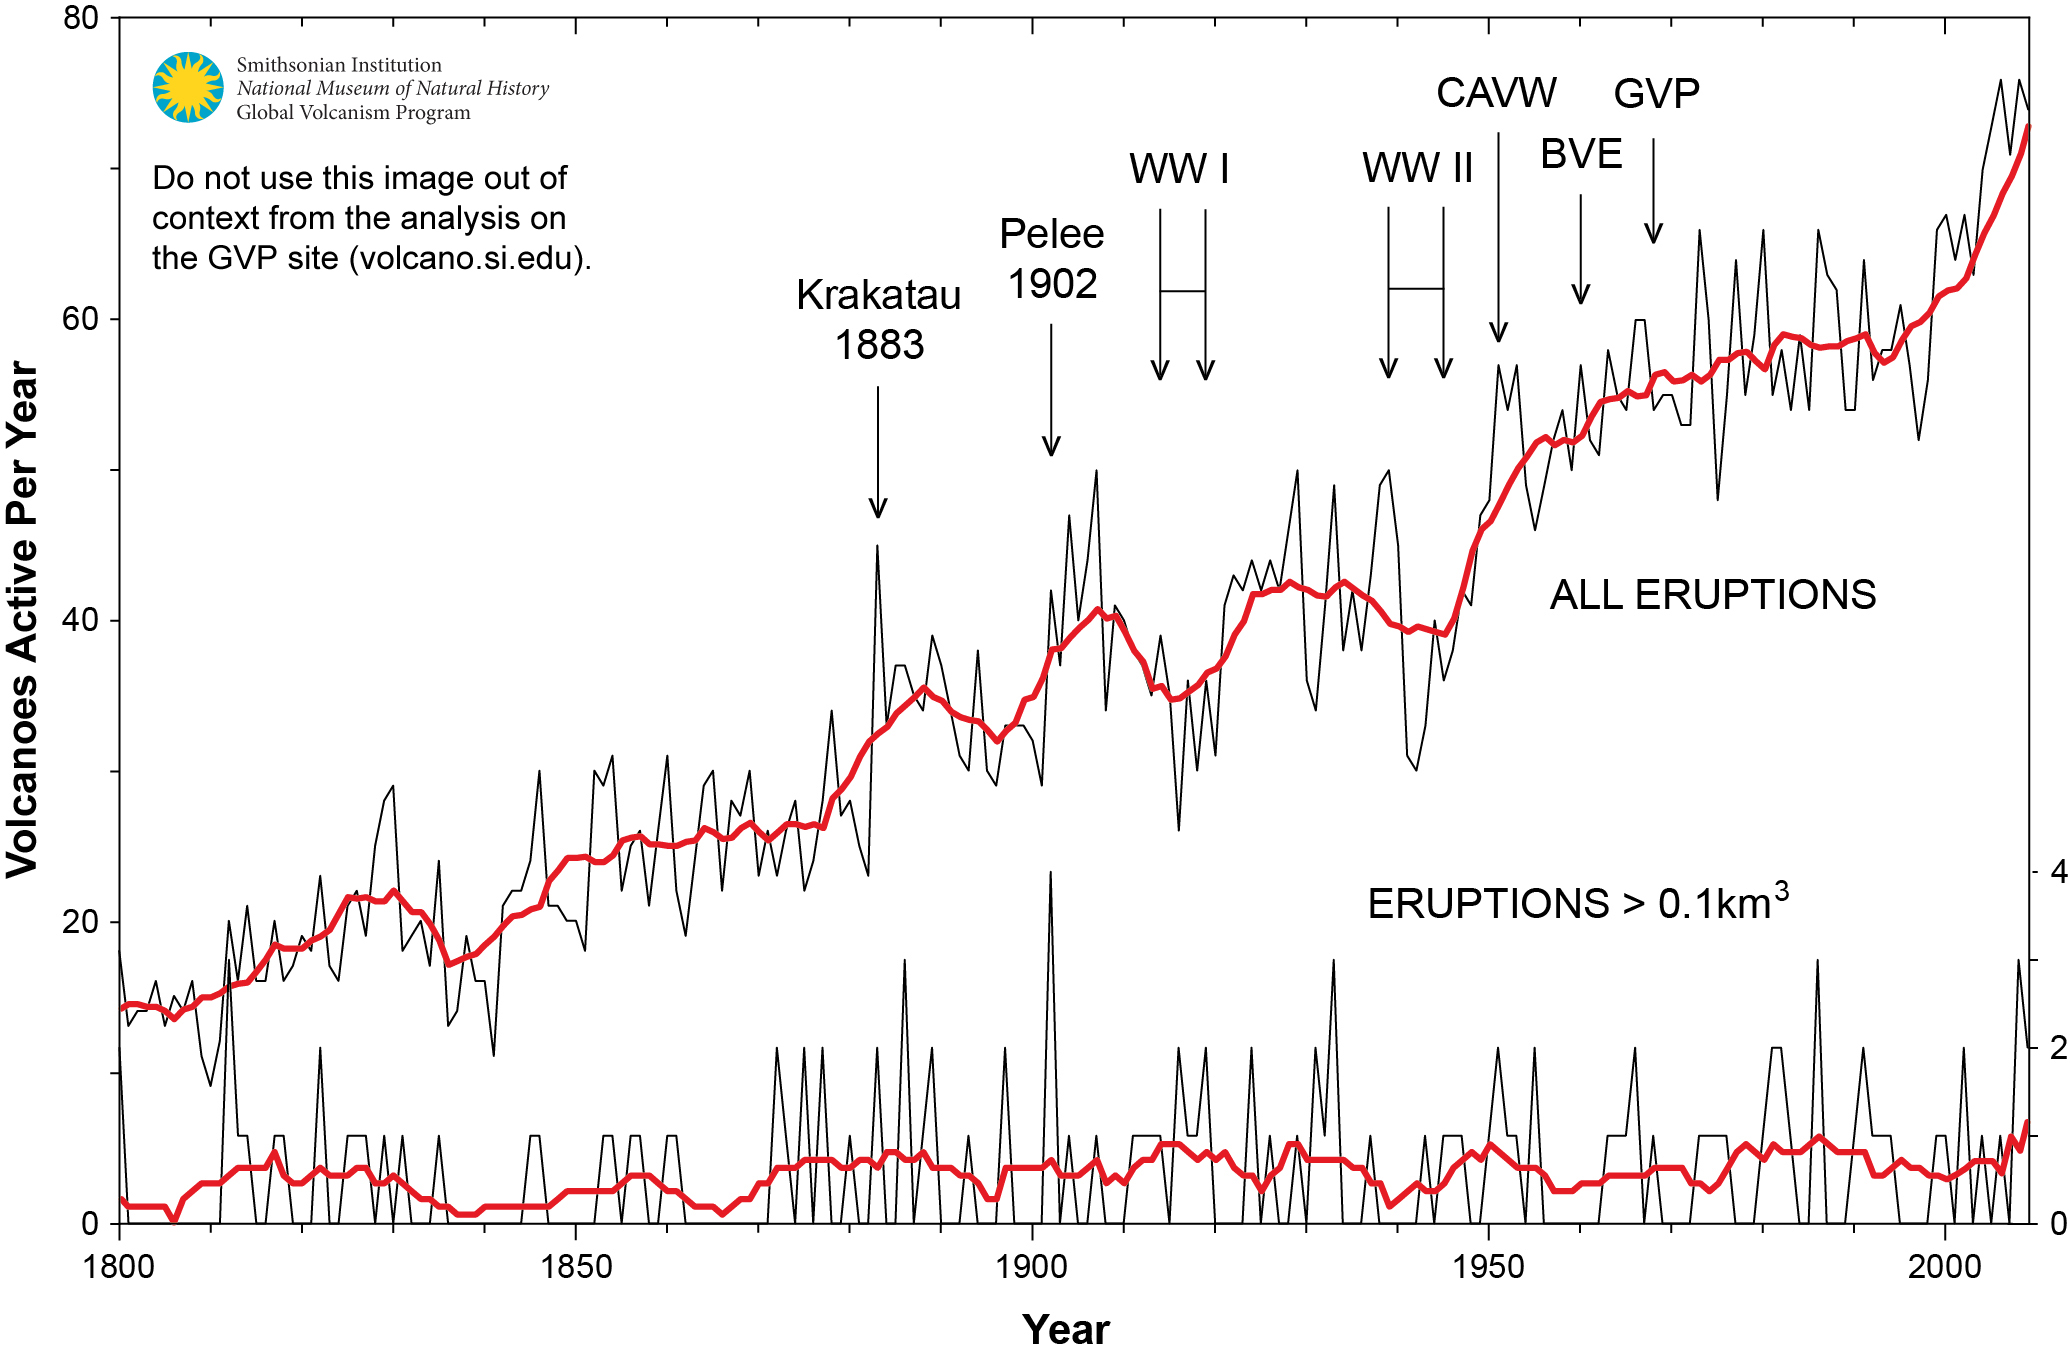 Figure 1. Graph showing the number of volcanoes reported to have been active each year since 1800 CE. Total number of volcanoes with reported eruptions per year (thin upper black line) and 10-year running mean of same data (thick upper red line). Lower lines show only the annual number of volcanoes producing large eruptions (>= 0.1 km3 of tephra or magma) and scale is enlarged on the right axis; thick red lower line again shows 10-year running mean.

Recent Comments