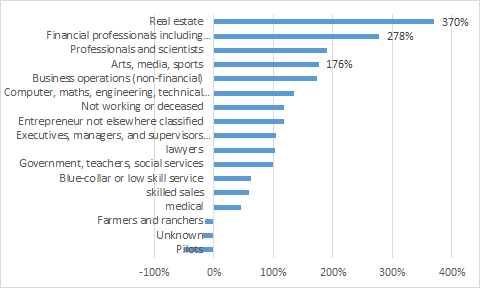
The members of the top 1% whose income increased the most between 1979 and 2005 were real estate professionals followed by financial professionals – see figure 1.
Figure 1: increase in share of national income (including capital gains) received by top 1% for each primary taxpayer occupation in top 1% between 1979 and 2005
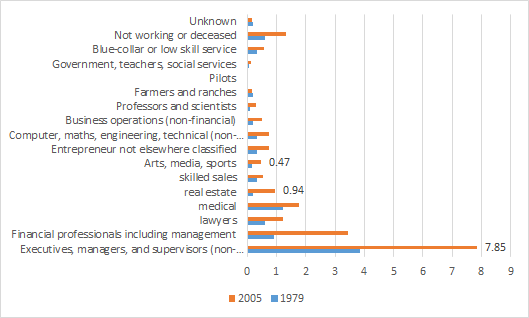
Figure 2 shows that the fastest-growing shares among the top 1% as in figure 1 are not necessarily the largest occupational group are those income earners. Moreover, their fortunes seem largely unrelated to each other.
Figure 2: Percentage of national income (including capital gains) received by top 1%, and each primary taxpayer occupation in top 1%
The next members of the top 1% in terms of income growth were rather respectable group:professionals and scientists and arts, media and sports. The latter,arts, media and sports get a complete pass on their membership of the top 1% despite their great success in increasing their incomes since 1979 at the expense apparently on the bottom 99% if the Twitter Left is to be believed.
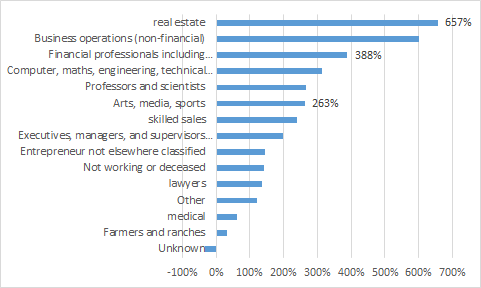
Figure 3: increase in share of national income (including capital gains) received by top 0.1% for each primary taxpayer occupation in top 0.1%between 1979 and 2005
Arts, media and sports superstars are one of the fastest-growing members of the top 0.1% – see figure 3. Again, the arts, media and sports superstars get a complete pass on their membership of the top 0.1% from the Twitter Left. Most of the other occupations in the top 0.1% don’t strike me as anything other than working rich – see figure 3 and figure 4.
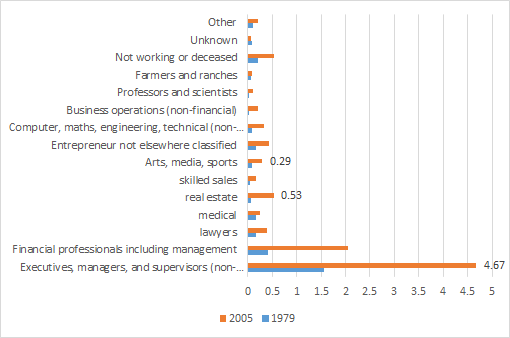
As with the top 1%, the top 0.1% of income earners are a mixed bag of occupations – see figure 4. Their fortunes are unrelated to each other terms of the forces driving there are increased incomes.
Figure 4: Percentage of national income (including capital gains) received by top 0.1%, and each primary taxpayer occupation in top 0.1%
Piketty and Saez (2003) concluded that a substantial fraction of the rise in top incomes was due to surging top wage incomes. They concluded that top executives (the ‘working rich’) replaced top capital owners (the ‘rentiers’) at the top of the income hierarchy.
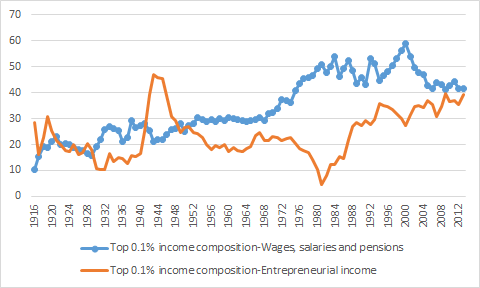
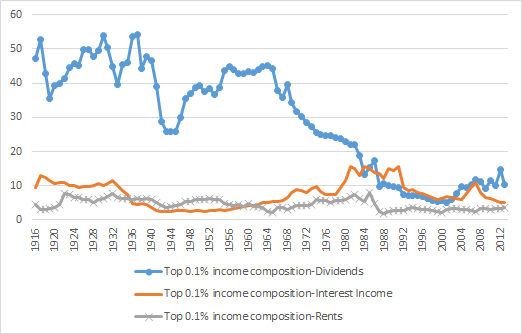
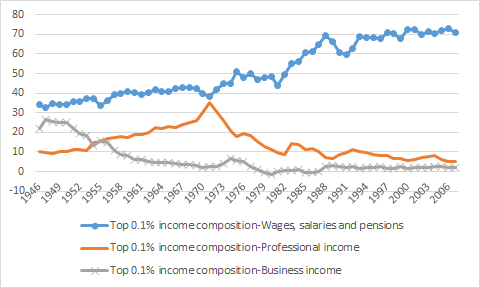
That conclusion still holds for both the USA and Canada. The largest portion of the top 0.1% in both countries have become those earning wages. The top 0.1% are top wage earners who work for their livings founding, building or directing businesses.
Figure 1: percentage of top 0.1% with wages, salaries, pensions or entrepreneurial incomes, USA, 1916 – 2013
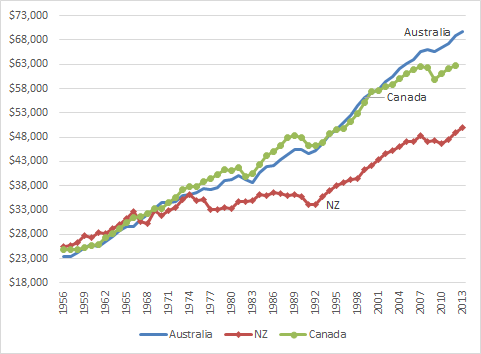
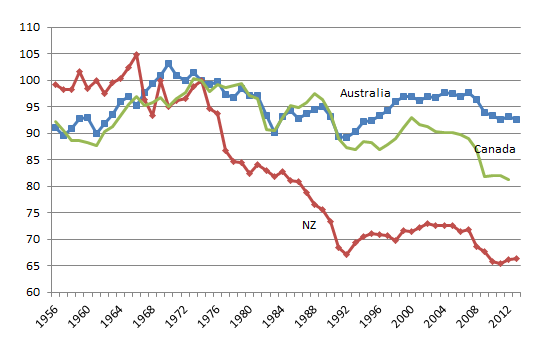
Figure 1 shows that Canada has been diverging from Australia in real GDP per working age person since the mid-1990s particularly since the global financial crisis.
Figure 1: Real GDP per New Zealander, Canadian and Australian aged 15-64, converted to 2013 price level with updated 2005 EKS purchasing power parities, 1956-2013
In common with New Zealand, Figure 2 shows that Canadian productivity has been in a pretty much along declines is about 1974, rarely catching up with any lost ground. Figure 1 shows that Canada used to be richer than Australia but is now poorer than Australia. Figure 2 is real GDP growth data detrended by the growth rate of the USA in the 20th century. A flat line in figure 2 is annual real GDP growth at 1.9%; a rising line is growth above 1.9%; a falling line is annual growth below 1.9% a year.
Figure 2: Real GDP per New Zealander, Canadian and Australian aged 15-64, converted to 2013 price level with updated 2005 EKS purchasing power parities, 1.9 per cent detrended, 1956-2013
Figure 2 shows that Canadian productivity has been below trend for perhaps 30 years. There has been the occasional recovery but followed by a further decline. If Canadian labour productivity had grown at the same rate as the USA since 1974, labour productivity in Canada is something like 18% better.
Australia, as shown in figure 2, has neither caught up nor falling behind the USA in labour productivity for the entire post-war period since 1956. Canada has been falling behind its neighbour most markedly since the mid-1970s.
Canada fell 10 percentage points further behind the USA in relative labour productivity between the mid-1970s and the mid-1990s.
Canada stopped falling further behind the USA after 1995 to 2005 but, in common with New Zealand, Canadian labour productivity did not rebound to recover the prior lost ground.
The proximate causes of the Canadian productivity gap with the USA have a familiar echo to New Zealand ears. Relative to the USA, Rao et al. (2006) and Sharp (2003) attributed the gap to less capital per worker, an innovation gap as shown by lower R&D expenditure, a smaller and less dynamic high technology sector, less developed human capital at the top end of the labour market, and more limited scale and scope economies.
These factors have been put forward, at one time or another, as the proximate causes of the New Zealand productivity gap with the USA. Identifying the barriers to higher Canadian productivity may offer fresh insights into removing similar productivity barriers in New Zealand.
Canada, New Zealand and Australia should be catching-up with the USA in productivity per capita because copying the global leader is cheaper than innovation. Canada, New Zealand and Australia all have the basics to do this: a market economy, the rule of law and openness to foreign technology and international trade.
Instead of asking why New Zealand is not catching-up with Australian productivity, further study of the lack of productivity catch-up of Australia and Canada with the USA may uncover subtle barriers to productivity growth with similarities in New Zealand.
The productivity decline in Canada is of interest in New Zealand because Canada certainly cannot blame remoteness because it borders the USA. Canada cannot blame lack of size because it is noticeably larger than Australia and certainly New Zealand.
The Empire State building is dedicated in NYC. Here's a cool construction photo of the building, May 1st, 1931. http://t.co/map6v6A5dI— Classic Pics (@classicepics) May 30, 2015
Taylor’s basic point is economists have enough trouble working out what causes economic growth so trawling within that subset of causes to quantify the effects of rising or falling inequality inequality seems to be torturing the data to confess. The empirical literature is simply inconclusive as Taylor says:
A variety of studies have undertaken to prove a connection from inequality to slower growth, but a full reading of the available evidence is that the evidence on this connection is inconclusive.
Most discussions of the link between inequality and growth are notoriously poor of theories connecting two. There are three credible theories in all listed in the OECD’s report:
The report first points out (pp. 60-61 that as a matter of theory, one can think up arguments why greater inequality might be associated with less growth, or might be associated with more growth. For example, inequality could result less growth if:
1) People become upset about rising inequality and react by demanding regulations and redistributions that slow down the ability of an economy to produce growth;
2) A high degree of persistent inequality will limit the ability and incentives of those in the lower part of the income distribution to obtain more education and job experience; or
3) It may be that development and widespread adoption of new technologies requires demand from a broad middle class, and greater inequality could limit the extent of the middle class.
About the best theoretical link between inequality and economic growth is what Taylor calls the "frustrated people killing the goose that lays the golden eggs." Excessive inequality within a society results in predatory government reactions at the behest of left-wing or right-wing populists.
Taylor refers to killing the goose that laid the golden egg as dysfunctional societal and government responses to inequality. He is right but that is not how responses to inequality based on higher taxes and more regulation are sold. Thomas Piketty is quite open about he wants a top tax rate of 83% and a global wealth tax to put an end to high incomes:
When a government taxes a certain level of income or inheritance at a rate of 70 or 80 percent, the primary goal is obviously not to raise additional revenue (because these very high brackets never yield much).
It is rather to put an end to such incomes and large estates, which lawmakers have for one reason or another come to regard as socially unacceptable and economically unproductive…
The left-wing parties don’t say let’s put up taxes and redistribute so that is not something worse and more destructive down the road. Their argument is redistribution will increase growth or at least not harm it. That assumes the Left is addressing this issue of not killing the goose that lays the golden egg at all.
Once you discuss the relationship between inequality and growth in any sensible way you must remember your John Rawls. Incentives encourage people to work, save and invest and channels them into the occupations where they make the most of their talents. Taylor explains:
In the other side, inequality could in theory be associated with faster economic growth if: 1) Higher inequality provides greater incentives for people to get educated, work harder, and take risks, which could lead to innovations that boost growth; 2) Those with high incomes tend to save more, and so an unequal distribution of income will tend to have more high savers, which in turn spurs capital accumulation in the economy.
Taylor also points out that the OECD’s report is seriously incomplete by any standards because it fails to mention that inequality initially increases in any poor country undergoing economic development:
The report doesn’t mention a third hypothesis that seems relevant in a number of developing economies, which is that fast growth may first emerge in certain regions or industries, leading to greater inequality for a time, before the gains from that growth diffuse more widely across the economy.
At a point in its report, the OECD owns up to the inconclusive connection between economic growth and rising inequality as Taylor notes:
The large empirical literature attempting to summarize the direction in which inequality affects growth is summarised in the literature review in Cingano (2014, Annex II).
That survey highlights that there is no consensus on the sign and strength of the relationship; furthermore, few works seek to identify which of the possible theoretical effects is at work. This is partly tradeable to the multiple empirical challenges facing this literature.
The OECD’s report responds to this inclusiveness by setting out an inventory of tools with which you can torture the data to confess to what you want as Taylor notes:
There’s an old saying that "absence of evidence is not evidence of absence," in other words, the fact that the existing evidence doesn’t firmly show a connection from greater inequality to slower growth is not proof that such a connection doesn’t exist.
But anyone who has looked at economic studies on the determinants of economic growth knows that the problem of finding out what influences growth is very difficult, and the solutions aren’t always obvious.
The chosen theory of the OECD about the connection between inequality and economic growth is inequality leads to less investment in human capital at the bottom part of the income distribution.
[Inequality] tends to drag down GDP growth, due to the rising distance of the lower 40% from the rest of society. Lower income people have been prevented from realising their human capital potential, which is bad for the economy as a whole
There are a few common patterns in economic growth. All high-income countries have near-universal K-12 public education to build up human capital, along with encouragement of higher education. All high-income countries have economies where most jobs are interrelated with private and public capital investment, thus leading to higher productivity and wages.
All high-income economies are relatively open to foreign trade. In addition, high-growth economies are societies that are willing to allow and even encourage a reasonable amount of disruption to existing patterns of jobs, consumption, and ownership. After all, economic growth means change.
In New Zealand, interest free student loans are available to invest in higher education as well as living allowances for those with parents on a low income. There are countries in Europe with low levels of investment in higher education but that’s because of high income taxes not because of inequality.
The OECD’s report is fundamentally flawed which is disappointing because most research from the OECD is to a good standard.
Why Evolution is True is a blog written by Jerry Coyne, centered on evolution and biology but also dealing with diverse topics like politics, culture, and cats.
In Hume’s spirit, I will attempt to serve as an ambassador from my world of economics, and help in “finding topics of conversation fit for the entertainment of rational creatures.”









Recent Comments