Is Growth of Government Inevitable? | Sam Peltzman video
12 Nov 2014 Leave a comment
in economics of regulation, income redistribution, liberalism, Public Choice, public economics, rentseeking, Sam Peltzman Tags: growth of government, Sam Peltzman
The rapid rise of Uber in DC for politicians and their staffs » AEI
12 Nov 2014 Leave a comment
in applied welfare economics, Austrian economics, economics of regulation Tags: taxi regulation, Uber

The Effects of Liability Rules on Precaution and Activity Levels
10 Nov 2014 4 Comments
The care and activity level effects of various rules are summarized on the following table:
|
Is There An |
No Liability |
Strict Liability |
Negligence |
Strict Liability |
| Care by Truck Driver? |
. |
|
|
|
|
Truck Activity? |
. |
|
. |
|
|
Care by Car Driver? |
|
. |
|
. |
|
Car Activity? |
|
. |
|
. |


The general lesson is that whether a negligence standard or a strict-liability standard would be better depends on:
(a) the relative risk aversion of the parties and
(b) who is most likely to be the best activity-level modulator.
If defendants can best adjust the level of their activities, we might wish to use a strict liability rule.
If plaintiffs are the best activity-level modulators, we would tend to prefer a negligence rule.
For further discussion of the effects of legal rules on care and activity levels in unilateral and bilateral accidents, see Steven Shavall’s Strict Liability versus Negligence 9 J. Legal Stud. 1, 2-3 (1980).
Why Middle-Class Americans Can’t Afford to Live in Liberal Cities – The Atlantic
07 Nov 2014 Leave a comment
in applied welfare economics, economics of regulation, environmental economics, income redistribution, Public Choice, rentseeking, urban economics Tags: Director's Law, green rent seeking, land use regulation, zoning


Andrew Atkin explains how housing affordability has been destroyed in New Zealand.
05 Nov 2014 Leave a comment
in economics of regulation, politics - New Zealand, politics - USA, urban economics Tags: Auckland urban limit, land use regulation, metropolitan urban limits, Resource Management Act, zoning
Heritage trumps safety
03 Nov 2014 Leave a comment
in applied welfare economics, economics of regulation, urban economics Tags: Christchurch earthquake, green rent seeking, health and safety, Heritage regulation

Quote of the day:
. . . Deaths in earthquakes are somewhat unavoidable. But deaths caused by regulatory structures that force that little value is placed on human life, or that prevent a building owner from tearing down a building very likely to kill a pile of people in a quake, are worse than tragic – they’restupid. Offsetting Behaviour.
It’s in a post on heritage rules which make some buildings untouchable and how the burden of providing the heritage amenity falls on the owner of the building.
He has a better idea:
I’ve suggested an alternative structure where we run heritage protection as an on-budget Council expenditure. Have each Council decide how much money they’re willing to put into heritage preservation, perhaps have Central provide a matching grant, and open it up to further voluntary contributions from the public. Then, have the heritage boards decide how and…
View original post 176 more words
Coalition Celebrating Equal Pay Case Outcome
29 Oct 2014 Leave a comment
in applied price theory, applied welfare economics, economics of regulation, gender, income redistribution, minimum wage, politics - New Zealand, rentseeking Tags: gender wage gap, living wage, minimum wage, pay equity
I wonder who will pay for this? Caregiver wages are funded out of a fixed budget allocated by the government.
A higher wage will change the type of worker that the caregiving sector will seek to recruit, as happened after increases in the teenage went minimum wage.
When the teenage minimum wage went up in New Zealand, employment of 17 and 18-year-olds fell, while the employment of 18 to 19-year-olds increased because the latter were more mature and reliable than the younger contemporaries.

Media release: Pay Equity Challenge Coalition
28 October 2014
Coalition Celebrating Equal Pay Case Outcome
“The Court of Appeal’s decision declining the employers’ appeal in the Kristine Bartlett case is a huge victory for women workers” said Pay Equity Coalition Challenge spokesperson Angela McLeod.
“The Courts’ decision that equal pay may be determined across industries in female-dominated occupations revitalises the Equal Pay Act 1972 and will be a major factor in closing New Zealand’s stubborn 14 percent gender pay gap”.
The judgement by the Court of Appeal upholding the Employment Court decision again validates the work of caregivers and that they are underpaid, she said.
“We commend the Service and Food Workers Union Nga Ringa Tota in taking this case and exposing the underpayment and undervaluation of aged care workers. And the decision is a victory for all the women’s organisations who have never given up fighting for equal pay,”…
View original post 92 more words
Not too long ago, the left promoted the pointlessness of minimum wage – Whale Oil Beef Hooked
29 Oct 2014 Leave a comment
in applied price theory, applied welfare economics, economics of regulation, labour economics, Marxist economics, minimum wage Tags: minimum wage
The fire of truth: the relationship between inequality and economic prosperity in New Zealand since the 1970s
29 Oct 2014 Leave a comment
in economic growth, economics of regulation, income redistribution, politics - New Zealand, rentseeking Tags: Auckland urban limit, economic growth, Gini coefficient, green rent seeking, poverty and inequality, Resource Management Act
Figure 1: Before Housing Costs Gini coefficient, New Zealand, 1982 – 2013

closertogether.org.nz/nzs-income-inequality-problem claims that NZ income inequality increased very rapidly in the late 1980s and 1990s — faster than in any other wealthy country.
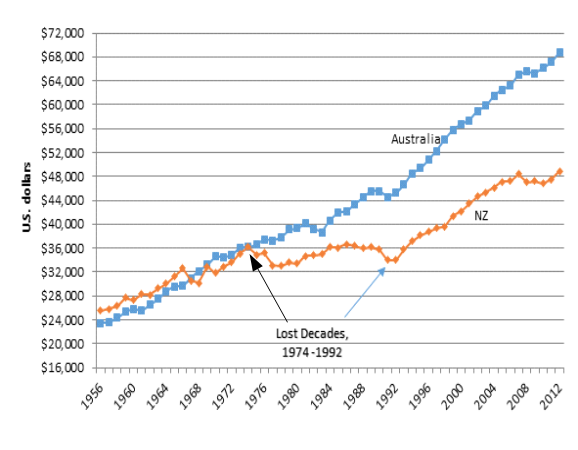
Figure 2 shows that this rapid rise in inequality coincided with the resumption of economic growth after two lost decades: next to no increase in real GDP per working age New Zealander from 1974 to 1992.
Figure 2: Real GDP per New Zealander and Australian aged 15-64, converted to 2013 price level with updated 2005 EKS purchasing power parities, 1956-2012
Source: Source: Computed from OECD Stat Extract and The Conference Board, Total Database, January 2014, http://www.conference-board.org/economics
Perry (2014) found that:
- Income inequality in New Zealand is at a similar level to Australia, Canada, Italy and Japan (Ginis of 32-33) and a little lower than the UK (34). Countries such as Denmark, Norway, Finland and Belgium have lower than average inequality (Ginis of 25-26). The US and Israel have higher scores of 39.
- The top 1% in New Zealand received around 8% of all taxable income in 2010 and 2011 (before tax), similar to Norway, Finland and Australia, lower than Ireland and Switzerland (11%) and much lower than the UK and Canada (13%) and the US (18%).
- The trend for the New Zealand share has been steady at around 8-9% since the mid 1990s, with perhaps a slight fall in the last few years. Many OECD countries saw small rises in the period, and in the USA the top 1% share continued to rise strongly, from 13% to 19%.
Perry (2014) concluded that:
Overall, there is no evidence of any sustained rise or fall in inequality in the last two decades. The level of household disposable income inequality in New Zealand is a little above the OECD median. The share of total income received by the top 1% of individuals is at the low end of the OECD rankings.
This remark by Parry that there is no evidence of any sustained rise or fall in inequality in New Zealand in the last 20 years is very much at odds with the claim of Closer Together New Zealand that income inequality inequality increased rapidly in the late 1980s and 1990s.
The increase in inequality in New Zealand was in the late 1980s and early 1990s. In the early 1990s, a long economic boom started that lasted until the global financial crisis.
Figure 3 : Income Inequality in New Zealand as Assessed by the Gini Coefficient

Source: Perry 2014 derived from Statistics NZ Household Economic Survey (HES) 1982–2012.
Figure 4: Income Inequality in New Zealand as Assessed by the P80/P20 Ratio

Source: Perry 2014 derived from Statistics NZ Household Economic Survey (HES) 1982–2012.
Figures 3 and 4 both show that after housing costs inequality in New Zealand is higher, but has been pretty stable for 20 years as measured by the Gini coefficient and by the P80/P20 ratio. (When individuals are ranked by equivalised household income and then divided into 100 equal groups, each group is called a percentile. If the ranking starts with the lowest income, then the income at the top of the 20th percentile is denoted P20; the income at the top of the 80th percentile is called P80. The ratio of the value at the top of the 80th percentile to the value at the top of the 20th percentile is called the P80/20 ratio and is often used as a measure of income inequality).
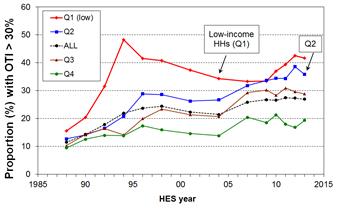
Figure 5: Proportion of HHs with housing cost outgoings to income of greater than 30%, by income quintile
Source: Perry (2014); OTI = outgoings to income
Figure 5 shows that
- for the bottom quintile (Q1), the proportion with high outgoings to income (OTI) steadily reduced from 48% in 1994 to 34% in 2004, as unemployment fell, employment and income rose, and income-related rental policies were introduced in 2000 for those in HNZC houses. From HES 2009 to HES 2013 the proportion rose strongly from 33% to 42%, the highest it has been in the last 25 years except for the peak of 48% in 1994.
- For households with incomes in the second quintile (Q2) there was a strong rise from the 1980s through to the mid 1990s, followed by a relatively flat trend to 2004. Since 2004, the proportion with high OTIs has risen strongly from 27% to 36%.
- For the third quintile (Q3) the proportion with high OTIs settled at around 30% for 2007 to 2013, up from 21% in 2004 and 10% in 1988.
Rising housing costs in New Zealand have one explanation, which is restrictions on the supply of land under the Resource Management Act.
HT: nzchildren.co.nz/income_inequality for figures 3 and 4.
How to sell a toxic pesticide the smart way–call it organic | Genetic Literacy Project
29 Oct 2014 Leave a comment
in economics of regulation, environmental economics, health economics Tags: food safety, food snobs, Quacks

If you are a pesticide company wondering how you can sell a product without being caught in a cultural crossfire, I have good news.
There is a template for marketing success you can use free of charge, courtesy ofMcLaughlin Gormley King Company (MGK) and Valent, which recently announced a sales partnership: Make a toxic chemical cocktail that meets National Organic Program standards and then have the product sold by a subsidiary to foster the perception that it’s a family-run organic companies and not part of the same multinational chemical conglomerate.
via How to sell a toxic pesticide the smart way–call it organic | Genetic Literacy Project.



Recent Comments