
Nurses against vaccines!
13 Dec 2014 Leave a comment
in health economics, occupational choice Tags: anti-vaccination movement, vaccinations, vaccines
Charles Murray and the OECD’s Trends in Income Inequality and its Impact on Economic Growth – IQ, signalling, over-education and plain bad career advice
11 Dec 2014 Leave a comment
in economics of education, human capital, international economics, labour supply, occupational choice, poverty and inequality Tags: Bryan Caplan, Charles Murray, IQ and education, poverty and inequality, signalling
Charles Murray has been cooking with gas lately – on fire. One of his points is too many go to college. Murray points out that succeeded at college requires an IQ of at least 115 but 84% of the population don’t have this:
Historically, an IQ of 115 or higher was deemed to make someone “prime college material.”
That range comprises about 16 per cent of the population.
Since 28 per cent of all adults have BAs, the IQ required to get a degree these days is obviously a lot lower than 115.
Those on the margins of this IQ are getting poor advice to go to college. Murray argues that other occupational and educational choices would serve them better in light of their abilities and likelihood of succeeding at college. Moreover, Murray is keen on replacing college degrees with certification after shorter periods of study such as in the certified public accountants exam.
Murray believes a lot of students make poor investments by going on to College, in part, because many of them don’t complete their degrees:
…even though college has been dumbed down, it is still too intellectually demanding for a large majority of students, in an age when about 50 per cent of all high school graduates are heading to four-year colleges the next fall.
The result is lots of failure. Of those who entered a four-year college in 1995, only 58 per cent had gotten their BA five academic years later.
Murray does not want to abandon these teenagers:
Recognizing the fact that most young people do not have ability and/or the interest to succeed on the conventional academic track does not mean spending less effort on the education of some children than of others.
…Too few counsellors tell work-bound high-school students how much money crane operators or master stonemasons make (a lot).
Too few tell them about the well-paying technical specialties that are being produced by a changing job market.
Too few assess the non-academic abilities of work-bound students and direct them toward occupations in which they can reasonably expect to succeed.
Worst of all: As these students approach the age at which they can legally drop out of school, they are urged to take more courses in mathematics, literature, history and science so that they can pursue the college fantasy. Is it any wonder that so many of them drop out?
To add to that, he is in the Bryan Caplan School: education is often an elaborate former of signalling for many degrees. Murray says that college is a waste of time because:
Outside a handful of majors — engineering and some of the sciences — a bachelor’s degree tells an employer nothing except that the applicant has a certain amount of intellectual ability and perseverance.
Even a degree in a vocational major like business administration can mean anything from a solid base of knowledge to four years of barely remembered gut courses.
If the OECD is to be believed, that not enough people are going to college from lower middle class families, obviously IQ is not one of the constraints on access to college Charles Murray suggested it to be.

The growing strength of the case that education is a form of signalling is a literature that the now famous OECD paper reviewed, found wanting, but did not have time to discuss in the working paper.

Another contemporary theme the OECD paper reviewed, found wanting, but did not have time to discuss is a large number of graduates who end up holding jobs that do not require a university education – going to college:
About 48 per cent of employed U.S. college graduates are in jobs that the Bureau of Labor Statistics (BLS) suggests requires less than a four-year college education.
Eleven per cent of employed college graduates are in occupations requiring more than a high-school diploma but less than a bachelor’s, and 37 per cent are in occupations requiring no more than a high-school diploma.
The proportion of overeducated workers in occupations appears to have grown substantially; in 1970, fewer than one per cent of taxi drivers and two per cent of fire-fighters had college degrees, while now more than 15 per cent do in both jobs
All in all, the OECD has gone into the dragons den by backing the accumulation of human capital as its mechanism to link inequality with lower growth. No matter how you spin it, this linking of lower economic growth to greater inequality through financial constraints on the accumulation of human capital by the lower middle class was a bold hypothesis.

The case for investing more in education is not a slam dunk. Higher education – university or polytechnic – is a rat race that many don’t need to join.The case for the government paying a great many more to join that rat race is rather weak.
Trends in Income Inequality and its Impact on Economic Growth – OECD – is it all about not enough graduates – updated?
11 Dec 2014 Leave a comment
in economics of education, human capital, labour economics, occupational choice, poverty and inequality Tags: educational attainment, human capital, poverty and inequality, student loans, tuition fees
The analysis of the OECD published overnight depends crucially upon how greater inequality reduces the ability of the lower income families to invest in human capital.
The OECD theory of inequality and lower growth is there is a financing constraint because of inequality that reduces economic growth because of less human capital accumulation by lower income families.
Proportion of adults aged 25–64 years with an educational qualification of at least upper secondary level and tertiary level, 1991–2009

In a nutshell, not enough people are going to university. Apparently, the explosion in tertiary educational attendance over the last generation, an increase of about 150% for the adult population aged 25 to 64, was just not good enough.
But what about adults aged 25 to 34, recent graduates, how many of them are there?

There was an explosion of young New Zealanders in the late 1990s who qualified for a degree from a university or diploma from a Polytech.
Under the hypothesis of the OECD about financial constraints retarding the accumulation of human capital among the lower middle class – the fourth decile of the income distribution – even more young New Zealanders should have gone to university or Polytech.
Are there many New Zealanders left who are qualified and suited to tertiary education who do not go?
That is the crux of the OECD position: not enough lower-middle-class New Zealanders go on to obtain higher education and upgrade their skills because of financial constraints in a country was in interest free student loans, means tested student allowances, and the government subsidises for 75% of all tuition fees. Tuition fees only equal 25% of the actual cost and any one can get a student loan to cover this fee.

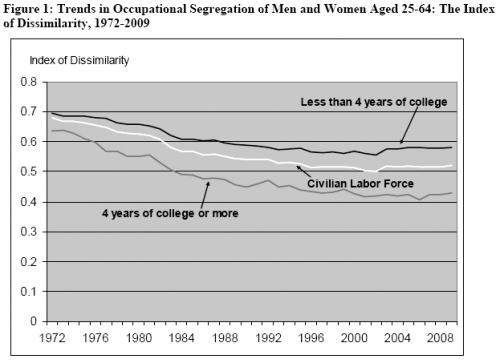
Claudia Goldin’s pollution theory of sex discrimination
10 Dec 2014 Leave a comment
in discrimination, gender, human capital, labour economics, labour supply, occupational choice Tags: Claudia Goldin, co-worker discrimination, credentialisation, employer discrimination, occupational segregation, sex discrimination, signalling
Claudia Goldin argues that it is difficult to rationalise sex segregation and wage discrimination on the basis of men’s taste for women in the same way as discrimination based on race or ethnicity. Goldin developed a pollution theory of discrimination in which new female hires may reduce the prestige of a previously all-male occupation.
When work took more brawn than brain, the distributions of skills and natural talents of men and women were further apart. Women were not as physically strong as men. This counted for more both before the Industrial Revolution and at the height of the Industrial Revolution when most factory work involved a considerable amount of brawn.
As machines substituted for strength, as brain replaced brawn and as educational attainment increased, the distributions of attributes, skills and natural talents narrowed by sex.
Because there is asymmetric information regarding the value of the characteristic of an individual woman, a new female hire may reduce the prestige of a previously all-male occupation.
Prestige is conferred by some portion of society and is based on the level of a productivity-related characteristic (e.g., strength, skill, education, ability) that originally defines the minimum needed to enter a particular occupation. People had to have a minimum amount of the socially prestigious strength or skill before they are hired.
Male fire fighters or police officers, to take two examples, may perceive their occupational status to depend on the sex composition of their police station or firehouse. These occupations are socially prestigious because of the strength and courage of police and fire-fighters. Men in an all-male occupation might be hostile to allowing a woman to enter their occupation even if the woman meets the qualifications for entry.
A reason for this hostility of the existing male members of the occupation is the rest of society may be slow to learn of the qualifications of these female newcomers. Their entry against this background of ignorance in the wider society may downgrade the occupation as still carrying prestigious characteristics such as physical strength. As Goldin explains:
Because they feel that the entry of women into their occupations would pollute their prestige or status in that occupation. Very simply, some external group is the arbiter of prestige and status.
Let’s take an example of firemen, and let’s say we begin not that long ago when there were no women who were firemen—which is why they’re called firemen.
And to become a fireman you have to take a test, lifting a very heavy hose and running up many flights of stairs. And every night, the firemen get off from work and go to the local bar.
Everyone slaps them on the back and says what great brawny guys they are and what a great occupation they are in, and everybody knows that to be a fireman requires certain brawny traits and lots of courage.
But nobody knows when there’s a technological shock to this occupation. And in this case it might be that fire hoses become really light or the local fire department changes the test. There are information asymmetries. But they do note that for this “brawny” characteristic, the median woman is much lower.
So if we observe a woman entering the occupation and we don’t know how to judge women, we’re going to assume that her skills are those of the median woman. Or it may be that we can observe something having to do with her muscles and that may up it a little bit.
But chances are we’re going to assume that some technological shock has happened to this occupation. And so her entry into the occupation is going to pollute it.
Then when they go to the bar, people will say, “oh you’ve got a woman in the firehouse; now fire fighting has become women’s work.” That’s where the pollution comes in.
Union rules also played a role in preventing the entry of women into some occupations
Many occupations have changed sex over time e.g., librarians, bank tellers, teachers, telephone operators, and sales positions. New occupations and industries are less like to be segregated on the basis of sex because they have not developed a social image regarding the prestige of workers.
Occupational segregation came to an end because credentialisation, which spreads information about individual women’s productivities and shatters old stereotypes, can help expunge this pollution of the prestige of specific occupations and jobs both within the industry and in wider society .
The visibility successful women today and in the past may help shatter old stereotypes and increase knowledge about the true distribution of female attributes in this prestigious occupation.

Goldin found that when typists were primarily men, it was claimed that typing required physical stamina so woman need not apply.
But later, when the occupational sex segregation reversed, when typing became a female occupation, it was said that typing required a woman’s dexterity, which men did not have! When I was at school, only women were taught to type.

Trends in Income Inequality and its Impact on Economic Growth – OECD working paper (9 December 2014) – updated
10 Dec 2014 2 Comments
in economic growth, economics, economics of education, human capital, labour supply, occupational choice, politics - Australia, politics - New Zealand, politics - USA, poverty and inequality Tags: financing constraint on education, inequality and economic growth, poverty and inequality, student loans, taxation and the labour supply, top 1%
Figure 1: Estimated consequences of changes in inequality (1985 – 2005) on subsequent cumulative growth (1990-2010)

Drawing on harmonised data covering the OECD countries over the past 30 years, the econometric analysis suggests that income inequality has a negative and statistically significant impact on subsequent growth.
In particular, what matters most is the gap between low income households and the rest of the population.
In contrast, no evidence is found that those with high incomes pulling away from the rest of the population harms growth.
The paper also evaluates the “human capital accumulation theory” finding evidence for human capital as a channel through which inequality may affect growth.
Analysis based on micro data from the Adult Skills Survey (PIAAC) shows that increased income disparities depress skills development among individuals with poorer parental education background, both in terms of the quantity of education attained (e.g. years of schooling), and in terms of its quality (i.e. skill proficiency).
Educational outcomes of individuals from richer backgrounds, however, are not affected by inequality.
via Trends in Income Inequality and its Impact on Economic Growth – Papers – OECD iLibrary.
The OECD analysis published overnight in Paris suggest that the increase in equality in New Zealand the late 1980s is still scarring economic growth today by about 15 percentage points in lost cumulative economic growth.
The analysis of the OECD published overnight depends crucially upon how greater inequality reduces the ability of the lower income families to invest in human capital:
The evidence strongly suggests that high inequality hinders the ability of individuals from low economic background to invest in their human capital, both in terms of the level of education but even more importantly in terms of the quality of education.
The OECD theory of inequality and lower growth is there is a financing constraint because of inequality that reduces economic growth because of less human capital accumulation by lower income families.
This is interesting because in 2002, with Pedro Carneiro, James Heckman showed that lack of credit is not a major constraint on the ability of young Americans to attend college. They found that credit constraints prevent, at most, 4% of the U.S. population from attending. Credit constraints is weakening as a rationale for a lack of an accumulation of human capital, and can be easily solved.

The OECD is putting a lot of their growth inequality nexus eggs in one basket. That student loans and other government interventions are not closing credit constraints on financing higher education.
To add to that basket , they are placing a lot of weight in human capital as a driver of growth, and in New Zealand’s case, of technology absorption, which is a main foundation of economic growth in New Zealand. The evidence that human capital is a key contributor to higher economic growth is weakening ruck rather than strengthening.
The trend rate of productivity growth did not accelerate over the 20th century despite a massive rise in investments in human capital and R&D because of the rising cost of discovering and adapting new technological knowledge. The number of both R&D workers and highly educated workers increased many-fold over the 20th century in New Zealand and other OECD member countries including the global industrial leaders such as the USA, Japan and major EU member states.
Higher education has been free for the low income families for several generations. Student loans are readily available. It is hard to believe that such a readily solvable problem is a major source of inequality and lower growth.
Cross-country differences in total factor productivity are due to differences in the technologies that are actually used by a country and the degree in the efficiency with which these technologies are used. Differences in total factor productivity, rather than differences in the amount of human capital or physical capital per worker explain the majority of cross-country differences in per capita real incomes (Lucas 1990; Caselli 2005; Prescott 1998; Hall and Jones 1999; Jones and Romer 2010).
Differences in the skills of the individual worker or in the total stock of human capital of all workers in a country cannot explain cross national differences in value added per worker at the industry level.
- The USA competes with Japan for productivity leadership in many manufacturing industries.
- The Japanese services sector productivity can be as little as a one-third of that of the USA.
- Japanese labour productivity is almost twice Germany’s in producing automobiles and is better that Germany by a large margin for many other manufactured goods.
- The USA is uniformly more productive in services sector labour productivity. For example, British, French and German telecom workers were 38 to 56 per cent as productive as their American counter-parts.
The USA, Japan, France, the UK and Germany all have relatively well-educated, experienced and tested labour forces. For example, the 1993 McKinsey’s study inquired into the education and skills levels of Japanese and German steel workers. Comparably skilled German steel workers were half as productive as their Japanese counterparts (Prescott and Parente 2000, 2005).
As for the source of the growing income inequality, there is a long literature dating back 25-years arguing that skill-biased technological change is increasing the returns to investing in education
Important is the OECD conclusion that inequality in terms of the rich getting richer does not harm growth. To make sure I have not misquoted them , I quote once again from their abstract, where the OECD summarises its own findings:
Drawing on harmonised data covering the OECD countries over the past 30 years, the econometric analysis suggests that income inequality has a negative and statistically significant impact on subsequent growth.
In particular, what matters most is the gap between low income households and the rest of the population.
In contrast, no evidence is found that those with high incomes pulling away from the rest of the population harms growth.
That conclusion of the OECD almost saves me from having to go on about how inequality has not increased in New Zealand for the last 20 years, see figure 2, and that the top 1% have not increased their share of income in recent decades – see figure 3. The fact that the rich can get richer without harming the poor is an important conclusion that will surely not be reported by the media.
Figure 2: Gini coefficient New Zealand 1980-2015

Figure 3: Top 1% income shares, USA, New Zealand and Australia, 1970-2012

Another inconvenience for the OECD is the last major increase in Gini coefficient in New Zealand was followed by a 15 year economic firm – see figures 2 and 4.
Figure 4: Real GDP per New Zealander and Australian aged 15-64, converted to 2013 price level with updated 2005 EKS purchasing power parities, 1956-2013

The NZ top 1% share has been steady at 8-9% since the mid-1990s see figure 4; the top 1%’s share rose strongly in the USA in recent decades, from 13% in the mid-1980s to 19% in 2012.
The Occupy crowd blame everything from the global financial crisis to a bad environment on growing inequality and the growing riches of living top 1%. Such an argument has no foundation in fact in New Zealand. The last major increase in Inequality was a long time ago in New Zealand.
The OECD is also rather casual about how policies to redistribute wealth and increasing incomes. While Western Europe is diverse, as a group, the higher taxes in the European Union reduced incentives to work. Employment as a percentage of the population has been consistently lower in Western Europe than in the USA since the 1950s, with an average employment rate gap of 10 percentage points over 1980-2007.
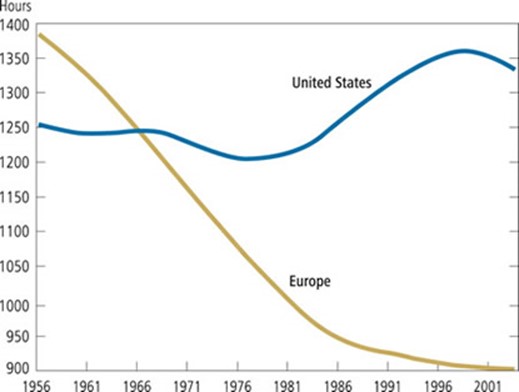
Large increases in taxes on income from labour since the 1970s, enhanced incentives for retire early, and the interaction of generous employment insurance with the larger skill losses among workers displaced by the greater economic turbulence since 1980 all acted to reduce both real GDP and hours worked per week per working age person by up to a third in Western Europe as compared to the USA since the 1970s (Prescott 2004, 2007; Rogerson 2006, 2008; Ohanian et al. 2008; Ljungqvist and Sargent 1998, 2007, 2008). For example, Ohanian, Rao and Rogerson 2008 in “Work and taxes: allocation of time in OECD countries” found that:
- A steep decline in average hours worked per adult and large variations across OECD member countries in the magnitude of this decline.
- Changes in labour taxes accounted for a large share of the trend differences.
- Countries with high tax rates devote less time to market work, but more time to home activities, such as cooking and cleaning.
- This reallocation of time from market work to home work is much stronger for females than for males.
Europeans pay more taxes, work fewer hours per year, have longer vacations, retire sooner, and invest less in human capital in an era in which trends in technology have significantly increased the demand for skilled workers, more innovation, more intense competition and greater entrepreneurial alertness. In The Impact of Labor Taxes on Labor Supply: An International Perspective (AEI Press, 2010) Rogerson finds that:
• a 10 percentage point increase in the tax rate on labour leads to a 10 to 15 per cent decrease in hours of work.
• Even a 5 per cent decrease in hours worked would mean a decline in labour output equating to a serious recession.
• While recessions are temporary, permanent changes in government spending patterns have long-lasting repercussions.
• Although government spending provides citizens with important benefits, such benefits must be weighed against the disincentive effects of increased labour taxes.
• Policymakers who fail to account for the decrease in labour output risk expanding government programs beyond their optimal scale.
Robert Lucas estimated in 1990 that eliminating all taxes on income from capital would increase the U.S. capital stock by about 35% and consumption by 7%.
Hans Fehr, Sabine Jokisch, Ashwin Kambhampati, and Laurence J. Kotlikoff (2014) found that eliminating the corporate income tax completely would raise the U.S. capital stock (machines and buildings) by 23%, output by 8% and the real wages of unskilled and skilled workers each by 12%.
In summary, this one paper by the OECD, which is a working paper makes profound conclusions about taxation and economic growth that contradict a large literature based on the lack of statistical significance of coefficients in the OECD’s regressions.
More fundamentally, linking lower economic growth to inequality through credit constraints on the human capital accumulation of the lower middle class is a weak reed to hang its argument. Human capital is not a good explanation of variations in growth across time or between countries.
What happened to income inequality in New Zealand in the late 1980s is not a credible explanation for lower growth 30 years later. Lower economic growth because of greater inequality is certainly an easy problem to solve if all that is required is more action on the financing constraint on human capital accumulation.
Is welfare dependence optimal for whom – part 3: abatement free income thresholds and labour supply
08 Dec 2014 Leave a comment
in labour economics, labour supply, occupational choice, welfare reform Tags: Labour leisure trade-off, welfare reform
Another welfare reform is a modest income threshold below which benefits are not abated. This is low for unemployment and sickness beneficiaries and higher for domestic purposes and invalid beneficiaries.
The idea behind abatement-free income thresholds is to not penalise part-time work among sole mothers and encourage the unemployed and sick to return to full-time work.
The Figure 1 shows that an increase in the benefit abatement threshold has similar ambiguous net labour supply effects to a lowering of welfare benefit abatement rates.
Figure 1: Impact of abatement thresholds on labour supply

- Arrow 1 in figure 1 shows that some who were not currently working will now find working part-time a more attractive option because of the introduction of a benefit abatement-free threshold. Their take-home pay is higher although they enjoy less leisure time.
- Arrow 2 in figure 1 shows that some part-time workers will reduce their working hours because working less and claiming the benefit clearly increases both their take-home pay and allow for more leisure time.
- Arrow 3 in figure 1 shows that workers who work a relative high number of hours per week for a relative low wage will reduce from full-time to part-time working hours because of a revised leisure-labour trade off now makes a somewhat lower take-home pay worthwhile because of increased leisure time.
- No welfare recipients leave the welfare system but some join it because of the introduction or increase in the abatement-free income threshold.
The net labour supply effects of a higher benefit abatement-free threshold are ambiguous because the reduced hours of those already in work offsets the labour force participation of those previously not in work.
Whether net labour supply increases or decreases depends on the relative numbers of individuals at different points on the budget constraint working full-time, not working and working part-time and on the magnitudes of their responses. Some will stay as they were either working full-time, not working or working part-time.
The objective of reducing welfare dependency by encouraging part-time work by those not working has important unintended adverse consequences for the labour supply and welfare dependency of those currently working part-time and full-time on low wages.
A common result of welfare reforms that increase abatement thresholds or reduce abatement rates is that no welfare recipients leave the welfare system but some join it. Welfare dependency is not reduced by financial incentives that increase the generosity and the availability of welfare benefits.
The labour supply effects of welfare reforms that increase benefit abatement thresholds or reduce benefit abatement rates are ambiguous because the reduced working hours of existing workers offsets the hours worked by those not employed prior to the reform. A further complexity is that encouraging part-time work channels beneficiaries into low paid jobs that offer little training and other human capital benefits.
In summary, an increase in the benefit abatement-free income thresholds for welfare recipients has the following effects:
- not all welfare recipients will respond to a higher abatement-free income threshold by supplying more labour;
- those welfare recipients who do respond to a higher abatement-free income are better-off and supply more labour and take-home more pay;
- the increase in labour supply is in part-time work by beneficiaries earning income up to the higher abatement-free income threshold;
- No welfare recipient leaves the welfare system – those welfare recipients who respond to this welfare reform continue to collect their full welfare benefit and work a few more hours each week.
While reforming the welfare system is intended to change the labour market behaviour of welfare recipients, it also has unintended consequences on individuals who are not collecting welfare benefits.
An increase in the exemption level for earned income affects the labour market behaviour of someone who is not receiving welfare benefits has the following effects:
- prior to the increase in the abatement-free threshold, the individual is best off by working part-time or full-time and not collecting welfare or even being eligible to collect welfare benefits; and
- after an increase in the benefit abatement-free income threshold, a worker is better-off by supplying less labour and collecting a full welfare benefit, which raises their total income.
Permitting welfare recipients to keep larger amounts of income without losing any of their welfare benefits will attract more workers into the welfare system. Some workers will find that they are better-off by joining the welfare system and switch from full-time work to being a welfare recipient who works part-time (up to the new higher exemption level). The cost of the welfare programme increases, there are more welfare recipients, and no welfare recipient loses any benefits.
All welfare recipients who increase their labour supply up to the new higher exemption level (and lower abatement rates) and all workers who switch to the welfare system will be better-off.
The effect of the quantity of labour supplied is ambiguous: some old welfare recipients will increase their labour supply up to the new higher abatement-free threshold (probably by a relatively small amount) but new welfare recipients will decrease their labour supply (probably by a relatively large amount) as they move from full-time work to part-time work on welfare.
The overall effect of changes in benefit abatement regimes depends on the number of old and new welfare recipients and the size of the labour supply change for each.
- The quality of labour supplied will deteriorate as some full-time workers switch to welfare and work part-time; part-time workers generally have less attachment to the labour force and tend to invest less in human capital to up-grade their labour market skills.
- High-productivity workers are working fewer hours while lower-productivity workers work more hours.
If the objective is to reduce the number of people on welfare by moving some welfare recipients (those who are able to work) into work, increasing abatement free income thresholds or lowering abatement rates are not the solution. Both options increase the number of people on welfare.
A reduction in the amount of welfare benefits will reduce the number of people on welfare, reduce the cost of the welfare programme, increase the supply of labour, increase the number of full-time workers relative to part-time workers but make all current welfare recipients worse-off and risks providing inadequate income support to those who are unemployable.
The blogs so far
part-one-the-labour-leisure-trade-off-and-the-rewards-for-working
part-two-the-labour-supply-effects-of-welfare-benefit-abatement-rate-changes
part-3-abatement-free-income-thresholds-and-labour-supply
part-4-in-work-tax-credits-and-labour-supply
part-5-higher-abatement-rates-and-labour-supply
The Economic Case Against Majoring in Fun Things – The Atlantic
03 Dec 2014 Leave a comment
in economics of education, human capital, occupational choice, politics - USA Tags: human capital, Returns to education


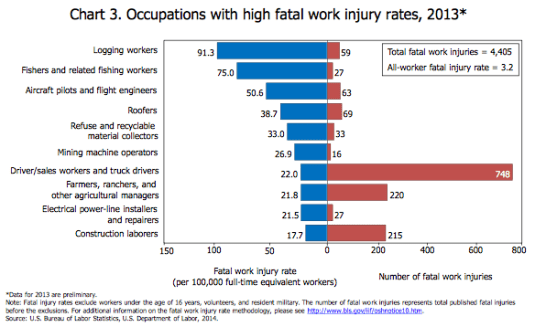
What occupations are the most dangerous?
29 Nov 2014 Leave a comment
in health and safety, labour economics, occupational choice Tags: health and safety, labour economics

Some economics of zero hours contracts – part 2: the fixed costs of employment and minimum hours constraints
27 Nov 2014 1 Comment
in labour economics, labour supply, occupational choice Tags: fixed costs of employment, labour economics, minimum hours constraints, Walter Oi, zero hours contracts
A good way to start the second part of my discussion of zero hours contracts is to focus on the economic rationale as to why they should not exist because of the fixed costs of employment. Under zero-hours contracts, employees agree to be available for work as and when it is required.

The fact that zero hours contracts do exist, and are growing in popularity, and many workers freely choose to sign onto these contracts, suggest they are an important labour market innovation with the gains of the shared between employers in terms of temporary above normal profits and higher wages.
Employers incur fixed costs of employment when they recruit and train new employees. These recruits must be expected to stay long enough to work sufficient hours for the firm to expect to recover these investments.[Oi (1962, 1983a, 1990), Idson and Oi (1999), Hutchens (2010), Hutchens and Grace-Martin (2006)]
These costs are fixed costs because they do not vary with how many hours the employee works or with how long an employee stays with their employer. On-going supervision, office space and other overheads can increase with the number of employees, not the hours they work per week. These fixed employment costs must be recouped over the expected job tenure of the employee with the firm.
Employers will not hire an additional worker unless they anticipate recovering the costs of doing do including fixed employment costs and other overheads. Hiring one more worker for 40 hours per week is cheaper than hiring two workers to work 20 hours per week each. These two part-timers would about double the recruitment and training costs to secure the same total additional supply of hours worked per week. Profits are a small share of the revenue earned on selling the output of each worker.

A small change in non-wage labour costs can have a large effect on profit margins. One full-time employee is cheaper than two part-timers because of fixed employment costs unless hourly wages paid to the two part-times adjust to offset the additional overheads of recruiting them both.
Fixed employment costs are higher when filling higher skilled vacancies because more time and resources are spent on recruiting more skilled workers (Oi 1983a; Idson and Oi 1999). Employers interview for longer and interview more applicants to find the best possible match. The applicants for more skilled vacancies have more diverse backgrounds and their jobs are more important to the success of the firm. Employers will invest more in training recruits to more skilled vacancies (Oi 1983a, 1983b, 1988, 1990; Hutchens and Grace-Martin 2004, 2006).
Useful estimates of the fixed costs of employment are rare. An illustration of the size of the fixed costs of employment is provided by Parsons (1987). He found that the investments of an employer he studied per employee increases rapidly with skill levels. The U.S. dollar investments by the manufacturing employer he studied were $911 for a least skilled worker, $5,715 semi-skilled workers, $13,353 for first-line managers, $53,413 for middle line managers, and $113,503 for top level managers (Parsons 1987).
Recouping overheads with minimum hours constraints
Fixed employment costs can explain minimum hours constraints and many other labour market puzzles. Examples are occupational differences in the stability of earnings, the uneven incidence of unemployment by skill levels in recessions, higher wages in large firms, the persistence of differential job turnover rates, overtime, joint investments in specific human capital, seniority pay and seemly discriminatory hiring and firing policies (Oi 1962, 1983a, Idson and Oi 1999).
The puzzle we are attempting to explain here is despite the fixed cost of recruiting and training an employee, the employer makes no commitment to employee this new recruitment for a minimum number of hours per week.
When a zero hours contract is in place, how is the employer to recover the costs of recruiting the employee, and the cost of initial training and orientation to the job where productivity is low?
Wages and the fixed costs of employment sum to the labour costs that their employers seeks to recoup from sale of their outputs. The higher are the fixed costs of employment, the longer are the hours that the employer will prefer the employee to work to generate enough revenue to recoup investments in recruitment and training (Oi 1962, 1983a, 1987; Hutchens and Grace-Martin 2004, 2006).
An employer often welcomes longer hours for employees with high fixed employment costs. The added output net of overtime paid contributes towards the recovery of investments in their recruitment and training (Oi 1962, 1988).
The more hours worked, the more hours over which can be spread the fixed costs of employment. When fixed employment costs are high, paying existing employees for longer hours is less expensive relative to hiring and training additional workers.
This cost differential can lead to a minimum hours constraint and the preference of employers for overtime over recruitment of more workers (Oi 1962, 1983a, 1990; Hutchens and Grace-Martin 2004, 2006).
Part-time jobs usually pay disproportionately less per hour than many full-time jobs (Hirsch 2000, 2005). Part-time workers can be more costly per hour than equally productive and qualified full-timers because their fixed costs of employment are spread over fewer total hours.
Early empirical studies of part-time work, after accounting for skill, occupation, age and other differences, found a part-time wage penalty of about 10 per cent, but more recent studies were unable to find a large part-time wage penalty (Hirsch 2000, 2005).
The more recent studies have found a small part-time wage gap for men but no gap for women after accounting for skill, occupational, age and other differences, and no much of a wage penalty for switches to or from part-time to full-time jobs in the same occupation or industry. [Rogers (2004), Booth and Wood (2006), Hirsch (2000, 2005, 2008), Manning and Petrongolong (2008) and Mumford and Smith (2009).
A major empirical finding about part-time jobs is that there are significant occupational and skills differences between full-time and part-time jobs (Hirsch 2000, 2005). These differences explain most of what are otherwise large raw gaps in hourly wages. Part-time jobs pay less because they usually require less human capital (Hirsch 2005).
Workers who have invested more extensively in human capital usually seek full-time jobs to work sufficient hours over their careers to recoup their investments in education and training.
There are part-time jobs that pay wage premiums (Hirsch 2005). These are limited to industries with seasonal and other short spikes in labour demand.
When product demand is fluctuating, full-times can be more costly because they are frequently idle. Shops, supermarkets and food outlets are examples of firms with within day highs and lows in sales and who profit from hiring part-timers. The cost savings induce these employers to pay a premium to find part-time workers.
Another reason for the lower hourly wages in part-time jobs is daily labour productivity of every workers is linked to the length of their working day. There are starting-up, planning, co-ordination and self-organisation tasks at the beginning of every working day before anything can be produced (Barzel 1973). Part-timers will produce relatively less per working day because an equally as long a part of their day is lost in starting-up costs. These fixed costs of starting the work day must be recouped over a shorter working day.
One conclusion that can be drawn here, in terms of zero hours contracts, is they should be confined to industries and jobs where the fixed cost of recruiting and training employees is low.
The firms that offer of zero hours contracts are likely to be employers subject to peaks and surges in product demand. Not surprisingly, zero hours contracts were pioneered by the retail sector, and in particular the food sector.

What can be said with some confidence is zero hours contracts are unlikely in jobs where workers must be provided with a dedicated workspace and other dedicated work tools. These dedicated resources would not be in use if the particular employee is not called in to work.
Workers on zero hours contracts must be interchangeable in terms of skills and experience and have no need to debrief each other as they change shifts. Starting-up, planning, co-ordination and self-organisation tasks at the beginning of each working day must be relatively low.
Fixed costs of employment increase with recruitment efforts and specialised training and the time spent supervising, co-ordinating and monitoring employees. Employers that hire lower skilled workers, offer less training, and which assign simple and easy to monitor tasks will incur lower fixed costs of employment (Hutchens and Grace-Martin 2004, 2006; Oi 1983a, 1983b).
Minimum hours of work constraints are more likely for skilled recruits and for those employees who have benefited from employer funded training [Oi (1962, 1983a, 1983b, 1988, 1990) and Hutchens and Grace-Martin (2004, 2006)]. Employers will invested more in finding the more skilled recruits because these workers have more specialised and they have varied backgrounds (Oi 1983, 1990, 1992; Idson and Oi 1999).
The more that is invested in training specialised to the firm, the more in fixed costs of employment that the employer must later recoup as additional employee output (Oi 1982, 1983a, 1987, 1988; Hutchens and Grace-Martin 2006). Employers are less likely to agree to requests for reduced from these types of trained employees unless their hourly pay reduction is large enough to keep recovering the fixed costs of their employment.
Employers will profit from structuring their recruiting choices and retention incentives in their employee compensation packages so that average job tenures at least break-even on investments in recruitment, training and supervision.
Longer staying employees will balance out the losses on those that quit early. Employers recoup investments in training by sharing some but not all of the added returns from the specialised training with the employee (Oi 1962, 1983a; Becker 1975). This wage premium over what the worker could earn elsewhere is a staff retention incentive that facilitates a long-term employment relationship. The longer is this employment relationship, the better are the chances for the employer of recovering fixed employment costs (Oi 1962, 1987; Becker 1964).

An employer with major upfront investments in recruitment and specialised training and from overheads from the co-ordination and management of staff has a good incentive to recruit and retain employees on the condition that they work a minimum number of hours per week. The fixed costs of employment increase with the number of workers employed rather than the number of hours they work. The fixed costs of employment for a part-timer and a full-timer will be similar.
The foregoing discussion suggests that zero hours contracts will be confined to jobs where recruitment costs are low, and training specialised to the job and firm are low. The recruit will be expected to come job ready with generalised training mobile across many jobs within their occupation and sector.

Recent Comments