One group with negative net tax liability is low- to middle-income households with dependent children. For example, single-earner families with two children can earn up to around $60,000 pa before they pay any net tax.
Around half of all households with children receive more in welfare benefits and tax credits than they pay in income tax.
Director’s Law in New Zealand?
14 Aug 2015 Leave a comment
in applied price theory, income redistribution, labour economics, politics - New Zealand, poverty and inequality, Public Choice, public economics Tags: child poverty, Director's Law, family poverty, family tax credits, welfare state
@metiria @NZGreens 20,000 drop in children in hardship in 2014
13 Aug 2015 Leave a comment
in applied welfare economics, economic history, income redistribution, labour economics, politics - New Zealand, poverty and inequality, Public Choice, welfare reform Tags: child poverty, family poverty, family tax credits, Leftover Left, New Zealand Greens, Twitter left
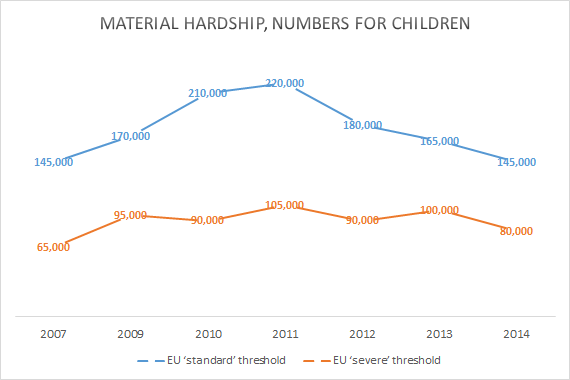
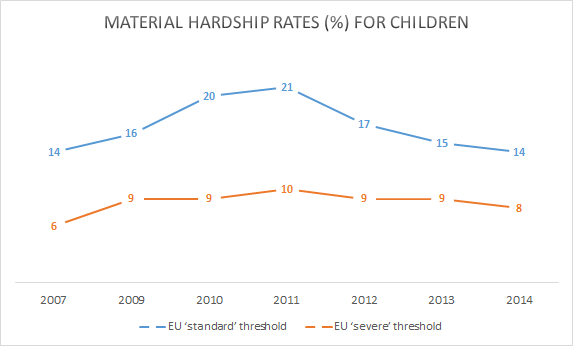
The material hardship measure shows a falling child material hardship rate using a threshold equivalent to the ‘standard’ EU level, down from a peak of 21% immediately after the GFC to 14% in 2014.
Using the more severe threshold, there was a slight rise through the GFC to 10% and a small fall to 8%, the level it was at before the GFC.
Source: Bryan Perry, Household Incomes in New Zealand: trends in indicators of inequality and hardship 1982 to 2014 – Ministry of Social Development, Wellington (August 2015), p. 133.
Maori and Pasifika economic progress since 1988
13 Aug 2015 Leave a comment
in applied welfare economics, discrimination, economic history, labour economics, politics - New Zealand, poverty and inequality Tags: Maori economic development
From a longer-term perspective, all groups showed a strong rise from the low point in the mid 1990s through to 2010. In real terms, overall median household income rose 47% from 1994 to 2010: for Maori, the rise was even stronger at 68%, and for Pacific, 77%.
These findings for longer- term trends are robust, even though some year on year changes may be less certain. For 2004 to 2010, the respective growth figures were 21%, 31% and 14%.
Source: Bryan Perry, Household Incomes in New Zealand: trends in indicators of inequality and hardship 1982 to 2014 – Ministry of Social Development, Wellington (August 2015), Table D6.
@WJRosenbergCTU A brief history of rising equality in New Zealand
13 Aug 2015 Leave a comment
in applied price theory, applied welfare economics, economic history, economics of media and culture, income redistribution, labour economics, politics - New Zealand, poverty and inequality, Public Choice Tags: capitalism and freedom, Leftover Left, The Great Enrichment, The Great Fact, top 1%, Twitter left
Bill Rosenberg at the Council of Trade Unions was good enough to tweet a Treasury chart that shows next to no increases in inequality in New Zealand for at least 20 years.
A brief history of inequality-from Treasury paper Fig4. Note Employment Contracts Act,GST,income tax,benefit cuts,WFF http://t.co/y4w3cUsgjD—
Bill Rosenberg (@WJRosenbergCTU) June 27, 2015
Inequality in both market and disposable incomes has been stable for a good 20 years, as the above tweet shows, while inequality in consumption has been falling. To back this interpretation of mine up, coincidentally today Bryan Perry published his annual report on income and inequality under the banner of the Ministry of Social Development.
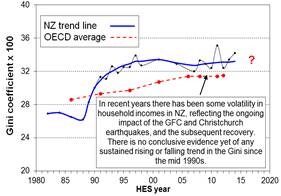
His report showed that there be no significant increase in New Zealand in at least 20 years.
@metiria @NZGreens child poverty is driven by housing unaffordability – by Green opposition to RMA reform
13 Aug 2015 1 Comment
in applied welfare economics, economic history, economics of regulation, labour economics, politics - New Zealand, poverty and inequality, urban economics Tags: antimarket bias, child poverty, expressive voting, family poverty, green rent seeking, housing affordability, land use planning, Leftover Left, New Zealand Greens, NIMBYs, rational ignorance, rational irrationality, RMA, zoning
#moreinclusivenz @povertymonitor Killer graphs & #infographics by NZ Children's Commissioner. Shameful content, NZ http://t.co/mG987C5kh0—
Isabella Cawthorn (@fixiebelle) July 26, 2015
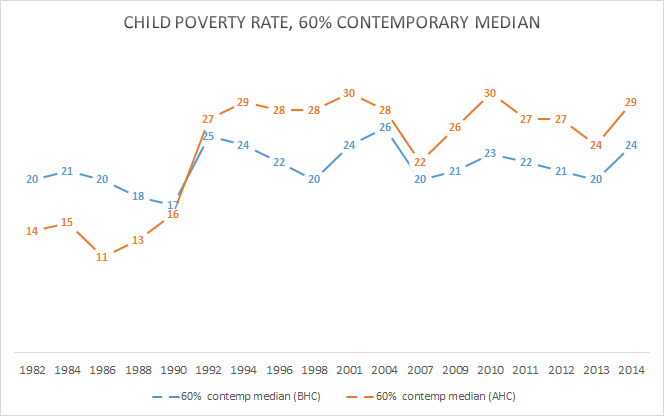
Nothing much has happening to child poverty before housing costs in New Zealand since the early 1980s. It is after housing costs poverty that is crucifying the children in New Zealand.
Source: Bryan Perry, Household Incomes in New Zealand: trends in indicators of inequality and hardship 1982 to 2014 – Ministry of Social Development, Wellington (August 2015), Table F6 and table F7.
An economy that is not working for all of us, is simply not working. http://t.co/zZu0LOy7ED—
Green Party NZ (@NZGreens) August 13, 2015
From HES 2013 to HES 2014 median household income rose 5% in real terms (5% above the CPI inflation rate)…
On the AHC moving line measures, child poverty rates in HES 2014 are around the same as their peak after the GFC. A good amount of the rise from HES 2013 to HES 2014 is due to the large rise in the BHC median, as noted above, rather than a change in the numbers in low income per se.
The parties that oppose measures to increase the supply of land and reduce the cost of housing through reform of the Resource Management Act and its many restraints on the supply of land are the New Zealand Labour Party and New Zealand Greens.
Children's views on poverty #childpovertynz occ.org.nz/assets/Uploads… http://t.co/wZHJ19QcpN—
Child Poverty NZ (@povertymonitor) September 08, 2015
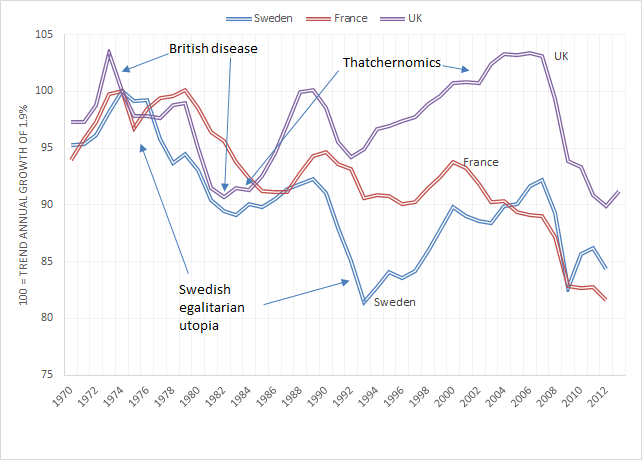
The impact of welfare states on life expectancy
07 Aug 2015 Leave a comment
in applied welfare economics, fiscal policy, labour economics, politics - Australia, politics - New Zealand, politics - USA, poverty and inequality, welfare reform Tags: Denmark, Finland, life expectancies, Norway, Sweden, welfare state
New from @iealondon: Scandinavian success is not due to high taxes and welfare spending. iea.org.uk/in-the-media/p… http://t.co/QVH566KNtV—
IEA (@iealondon) July 07, 2015
The living wage as an application of Director’s Law
30 Jul 2015 Leave a comment
in income redistribution, labour economics, minimum wage, politics - Australia, politics - New Zealand, politics - USA, population economics, poverty and inequality, Public Choice, rentseeking Tags: British politics, Director's Law, expressive voting, living wage, rational ignorance, rational irrationality
OBR's idea of who will benefit from National Living Wage http://t.co/ztxfW906Gg—
James Bartholomew (@JGBartholomew) July 08, 2015
Digital poverty in America is less than 3% for young adults
29 Jul 2015 Leave a comment
in economic history, economics of media and culture, politics - USA, poverty and inequality Tags: 10-90 lag, Digital poverty, technology diffusion, The Great Enrichment
15% of Americans don’t use the internet. Who are they? pewrsr.ch/1HYkSgM http://t.co/vL6uRuz5iK—
PewResearch FactTank (@FactTank) July 28, 2015


Recent Comments