Gambling for Redemption and Self-fulfilling Debt Crises in the Eurozone
29 Jun 2015 Leave a comment
in business cycles, currency unions, economic growth, Euro crisis, fiscal policy, global financial crisis (GFC), international economic law, international economics, macroeconomics Tags: game theory, Greece, Patrick Kehoe, sovereign default
ATM line inside the Greek Parliament
28 Jun 2015 Leave a comment
in currency unions, Euro crisis Tags: bank panics, bank runs, Greece, sovereign defaults
ATM line inside the Greek Parliament –> Περισσότεροι βουλευτές στο ΑΤΜ παρά στη συνεδρίαση protothema.gr/politics/artic… http://t.co/JeusE2pgUu—
Fabrizio Goria (@FGoria) June 27, 2015
Tom Sargent keynote address Emergency Economic Summit for Greece (1 June 2015)
26 Jun 2015 Leave a comment
in comparative institutional analysis, constitutional political economy, currency unions, Euro crisis, fiscal policy, macroeconomics, monetary economics Tags: EU, Euroland, Greece, sovereign borrowing, sovereign defaults, Thomas Sargent
Who are the members of Euroland?
17 Jun 2015 Leave a comment
in currency unions, Euro crisis, macroeconomics Tags: Euroland, European Union
Since today is Europe Day, a look at which countries have and haven't adopted the Euro brilliantmaps.com/eurozone2015/ http://t.co/N8tGhBe8eN—
Brilliant Maps (@BrilliantMaps) May 09, 2015
The Spanish economic recovery compared
10 Jun 2015 Leave a comment
in business cycles, currency unions, economic growth, Euro crisis, global financial crisis (GFC), great recession, macroeconomics Tags: Eurosclerosis, France, Germany, Italy, Spain
Spain's economic growth is being touted as a success story. Don't tell the Spaniards: on.wsj.com/1M45yzI http://t.co/pm4DAd1qkF—
Nick Timiraos (@NickTimiraos) June 03, 2015
Maybe joining Euroland isn’t that bad after all
08 May 2015 Leave a comment
in business cycles, currency unions, development economics, Euro crisis, global financial crisis (GFC), growth miracles, international economics, macroeconomics, monetary economics Tags: Eastern Europe, Euroland, European Union, Eurosclerosis, transitional economies
#Dailychart: How "New Europe" has fared on its tenth birthday econ.st/1fwOg33 http://t.co/AvkCqHmzAf—
The Economist (@ECONdailycharts) May 01, 2014
Real GDP Portugal, Italy, Greece and Spain (PIGS) – 1955 to 2013
06 May 2015 Leave a comment
in currency unions, economic growth, Euro crisis, macroeconomics Tags: Eurosclerosis, Greece, Italy, PIGS, Portugal, Spain
Figure 1: Real GDP per Portuguese, Italian, Greek and Spaniard aged 15-64, converted to 2013 price level with updated 2005 EKS purchasing power parities, 1955-2013

Source: Computed from OECD Stat Extract and The Conference Board, Total Database, January 2014, http://www.conference-board.org/economics
Figure 2: Real GDP per Portuguese, Italian, Greek an Spaniard aged 15-64, converted to 2013 price level with updated 2005 EKS purchasing power parities, 1.9 per cent detrended, 1955-2013

Source: Computed from OECD Stat Extract and The Conference Board, Total Database, January 2014, http://www.conference-board.org/economics
Note that a flat line in figure 2 is growth in real GDP for that year at 1.9%; a rising line is above trend rate of growth; and a falling line is below trend rate growth for that year.
The PIGS had three distinct phases in their post-war growth. Rapid growth up until about the mid 70s. Growth at about the trend rate of growth of 1.9% until about 2000 in the case of Italy. This was followed by slow decline then rapid decline after the global financial crisis.
Figure 3: Real GDP per Italian aged 15-64, converted to 2013 price level with updated 2005 EKS purchasing power parities, 1.9 per cent detrended, 1955-2013

Source: Computed from OECD Stat Extract and The Conference Board, Total Database, January 2014, http://www.conference-board.org/economics
Greece had a different story with the long decline between 1979 to 1995. This was followed by 10 good years of growth followed by sharp decline with the onset of the global financial crisis.
Figure 4: Real GDP per Greek aged 15-64, converted to 2013 price level with updated 2005 EKS purchasing power parities, 1.9 per cent detrended, 1955-2013

Source: Computed from OECD Stat Extract and The Conference Board, Total Database, January 2014, http://www.conference-board.org/economics
Portugal was in a boom In the 1980s and 1990s followed by what borders on a depression since about 2000.
Figure 5: Real GDP per Portuguese aged 15-64, converted to 2013 price level with updated 2005 EKS purchasing power parities, 1.9 per cent detrended, 1955-2013

Source: Computed from OECD Stat Extract and The Conference Board, Total Database, January 2014, http://www.conference-board.org/economics
Spain had a pretty good run from the mid-1980s until the eve of the global financial crisis with somewhat above trend growth after a period of decline in the 1970s.
Figure 6: Real GDP per Spaniard aged 15-64, converted to 2013 price level with updated 2005 EKS purchasing power parities, 1.9 per cent detrended, 1955-2013

Source: Computed from OECD Stat Extract and The Conference Board, Total Database, January 2014, http://www.conference-board.org/economics
Post-war reconstruction then Eurosclerosis – Germany, Italy and France 1950-2013
04 May 2015 Leave a comment
in currency unions, economic growth, economic history, Euro crisis, macroeconomics Tags: Eurosclerosis, France, Germany, Italy, post-war reconstruction
Figure 1: Real GDP per German, Italian and French aged 15-64, converted to 2013 price level with updated 2005 EKS purchasing power parities, 1950-2013

Source: Computed from OECD Stat Extract and The Conference Board, Total Database, January 2014, http://www.conference-board.org/economics
Figure 2: Real GDP per German, Italian and French aged 15-64, converted to 2013 price level with updated 2005 EKS purchasing power parities, 1.9 per cent detrended, 1950-2013

Source: Computed from OECD Stat Extract and The Conference Board, Total Database, January 2014, http://www.conference-board.org/economics
A flat line in figure 2 means real GDP growth of 1.9% per year, which is trend growth. A rising line means growth that is higher than trend rate; a falling line means growth at below the trend rate of 1.9%. 1.9% is the trend rate of growth of the USA in the 20th century. Figure 2 shows that:
- Germany, Italy and France all boomed until the mid-1970s;
- the French and German economies went into a long-term decline from that time; and
- the Italian economy stopped growing at anything more than the trend rate of growth between the mid-1970s and the mid-1990s and then went into a sharp decline that borders on the depression.
Roberts Solow on the British disease and Eurosclerosis
21 Mar 2015 Leave a comment
in currency unions, economic growth, economics of regulation, Euro crisis, fiscal policy, job search and matching, labour economics, labour supply, macroeconomics Tags: British disease, Euroland, European Union, Eurosclerosis, Robert Solow

HT: Brad Delong
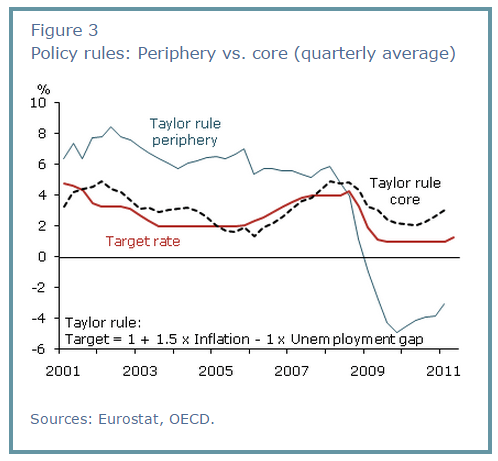
Monetary Policy When One Size Does Not Fit All
15 Mar 2015 Leave a comment
in currency unions, Euro crisis, inflation targeting, macroeconomics
When members of a monetary union are experiencing different macroeconomic conditions, a single policy rate is unlikely to fit circumstances in all countries. Currently, the ECB’s target rate seems to be in line with a Taylor rule recommendation for the euro area as a whole. However, economic differences between peripheral and core euro-area countries are sharp. The core countries are recovering, while the peripheral countries still have large unemployment gaps. Thus, the ECB target rate is not in line with Taylor rule recommendations for the peripheral countries.

via Federal Reserve Bank San Francisco | Monetary Policy When One Size Does Not Fit All.
The share market speaks on Grexit: banknote printer shares soar
20 Feb 2015 Leave a comment
in currency unions, macroeconomics, monetary economics Tags: event studies, Greece
@DanHannanMEP Seems you're not alone, judging from the DeLaRue share price… #newdrachmasplease http://t.co/rrQgr6EtSu—
James v B (@CausticCorner) February 19, 2015
Where the €227B loans to Greece since 2010 have gone
18 Feb 2015 Leave a comment
in currency unions, Euro crisis, global financial crisis (GFC), macroeconomics Tags: Greece, sovereign default
What happens when you play “chicken” with a game theorist (The Greek Finance Minister)?
14 Feb 2015 Leave a comment
in currency unions, Euro crisis, international economics Tags: game theory, Greece, Greek default, optimal currency areas, sovereign default

Luke Froeb suggests:
However, opting for forgiveness risks creating dangerous incentives for other countries to act in the same way as Athens. “Germany may decide that if the eurozone does not punish Greece, it will have problems with other countries such as Spain and Italy,” says Roger Myerson, a Nobel-winning economist at the University of Chicago.
Mr Varoufakis should therefore try to convince Germany that Athens’ situation is unique and that other eurozone countries will not seek debt relief as a result, he says. In doing so, he would follow the illustrious precedent of the citizens of Melos, to whom Athens, during the Peloponnesian war between Athens and Sparta, gave the choice of surrendering or facing annihilation.
“The Melians sought to argue that they were different and that sparing them would not set a dangerous precedent vis-à-vis other islands,” says Mr Myerson.
The problem with this strategy, however, is that the other player may choose to build a reputation for toughness. This is what Athens opted for — it laid siege to the island and starved the inhabitants into submission.

via Managerial Econ: What happens when you play “chicken” with a game theorist? and Greek Game Theory: Default, Devaluation, Deliverance?..

Recent Comments