@stevenljoyce misses the point on R&D and economic growth

With 99% of global R&D undertaken overseas, Steven Joyce, the Minister for Economic Development, simply missed the point in an op-ed today as to what was important in raising New Zealand’s economic growth potential. As a technology follower, the issue is New Zealand’s ability to import and absorb the latest technological innovations from overseas. The extent of local

Source: Steven Joyce: A chance for a land of milk and money – Politics – NZ Herald News.

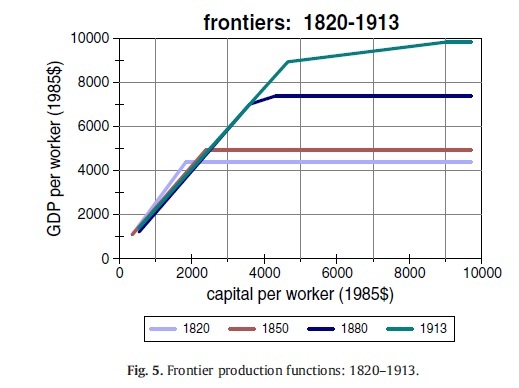
Different national abilities to absorb technology innovations that were developed by the countries at the global frontier such as the USA will result in different national growth rates for countries that are technological followers (Acemoglu et al. 2006; Aghion and Howitt 2005, 2006; Howitt 2008). As a technological follower nation such as New Zealand approaches the global technological frontier, the types of institutions required for successful technology absorption changes markedly.

The world growth rate is driven by discoveries in the technologically leaders such as the USA, Japan, Germany, UK and France (Barro and Sala-i-Martin 1999). The richest OECD member countries are rich because they use almost all of the available global pool of useful technological knowledge. Their further growth is limited to growth in the global pool of technological knowledge (Parente 2001).

Technological followers such as Australia, Canada, and New Zealand converge toward the global technological leaders because copying is cheaper than innovation over some range. The cost of imitation is estimated to be 40 to 90 per cent of the cost of an innovation (Barro and Sala-i-Martin 1999). This ability of economic development latecomers to grow rapidly by importing and copying frontier technologies is the ‘advantage of backwardness’ (Gerschenkron 1952).

Appropriate institutions and distance from the global technology frontier

The kind of institutions and economic policies that are appropriate to sustain convergence and technology transfer evolve and become more demanding as a country approaches the global technological frontier (Acemoglu et al. 2006; Aghion and Howitt 2005, 2006). The key point from the discussion of endogenous growth theory that is to follow is that institutions that favour the implementation of imported technologies may not necessary favour innovation (Aghion and Howitt 2005, 2006).

The political, tax and regulatory institutions that favour the more ready-made implementation of more standardised imported technologies do not necessarily favour the growing demand for the domestic innovations in New Zealand as the global technological frontier nears. There is a growing demand for more highly skilled workers to master and adapt the leading-edge technologies to the distinctive circumstances of each New Zealand workplace.

By innovation, I do not mean the lab coats model of R&D where boffins invent new products. By innovation, I mean workplace innovation where New Zealand workers master the latest technologies so they can squeeze every drop out of these new and upgraded products and adapt them to New Zealand markets.

Innovation is much more than the R&D that leads to design blueprints for new or upgraded products and production process. Technology transfer is much more than the unpacking of imported new equipment and production processes, the reading of the associated blueprints and operating manuals and some training when the latest imported technology is more complex and less established.

Technologies can be ranked in the level of human capital required in workers. Some technologies are routine in operation and implementation. Others can be much more complex and require local innovations in how the technology is operated and the workers need to be highly educated, well-trained and able to follow quickly the latest technological developments (Nelson and Phillips 1966).

Innovation is getting harder

As technology progresses, each new and upgraded product is a smaller and smaller increment and what came before. Innovation is haunted by fishing-out effects. The easier innovations are discovered first with more and more R&D and adaptation efforts required for further successes. With technological knowledge ever accumulating, and a greater complexity of new innovations, each new generation of innovators and workers that used new technologies face an increasing educational and research burden.

R&D efforts, human capital investments and on-the-job learning must be spread more and more thinly over a greater number of different sectors, products and production processes. Product proliferation requires a society to make ever-increasing investments in R&D, in human capital and in on-the-job learning to innovate and adopt and adapt new technologies at the same pace as before.

The trend rate of productivity growth did not accelerate over the 20th century despite a massive rise in investments in human capital and R&D because of the rising cost of discovering and adapting new technological knowledge. The number of both R&D workers and highly educated workers increased many-fold over the 20th century in New Zealand and other OECD member countries including the global industrial leaders such as the USA, Japan and major EU member states.

Trend productivity growth did not accelerate because innovation is simply getting harder. As modern technology advances, each new technology is more complex and the number of products and production processes proliferate exponentially.

Technology absorption is getting harder

In implementation models of technology diffusion, the imported technology is very much ready-made and proven rather than a recent innovation. Implementation it is more of an issue for developing countries where they lack many technologies. They are introducing proven technologies that spread widely in developed countries decades previous. It is really about unpacking the box and plugging it in.

Far from the frontier, the technology gap is so large so that growth in productivity from each innovation on the relatively old predecessors is large. As a laggard moves closer to the global technological frontier, the impact of each successive technology import will decline. The newer technology is a smaller and smaller upgrade on what it replaces (Aghion and Howitt 2005, 2006, 2009).

Close to the global technological frontier, there is less room for copying and easy adoption of well-established technologies. Many of the latest technologies are small upgrades on the previous product. Skill and entrepreneurial endeavour is needed to harvest all of the latest available quality improvement.

As technology followers such as New Zealand approach the global technological frontier, the institutions appropriate for continued productivity growth change. As a country moves closer to the global technological frontier, the impact of each successive technology import will decline. The latest imported technology is usually a smaller and smaller upgrade on before. A more skilled workforce and greater entrepreneurship is needed to squeeze out all of the available productivity and product quality gains from the latest imported technologies. This is in contrast to Mr. Joyce’s lab coats model where boffins spend R&D handouts from him.

As a country nears the global technological frontier, the impact of each successive technology imports is smaller. The newest imported technology is a smaller and smaller upgrade on what it replaced. A more skilled and experienced workforce is needed to meet the challenge to squeeze out all of the available productivity and product quality gains from the latest technologies (Ha and Howitt 2007).

The initial incarnations of new production technologies and new products are often expensive and bug-infested. Skilled and seasoned operators are needed to oversee their introduction and testing. Later versions of new products and processes are far more reliable and much cheaper to run. There are gradual improvements in quality of the product and in the way in which and the scale on which the product is produced and maintained. As a new technology becomes more established, there is less demand in the adopting firms for more skilled labour and an increased demand for less skilled labour (Greenwood 1999).

A leading reason behind the one to two decade or longer delay in any new technology moving from use by 10 per cent of an industry to 90 per cent use are the complexities of mastering new technologies. Jovanovic and Lach (1997) found a 15-year lag to go from 10 per cent to 90 per cent use for the 21 innovations they reviewed. Even for transformational technologies ranging from electricity to the Internet, a host of secondary innovations had to be invented, adopted and mastered over several decades before the most was made on their potential.

Access to technologies depends upon having a suitably prepared workforce. The costs of technology absorption and imitation are lower the more abundant is human capital in the technology importing country (Nelson and Phelps 1966; Benhabib and Spiegel 2005). A high proportion of skilled workers in the labour force are an inviting market to develop technologies to compliment those skills (Acemoglu 2002, 2003).

Many technologies developed by the industrial leaders are designed to make best use of the skills that are in good supply in the workforces of these countries. These skills are less abundant in follower countries. Some of the tasks performed by skilled workers in the industrial leaders will be carried out by less skilled workers when they use the same technology in a follower country. Since the technology is designed for use by skilled workers, productivity will be lower in countries with less of the required human capital. This mismatch between skills and technology can lead to sizable differences in total factor productivity and output per worker (Acemoglu and Zilibotti 2001).

Why did the EU stop catching-up?

The end of the EU’s productivity convergence with the USA from the late 1980s has been partly attributed to not making the shift from technology implementation enhancing institutions to innovation enhancing institutions (Aghion and Howitt 2005, 2006). Different types of policies or institutions appear to be growth-enhancing at different stages of development.

The institutions of the EU member states may have become inappropriate to its increasing proximity to the global technological frontier. Many of the EU member states had caught up with USA in capital-labour ratios and labour productivity. The institutions of the EU were the appropriate growth-enhancing institutions during this prior period of catch-up with the USA. The EU then reached the world technology frontier by the 1990s and this exhausts capital accumulation and technological imitation as sources of growth for technology laggards. By the 1990s, Europe needed to develop institutions that promoted innovation.

The EU had to switch over to innovation enhancing institutions but it did not successfully make this move. This switch required regulatory and tax reforms and more national investment in R&D and higher education. The EU falls short on these new institutional requirements because it lags the USA by 25 to 50 per cent in R&D and higher education spending relative to GDP and in the educational attainment of the respective workforces (Aghion 2006). The institutions of the EU were appropriate to facilitating catch-up but not to the encouraging of innovation.

The end by 1990 of the EU’s productivity convergence on the USA has been partly attributed to not making the policy shift from technology implementation enhancing institutions to innovation enhancing institutions. EU members invested far less than the USA in R&D and tertiary education had more rigid labour and product markets, had less entry and exit of firms, and much higher taxes.

Implementation-based and innovation-based policy regimes

The intensity and mix of innovation and imitation in a country will depend on institutions, policies and the composition of human capital in ways that vary with a country’s distance to global technological frontier (Aghion and Howitt 2005, 2006, 2009). Imitation of the technological leaders may be enhanced by long-term investments in large existing firms.

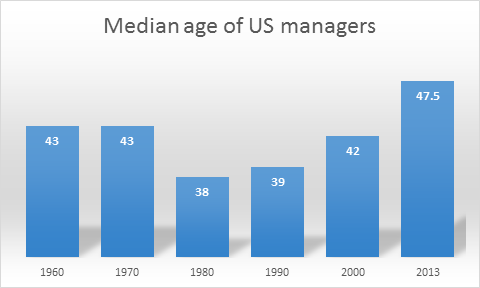
Innovation depends more on skill adequacy and is enhanced by institutions which screen out managers and allow shareholders to dismiss those who underperform. Innovation often requires initiative, risk-taking, the selection of good projects and talents, and the weeding out of those that are not to be profitable (Aghion and Howitt 2005, 2006).

The political, tax and regulatory institutions that favour the more ready-made implementation of more standardised imported technologies do not necessarily favour the growing demand for the domestic innovations in New Zealand as the global technological frontier nears. There is a growing demand for more highly skilled workers to master and adapt the leading-edge technologies to the distinctive circumstances of each New Zealand workplace to stay ahead in rapidly changing competitive environments and meet the changing needs of customers.

Productivity growth is not manna from heaven. Every increase in productivity and in product quality and variety are the sum of many inventions that must be first discovered by prospective innovators building on past ideas and developed, tested, adopted and adapted by profit-minded entrepreneurs and workers. Investments in R&D, in human capital and in on-the job learning and in the entrepreneurial judgments about risking investments in the new technologies that all underpin further growth in productivity are all influenced by public policies.

Far from the global technological frontier, the policy regime and institutional background of a technological follower can promote implementation based growth with established firms and an emphasis on a good primary and secondary education of workers.

Closer to the global technological frontier, capital accumulation and technological imitation will have been exhausted as the main sources of growth (Aghion and Howitt 2005, 2006). A country must turn to innovation, which is the ability for firms and highly skilled workers to move rapidly into new technologies and products and improve production processes. This calls for different skill levels and entrepreneurial approaches to implementation (Aghion and Howitt 2005, 2006). Tertiary education will became much more of a priority closer to the frontier.

As a country moves closer to the global frontier, its technological capabilities must change from just implementing imported technologies to modern R&D. Modern R&D draws heavily on scientific knowledge and methods, and requires higher skill levels (Aghion and Howitt 2005, 2006, 2009). The implementation of the more sophisticated imported technologies requires a more skilled work-force.

Modern R&D uses resources, including skill labour, to generate new knowledge about technological possibilities and these endeavours use scientific principles and methods to build on previous knowledge (Aghion and Howitt 2005, 2006; Ha and Howitt 2007). Invention and the lab-coat vision of R&D is a small part of modern innovation. Only a small fraction of R&D expenditures even in the USA is actually spent on invention and basic research. Most R&D is about the development and the adaptation of ideas for practical uses in the workplace and elsewhere (Jovanovic 1997; Greenwood and Jovanovic 2001). The majority of spending on schooling, on-the-job training and learning by doing, 10-15 per cent of GDP or more, is about informing students of their menu of technological options and preparing them to adapt these options to a great variety of both known and yet to be discovered uses (Jovanovic 1997; Greenwood and Jovanovic 2001).

Institutions that foster technology absorption

Productivity growth in New Zealand is principally about making the most of technology transfer by absorbing and adapting overseas invented technologies. The nature of technology absorption changes as a country approaches the global technological frontier. New Zealand can no longer rely on its workforce and entrepreneurs implementing of more straight-forward new product designs and new production process invented in the research sectors and workplaces of the global leaders to keep local productivity growing at two per cent per year.

As an economy approaches the world technology frontier, there must be a switch from an implementation-based regime to an innovation-based policy regime with younger firms, fewer incumbents, better educated workers and more entry and exit. These newer and younger firms will be the standard bearers of the latest technologies. The threat of more new entry will induce incumbent firms to innovate more to parlay this growing threat of displacement be new entrants.

The local workforce must up-skill if the more leading edge technologies are to be understood and adapted. These technologies are designed to be used by more educated workers able to meet the challenges of operating complex technologies. The leading-edge technologies are more productive if paired with more highly skilled workers. Many secondary innovations and local adaptations are needed before the new technology can be fully mastered. These local technological adaptations are more complex and costly than for the prior technologies.

Close to the global technological frontier, firms and workers must be able and skilled enough to move rapidly into new activities and the latest technologies and be able to quickly improve and refine production processes and product designs. More and more of productivity growth will come from a rapid expansion of a locally based class of educated people who spend their careers exchanging ideas, solving work-related problems and generating new knowledge. Large productivity gains can be lost if there is a mismatch between technologies and the skills of the workers that operate it (Acemoglu and Aghion 2001).

Many legal and economic institutions must change. Changes are required to competition and entry policies, the funding to higher education, and the design of macroeconomic and tax policies that encourage investment, domestic savings and investment in human capital (Aghion and Howitt 2005, 2006, 2009). For example, more investments in higher education speeds transfer of the most complex frontier technologies.

The composition of human capital is important as the global technology frontier approaches. More and more university graduates are required to adapt the latest technologies successfully. This is partly because skilled labour is used intensively in the R&D process needed for the technology transfers.

It is also because the benefits from the diffusion of more complex technologies from the global leaders are faster where there are skilled local workers able to adapt these technologies and to use them most productively in-country. An effective education system will have a positive effect on long-run growth by increasing the efficiency of innovation technologies and investments, both of which are highly skill intensive, and by reducing the cost of skill labour, which in turn increases the profits that accrue to successful innovators and rapid technology adaptors.

Schumpeterian endogenous growth theory

The Minister of Economic Development is simply missed the second generation of endogenous growth theory and in particular Schumpeterian growth theory:

This new theory is explicit about who gains from technological progress, who loses, how the gains and losses depend on social arrangements, and how such arrangements affect society’s willingness and ability to create and cope with technological change.

The more demanding institutional requirements on countries that are closing in on the global technology frontier can make reform a prerequisite to continued current growth rather than higher trend growth. Entrepreneurial rewards drive invention and innovation and the import and adaptation of new technologies.

Innovation and adaptation becomes more complex as technology advances. Larger and longer investments are required in human capital to overcome the rising burden of knowledge to learn enough to continue innovating and adapting at the current pace. This made reforms to the adequacy of the rewards for entrepreneurship and human capital of increased importance in recent decades.

Lower company tax and less labour market regulation are the biggest contributions that government can make to raising the growth potential of the New Zealand economy. Instead, Stephen Joyce focuses on giving more and more handouts to boffins rent seeking boffins. The real innovators, the real entrepreneurs in the New Zealand economy responsible for importing and adapting the latest technologies from overseas must therefore carry an extra burden, a higher company tax, because of the success for rent seeking by boffins.

Long-term unemployment rates across the OECD

image

Data extracted on 08 Jan 2016 21:44 UTC (GMT) from OECD.Stat

The unreliable nature of forecasting

Generation liquidity trap

Finn Kydland – The Implications of Nation’s Policy Environments for Innovative Activity and Capital Formation

Current State of World Economic Development by Ed Prescott (8 December 2015)

The Taylor rule and the Fed’s interest rate policies compared

The average age of managers as a cause of the 1970s productivity slowdown

Jim Feyrer put forward a clever hypothesis about the sudden decline in the average quality of managers as a major contributor to the 1970s productivity slowdown. His hypothesis is a good contribution to real business cycle theory because what could be more random a shock than a demographic shock arising from the baby boom.

Feyrer’s hypothesis builds on Robert Lucas’s theory of the entrepreneur and the optimal size of the firm. The better entrepreneurs can manage larger spans of control.

Specifically, these more talented entrepreneurs can spread their skills and vision over a larger workforce thereby raising its productivity and that of the firm. Better quality managers are better trainers, better leaders, better problem solvers and better at recruiting and retaining staff.

If managerial skill and talent accumulates with experience, an influx of young workers into the workforce with the influx of the baby boomers into the workforce will lower the average quality of entrepreneurs. This will show up empirically as a decrease in the average age of managers and with that their experience and skills.

With the average age of the labour force lower during the influx of the baby boomers, more marginal managers have to be promoted into managerial positions to supervise younger employees. Lower managerial quality will lower the productivity of the workforce as a whole.

If managerial talent and skill is to have any meaning, a more talented manager should be able to extract greater productivity from the same quality labour force. Lazear points out that

Supervision and management are fundamental in personnel economics and in the theory of the firm… Boss effects are large and significant. Most important, bosses vary substantially in their quality. A very good boss increases the output of the supervised team over that supervised by a very bad boss by about as much as adding one member to the team.

The influx of less able managers in the 1970s, as shown by a five-year reduction in the median age of US managers in the chart below, accounted for 20% of the observed productivity slowdown and resurgence in the 1970s and 1980s according to Feyrer. To fill vacancies, employers had to drop their hiring standards for managers.


Source: Jim Feyrer The US Productivity Slowdown, the Baby Boom, and Management Quality, Journal of Population Economics (2011) and Bureau of Labor Statistics Employed persons by detailed occupation and age (2013).

When the median age of managers rose in the 1990s, and along with it the average of quality of management, this productivity slowdown was reversed. Both the increase in the decrease in the age of managers are random productivity shocks in the tradition of real business cycle theory.

The average age of the US manager was 38 in 1980 and 39 in 1990. There is no US managerial occupation with an average age of less than 40 in 2013. The fifth managerial occupation with the lowest managing age is food service managers. The highest outside of agriculture is chief executives,


Source: Bureau of Labour Statistics Employed persons by detailed occupation and age (2013).

One of the mocking tones directed at real business cycle theory is it was supposed to require a regular forgetting of technologies so that productivity fell and then the loss technologies were remembered a few years later to have a business cycle.

That forgetting and remembering is what happened with the average age of managers and labour productivity in the 1970s. Management quickly lost five years of experience then slowly regained it with matching productivity swings and roundabouts.

Feyrer is another addition to a long line showing that business cycles can arise from the sum of random shocks, rather than one big shock, as Prescott suggested in 1986:

Another Summers question is, Where are the technology shocks? Apparently, he wants some identifiable shock to account for each of the half dozen postwar recessions. But our finding is not that infrequent large shocks produce fluctuations; it is, rather, that small shocks do, every period.

Labour productivity growth in New Zealand since 1951

https://www.facebook.com/FigureNZ/photos/pb.374053709279073.-2207520000.1449201572./1070843926266711/?type=3&theater

Rejoinder to @geoffsimmonz and Jess Berentson-Shaw on are we all sexists – Part 1

Morgan Foundation researchers Jess Berentson-Shaw and Geoff Simmons were good enough to write a long reply to my recent post on the role of unconscious bias in the gender wage gap. My post was in reply to a Friday whiteboard session by Geoff Simmons.

I thought the best way to start is to summarise their reply in terms of how my rejoinder will be structured:

  1. There is a persistent, known but unexploited entrepreneurial opportunity for pure profit arising from employers not hiring women on merit because of an unconscious bias against them. This unconscious bias among employers against women explains 20-30% of the gender wage gap. Most of the rest of that gap is due to factors such as differences in occupation and education.
  2. The gender wage gap is smaller at the bottom of the labour market because of the minimum wage.
  3. The gender wage is smaller in the middle than at the top of the labour because of “far more standard contracts in the middle”. I take this to mean recruiting firms set a hiring standard and make a wage offer. This does not mean they have a free hand in their wage posting. A higher wage offer attracts better qualified applicants. Posting a low wage attracts fewer candidates that meet their hiring standard from other jobs and from the ranks of the unemployed. The available evidence suggests that one-third of job matches are based on wage bargaining and two-thirds through wage posting. Wage posting is more common in larger firms, the public sector and where there is collective bargaining. Wage bargaining is more profitable for occupations and jobs with a high dispersion in workers’ skills and productivity and in tighter labour markets.
  4. The gender pay gap is largest for the top 10% of female wage earners because “…  what scientific evidence supports the argument that better paid women have the ability to negotiate pay & conditions better? The very fact that there is a consistent and large gap between highly paid men and women suggests that where MORE negotiation, discretion, more complex selection processes are involved the more women are discriminated against”. The available evidence is wage posting is less common the more skilled is the worker. It pays to invest more in scrutinising recruits against hiring standards and to consider offer matching when the wage is higher for applicants and for employees threatening to quit. The payoff from a longer job search is greater the higher is the wage. There is a greater chance of higher skilled jobseeker of finding a better paid match between their more idiosyncratic skills and backgrounds in vacancies elsewhere or which might appear later. Low skilled jobseekers invest less in job search because one vacancy is frequently as good as another in their occupational and industry labour markets. The higher skilled are also more geographically mobile than the low skilled and more likely to live in cities and earn the urban wage premium.
  5. “Better paid professional women may have more options than lower paid women but they still have fewer than their male equivalents.” I take this to mean the greater the ability of workers to move from employer to employer, the better are they paid. Women have a weaker average attachment to the labour market. The human capital interpretation of this is woman and mothers in particular have lower productivity because they have spent less time accumulating on-the-job human capital. In the search and matching interpretation, women have less search capital. Workers start out as job shoppers: the longer a worker shops around, the more likely after a succession of job matches that they chance upon better paying job and occupational matches. Women through career interruptions for motherhood spend less time in the labour market, accumulate less search capital and are therefore are paid less. Women find it harder to work their way into the better-paying job matches.
  6. “Removing unconscious bias requires cultural change and will take time to resolve but it is possible to do with concerted effort.” This as example of what Adam Smith called the overweening conceit of youth.

My reply to the original Friday whiteboard session by Geoff Simmons relied on invisible hand explanations. Nozick argued that invisible hand explanations of social phenomena must have a filter and an equilibrating mechanism.

Geoff Simmons’ hypothesis about the gender wage gap is an invisible hand explanation: 20-30% of the gender wage gap is driven by unconscious bias. There could be no greater an invisible hand than an unconscious one.

There must be a mechanism in Geoff Simmons’ hypothesis that guides market participants to not hire and not promote women on merit. Not hiring on merit forfeits profit. There must be a filter that penalise hiring on merit.

The market has a filter and an equilibrating mechanism that constitute its invisible hand. The equilibrating mechanism – the mechanism that prompts people to hire on merit – is price signals. Prices are a signal wrapped in an incentive. If prices go up, buy less and look for other options, if they go down, buying more is profitable. The filter, which is more of an invisible punch than an invisible hand, is profits and losses. Higher costs, lower profits, loss of market share, insolvency and bankruptcy drive out the entrepreneurs who fail to hire on merit.

Entrepreneurs that hire on merit are more likely to survive in market competition than those that do not. Entrepreneurs must adapt or die.

There is no similar institutional filter in Geoff Simmons hypothesis to ensure that not hiring on merit is the unintended outcome from the decentralised behaviour of countless employers and job seekers trying to improve their own circumstances. Self-interested employers are not prompted by price signals to not hire on merit. More importantly, their chances are surviving in market competition are increased rather than are reduced if employers resist the temptations arising from their unconscious biases against women.

This institutional context is the reverse of what should be for unconscious bias against women to survive in market competition as suggested by Geoff Simmons. Firms that hire on merit should have a lower probability of survival, not a higher chance of staying in business if the unconscious bias hypothesis is to prevail in the face of market competition.

Geoff Simmons and Jess Berentson-Shaw is they didn’t address my extensive comments about the market as an evolutionary process. They did not explain how market competition would not penalise employers who fail to hire on merit for any reason including unconscious bias. That is the fundamental flaw, a fatal flaw in their reply to my comment on their Friday whiteboard session.

Most of all, Geoff Simmons and Jess Berentson-Shaw succumb to what Robert Nozick christened normative sociology. This is the study of what the causes of social problems ought to be.


For Geoff Simmons and Jess Berentson-Shaw, the gender wage gap ought not be the result of the conscious choices of women making the best they can do what they have. The gender wage gap must be the result of the bad motivations of employers and other external forces. The bad motivations must be unconscious because conscious prejudice is rare these days.

The unconscious bias hypothesis suffers from the same floors as the occupational crowding and occupational segregation hypotheses. Neither the unintentional bias hypothesis nor the occupational crowding and segregation hypotheses have a filter and an equilibrating mechanism that guides employers into make unprofitable choices about hiring. These hypotheses must explain how unconsciously biased employers survive in competition with less unconsciously biased employers.

Central to Gary Becker’s theory of prejudice based discrimination is competition in the market will slowly wear down prejudice-based discrimination in the same way that it drives out any other practices inconsistent with profit maximisation and cost minimisation. Profit maximisation gets no respect in the theory of unconscious bias and the gender wage gap put forward by Geoff Simmons and Jess Berentson-Shaw.

If there are sufficient number of less unconsciously biased employers, there will be segregation. Some employers will hire a large number of women because they have the pick of the crop and will be more profitable to boot at least in the short run.

The more unconsciously biased employers will have a large number of men working for them and will be less profitable and more likely to fail. At worst, men and women will be paid to same but most women will work for these less unconsciously biased employers. The possibility of labour market segregation rather than gender wage gap was not considered in the unconscious bias hypothesis.

Unconscious bias is a preference-based explanation of the gender wage gap. The young are the last to notice the rapid social change that came before them. Cultural and preference based explanations underrate the rapid social change in the 20th century. As Gary Becker explains:

… major economic and technological changes frequently trump culture in the sense that they induce enormous changes not only in behaviour but also in beliefs. A clear illustration of this is the huge effects of technological change and economic development on behaviour and beliefs regarding many aspects of the family.

Attitudes and behaviour regarding family size, marriage and divorce, care of elderly parents, premarital sex, men and women living together and having children without being married, and gays and lesbians have all undergone profound changes during the past 50 years. Invariably, when countries with very different cultures experienced significant economic growth, women’s education increased greatly, and the number of children in a typical family plummeted from three or more to often much less than two.

Goldin (2006) showed that women adapted rapidly over the 20th century to changing returns to working and education as compared to options outside the market. Their labour force participation and occupational choices changed rapidly into long duration professional educations and more specialised training in the 1960s and 1970s as many more women worked and pursued careers. The large increase in tertiary education by New Zealand after 1990 and their move into many traditionally male occupations is another example.

The main drivers of the gender wage gap are unknown to recruiting employers such as whether a would-be recruit is married, how many children they have, whether their partner is present to share childcare, how many of children are under 12, and how many years between the births of children. Spacing out the births is a major driver of the gender pay gap but this information is unknown to employers when hiring. As Polachek explains:

The gender wage gap for never marrieds is a mere 2.8%, compared with over 20% for marrieds. The gender wage gap for young workers is less than 5%, but about 25% for 55–64-year-old men and women. If gender discrimination were the issue, one would need to explain why businesses pay single men and single women comparable salaries. The same applies to young men and young women.

One would need to explain why businesses discriminate against older women, but not against younger women. If corporations discriminate by gender, why are these employers paying any groups of men and women roughly equal pay? Why is there no discrimination against young single women, but large amounts of discrimination against older married women?

… Each type of possible discrimination is inconsistent with negligible wage differences among single and younger employees compared with the large gap among married men and women (especially those with children, and even more so for those who space children widely apart).

The main drivers of the gender wage gap are of no relevance to entrepreneurs making a profit. These findings are devastating to the notion that there is some sort of discrimination against women on the demand side of the labour market.

Employers lack the necessary information to implement any unconscious bias they might have against women in fact is mainly a bias against older women and mothers and mothers in particular the space out the births of their children. The emergence of the gender wage gap is through the supply-side choices of women because employers lack the necessary information to drive the emergence of a gender pay gap.

The career cost of a family is central to the emergence and size of the gender pay gap because it leads to self-selection on the supply-side in terms of human capital to mitigate the cost of careers breaks.

The gender gap is fairly minor before the age of 30. The female full-time employment rate drops by 10 percentage points after women enter their 30s before recovering by the time women reach the age of 50 (Johnston 2005). The gender wage gap also widens between the ages 35 to 64 when women are raising children; the biggest gap is for the ages of 44 to 44; a wage gap of 22 per cent (MWA 2010). The first child is estimated to reduce New Zealand female earnings by 7 per cent and second child reduces earnings by 10 per cent (Dixon 2000, 2001).

This self-selection of females into occupations with more durable human capital, and into more general educations and more mobile training that allows women to change jobs more often and move in and out of the workforce at less cost to earning power and skills sets. Chiswick (2006) and Becker (1985, 1993) then suggest that these supply side choices about education and careers are made against a background of a gendered division of labour and effort in the home, and in particular, in housework and the raising of children. These choices in turn reflect how individual preferences and social roles are formed and evolve in society.


Source: On Equal Pay Day, key facts about the gender pay gap | Pew Research Center.

Tiny differences in comparative advantage such as in child rearing immediately after birth can lead to large differences in specialisation in the market work and in market-related human capital and home production related work and household human capital (Becker 1985, 1993). These specialisations are reinforced by learning by doing where large differences in market and household human capital emerge despite tiny differences at the outset (Becker 1985, 1993).

Many women choose educational and occupational paths that give them more control over their hours worked, and lowers the cost of time spent on maternity leave and the associated depreciation of skills during career breaks and reduced hours (Polachek 1978, 1981; Bertrand, Goldin and Katz 2010; Katz 2006; Sasser 2005). Women over the entire run of the 20th century often end up in jobs that reduced the career cost of a family and rapidly changed their plans when new opportunities emerge (Katz 2006).

The prospect of children drives the early choices of women on education and occupations. Careers requiring continuous commitment, long hours and great sacrifices do not attract and retain as many women (Bertrand, Goldin and Katz 2010; Goldin 2006). Goldin and Katz (2011) found that differences in the reductions on the cost of career breaks was a major driver in the influx of women into previously male dominated occupations.

The key is what drives the rapid changes in the labour force participation and occupational choices of women. Some of the factors are global technology trends such rising wages and the emergence of household technologies and safe contraception and antidiscrimination laws. All of these increased the returns to working and investing in specialised education and training.

Up until the mid-20th century, women invested in becoming a teacher, nurse, librarian or secretary because these skills were general and did not deprecate as much during breaks. When expectations among women of still working at the age of 35 doubled, there were massive increases in female labour force participation and female investments in higher education and specialised skills (Goldin and Katz 2006).

In summary, Geoff Simmons and Jess Berentson-Shaw put forward an invisible hand explanation of the residual in the gender wage gap that lacks that all-important invisible punch. There is no market mechanism which penalises employers who rise above their unconscious bias against women to hire on merit. The invisible hand rewards employers that hire on merit with higher profits and penalises those that indulge a bias of whatever origin. The invisible hand consists of an invisible finger and an invisible punch. The invisible finger points the way forward through price signals; the invisible punch slaps down those entrepreneurs whose attentions wander from their bottom line when deciding who to hire and promote.

Part two of this reply will address the particulars of the reply of Geoff Simmons and Jess Berentson-Shaw. In particular, the search and matching aspects of their explanation and whether we are all sexists.

Will global warming boost economic growth? @GreenpeaceNZ @RusselNorman The revenge of the broken window fallacy

Source: Environmental and Urban Economics: Climate Change and Economic Growth.

The modern macroeconomics of the Global Financial Crisis

https://twitter.com/JimRose69872629/status/671926029057785856

Is promoting R&D New Zealand’s path to prosperity?

Michael Reddell was right to run his sceptical eye over the enthusiasm of the New Zealand government for promoting local R&D. Politicians are obsessed with boffins in lab coats who invent thing rather than the entrepreneurs who risk import technologies and adapt them to local markets.

New Zealand is a technology follow-up. 99% of global R&D is undertaken abroad. The key innovation policy question for New Zealand is how to adopt those technologies rather than how to invent them.

https://img.quozio.com/img/a6dd47b6/1025/The-fraction-of-US.jpg

Appropriate institutions and distance for the global technological frontier

As technology followers such as New Zealand approach the global technological frontier, the institutions appropriate for continued productivity growth change.

As a country moves closer to the global technological frontier, the impact of each successive technology import will decline. The latest imported technology is usually a smaller and smaller upgrade on before. A more skilled workforce and greater entrepreneurship is needed to squeeze out all of the available productivity and product quality gains from the latest imported technologies.

The institutions appropriate to further growth are context-dependent

The political, tax and regulatory institutions that favour the more ready-made implementation of more standardised imported technologies do not necessarily favour the growing demand for the domestic innovations in New Zealand as the global technological frontier nears. There is a growing demand for more highly skilled workers to master and adapt the leading-edge technologies to the distinctive circumstances of each New Zealand workplace to stay ahead in rapidly changing competitive environments and meet the changing needs of customers.

Productivity growth is not manna from heaven. Every increase in productivity and in product quality and variety are the sum of many inventions that must be first discovered by prospective innovators building on past ideas and developed, tested, adopted and adapted by profit-minded entrepreneurs and workers. Investments in R&D, in human capital and in on-the job learning and in the entrepreneurial judgments about risking investments in the new technologies that all underpin further growth in productivity are all influenced by public policies.

Moving from implementation-based to innovation-based policy regimes

As a country approaches the global technology frontier, continued technological imitation is no longer enough to keep productivity growing at the trend rate of two per cent per year. There must be an institutional switch from a technology implementation-based policy regime to an innovation-based policy regime.

The end by 1990 of the EU’s productivity convergence on the USA has been partly attributed to not making the policy shift from technology implementation enhancing institutions to innovation enhancing institutions. EU members invested far less than the USA in R&D and tertiary education had more rigid labour and product markets, had less entry and exit of firms, and much higher taxes.

Institutions must adapt to distance from the technological frontier

As a country approaches the global technology frontier, there must be younger firms, fewer incumbents, better educated workers, more R&D, more entry and exit, more flexible product and labour markets and lower taxes. These dynamic entrepreneurial features were not common-place in pre-1984 New Zealand.

New Zealand too had to switch to institutions that enhanced innovation and entrepreneurial entry just to return to growing at the global trend rate of 2 per cent per year. The political, tax and regulatory institutions appropriate prior to 1973 when New Zealand was a colonial farm for the UK are different to the institutions that are growth-enhancing in a less sheltered economic environment. There is no reason to suppose that the rising burden of knowledge and product proliferation has in any way ebbed to lighten the pressure for continued reform.

The institutional foundations of prosperity and stagnation

Questions about greater prosperity of New Zealand must be correctly posed and should focus on the fundamental causes of productivity growth rather than the proximate causes. The proximate causes of productivity and prosperity are the accumulation of more human and physical capital and technological progress.

Institutions are the fundamental cause of prosperity and cross-country differences in per capita incomes. Institutions determine the incentives and constraints on working, learning and investing, and influence, in a profound way, investments in physical and human capital and R&D and the importing of new technologies. It is premature to conclude that the national institutions and policies of OECD member countries are fairly similar and that the institutional differences that they do have are minor in their impact on respective national productivity and income levels.

There have been periods of prosperity, divergence, depression, recovery, catch-up and no catch-up at difference times in OECD member countries and usually for country-specific reasons. These large changes in fortune are not by chance. The differences in policy that gave rise to these divergences in income levels and extended periods of prosperity and stagnation should be open to analysis so that policy improvements can be discovered for possible application in New Zealand.

Michael Reddell's avatarcroaking cassandra

The Productivity Hub is a partnership of agencies which aims to improve how policy can contribute to the productivity performance of the New Zealand economy and the wellbeing of New Zealanders. The Hub Board is made up of representatives from the Productivity Commission, the Ministry of Business, Innovation and Employment, Statistics New Zealand and the Treasury

The Productivity Hub yesterday hosted a symposium in Wellington with the title “Growing more innovative and productive Kiwi firms”. “Growing” things is usually something gardeners do – people doing stuff to things. So the title perhaps carried somewhat unfortunate connotations of successful firms being the products of government action. That probably wasn’t their intention, at least not wholly, but then again it wasn’t entirely out of line with the list of attendees – 161 names, of whom at least 150 would have been bureaucrats, academics, and the like. There appeared to be only a very…

View original post 2,243 more words

Australian and New Zealand detrended real GDP growth, PPP, 1956 – 2014

I have updated my estimates of Australian and New Zealand detrended real GDP growth for the 2014 working age population statistics from the OECD. The charts show:

  • the lost decades of New Zealand growth between 1974 and 1992;
  • the return of trend growth between 1992 and 2007 but no rebounding to recover lost ground;
  • the effects of the global financial crisis in Australia and New Zealand; and
  • a return to trend growth in New Zealand since about 2010 but not in Australia.

Source: Computed from OECD Stat Extract and The Conference Board. 2015. The Conference Board Total Economy Database™, May 2015, http://www.conference-board.org/data/economydatabase/

The real GDP data in the above chart is detrended by 1.9% per annum. 1.9% growth per year is the trend real GDP growth rate of the USA in the 20th century. The growth rate of the USA is taken as the growth rate of the global technological frontier. A flat line in the above chart is real GDP growth at 1.9% per year. A falling line is real GDP growth in that year of less than 1.9%; a rising line is growth that is greater than 1.9% in that year.

Source: Computed from OECD Stat Extract and The Conference Board. 2015. The Conference Board Total Economy Database™, May 2015, http://www.conference-board.org/data/economydatabase/

The Swedish and Danish actual and equilibrium unemployment rates since 1962

The Danish equilibrium unemployment rate has been surprisingly stable since 1982 despite rather volatile actual unemployment. The Swedish unemployment rate was allowed to increase in line with the economic crisis in the early 1990s and that was it. How nice it must be for the Danes and Swedes to have such stable labour market institutions.

Source: OECD Economic Outlook November 2015.

The Danes have a highly deregulated labour market. There were major economic and welfare state reforms in Sweden in the early 1990s in response to high unemployment. These institutional developments barely showed up in their equilibrium unemployment rates.

Previous Older Entries Next Newer Entries

Thoughts from the North

Celebrating humanity's flourishing through the spread of capitalism and the rule of law

Fardels Bear

A History of the Alt-Right

Vincent Geloso

Econ Prof at George Mason University, Economic Historian, Québécois

Bassett, Brash & Hide

Celebrating humanity's flourishing through the spread of capitalism and the rule of law

Truth on the Market

Scholarly commentary on law, economics, and more

The Undercover Historian

Beatrice Cherrier's blog

Matua Kahurangi

Celebrating humanity's flourishing through the spread of capitalism and the rule of law

Temple of Sociology

Celebrating humanity's flourishing through the spread of capitalism and the rule of law

Velvet Glove, Iron Fist

Celebrating humanity's flourishing through the spread of capitalism and the rule of law

Why Evolution Is True

Why Evolution is True is a blog written by Jerry Coyne, centered on evolution and biology but also dealing with diverse topics like politics, culture, and cats.

NoTricksZone

Celebrating humanity's flourishing through the spread of capitalism and the rule of law

Homepaddock

A rural perspective with a blue tint by Ele Ludemann

Kiwiblog

DPF's Kiwiblog - Fomenting Happy Mischief since 2003

The Dangerous Economist

Celebrating humanity's flourishing through the spread of capitalism and the rule of law

Watts Up With That?

The world's most viewed site on global warming and climate change

The Logical Place

Tim Harding's writings on rationality, informal logic and skepticism

Doc's Books

A window into Doc Freiberger's library

The Risk-Monger

Let's examine hard decisions!

Uneasy Money

Commentary on monetary policy in the spirit of R. G. Hawtrey

Barrie Saunders

Thoughts on public policy and the media

Liberty Scott

Celebrating humanity's flourishing through the spread of capitalism and the rule of law

Point of Order

Politics and the economy

James Bowden's Blog

A blog (primarily) on Canadian and Commonwealth political history and institutions

Science Matters

Reading between the lines, and underneath the hype.

Peter Winsley

Economics, and such stuff as dreams are made on

A Venerable Puzzle

"The British constitution has always been puzzling, and always will be." --Queen Elizabeth II

The Antiplanner

Celebrating humanity's flourishing through the spread of capitalism and the rule of law

Bet On It

Celebrating humanity's flourishing through the spread of capitalism and the rule of law

History of Sorts

WORLD WAR II, MUSIC, HISTORY, HOLOCAUST

Roger Pielke Jr.

Undisciplined scholar, recovering academic

Offsetting Behaviour

Celebrating humanity's flourishing through the spread of capitalism and the rule of law

JONATHAN TURLEY

Res ipsa loquitur - The thing itself speaks

Conversable Economist

In Hume’s spirit, I will attempt to serve as an ambassador from my world of economics, and help in “finding topics of conversation fit for the entertainment of rational creatures.”

The Victorian Commons

Researching the House of Commons, 1832-1868

The History of Parliament

Articles and research from the History of Parliament Trust

Books & Boots

Reflections on books and art

Legal History Miscellany

Posts on the History of Law, Crime, and Justice

Sex, Drugs and Economics

Celebrating humanity's flourishing through the spread of capitalism and the rule of law

European Royal History

Exploring the Monarchs of Europe

Tallbloke's Talkshop

Cutting edge science you can dice with

Marginal REVOLUTION

Small Steps Toward A Much Better World

NOT A LOT OF PEOPLE KNOW THAT

“We do not believe any group of men adequate enough or wise enough to operate without scrutiny or without criticism. We know that the only way to avoid error is to detect it, that the only way to detect it is to be free to inquire. We know that in secrecy error undetected will flourish and subvert”. - J Robert Oppenheimer.

STOP THESE THINGS

The truth about the great wind power fraud - we're not here to debate the wind industry, we're here to destroy it.

Lindsay Mitchell

Celebrating humanity's flourishing through the spread of capitalism and the rule of law

Alt-M

Celebrating humanity's flourishing through the spread of capitalism and the rule of law