
Real business cycles, the declining clarity of information and learning by waiting
22 Dec 2014 Leave a comment
in business cycles, entrepreneurship, job search and matching, macroeconomics Tags: real business cycles
Willems and van Wijnbergen (2013) identified reduced clarity in information about business cycle fluctuations as a factor that is the lengthening the lag in the response of employment to output changes in recent US recessions.
Willems and van Wijnbergen (2013) – ungated – found that the trough in employment in the 1991 and 2001 recessions was much later than the troughs for earlier US recessions.
- There was a stronger immediate reduction in employment in pre-1990 US recessions and a faster recovery, so the 1991 and 2001 recessions were initially job-preserving – the rate at which workers were laid off was less than in prior recessions.
- Employment in the 1991 and 2001 recessions continued to fall for another year after the trough in output.
- The job-preserving recessions in 1991 and 2001 were then followed by this delayed recovery in employment growth.
- There is a lengthening labour adjustment lag that slows the loss of jobs at the start of recessions and delays the renewal of recruitment at the end of recessions.
Willems and van Wijnbergen (2013) attributed this combination of job-preserving recessions and delayed employment recoveries in 1991 and 2001 to the interaction of rising labour adjustment costs and a reduction in the clarity of entrepreneurial information about the business cycle.
The rising labour adjustment costs arose from the capital losses to employers of laying off employees who are increasingly rich in firm-specific human capital. The risks of laying off and investing precipitously have increased in recent decades because output growth subsequent to the great moderation in real output growth volatility is less predictable.
The US economy experienced a 50% reduction in volatility for many leading macroeconomic variables as well as low inflation since the early to mid-1980s. Similar declines in the real volatility and inflation rates occurred at about the same time in other industrial countries.
Prior to the mid-1980s, US real output growth was more variable, but this variation was more predictable. Frequent recessions were soon followed by recoveries. Since the early to mid-1980s in the US, major variations in real GDP growth have come increasingly as genuine surprises – 1983–2007 was one long boom punctuated by two mild recessions in 1991 and 2001.
The delay in the official dating of the peaks and troughs in business cycles in the US has increased from an average of 7½ months before 1990 to about 15 months in the post-1990 period (Willems and van Wijnbergen 2013).

With recessions more of a surprise – and the scope and depth of the panic of 2008 is an example of such a surprise in New Zealand and abroad – the value of waiting for better market information has increased.

Less certain information makes it more profitable than before for entrepreneurs to invest in waiting before laying off increasingly human capital-rich employees, making new investments and undertaking fresh recruitment. The impact of the business cycle on employment will be more muted.
Modern recessions can be initially job-preserving – layoffs are postponed for longer because the rising cost of laying off experienced labour is higher and because of the increased value of waiting to see. Recoveries in employment can be more sluggish as investors wait to be sure about the latest trends. These employers can use the employees they hoarded in larger numbers in the downswing to fill orders in the early days of the upswing in business:
We have presented evidence that the lag with which labour input reacts to structural economic shocks went up in the 1980s, thereby bringing jobless recoveries and recessions that were relatively job preserving to the US economy.
Using a real option model, this lagged response is shown to be optimal in a setting where labour input is costly to adjust and where employers are uncertain about the persistence of shocks that drive the business cycle
What’s the difference between inflation and counterfeiting? The Portuguese banknote caper
21 Dec 2014 Leave a comment
in economics of crime, entrepreneurship, monetary economics Tags: Counterfeiting, fraud, swindles

Robert Barro recounts in his macroeconomics textbook a marvellous example where swindlers induced a British manufacturer of bank notes to print and deliver to them 3 million pounds’ worth of Portuguese escudos, which was equivalent to about 1% of Portugal’s nominal GDP in 1926.
This company, Waterlow and Sons Ltd. of London, also printed the legitimate notes for the Bank of Portugal. These bogus notes were,at first pass, indistinguishable from the real thing (except that the serial numbers were duplicates of those from a previous series of legitimate notes).

It was impossible to differentiate between the original and most of the duplicate banknotes because they were printed by the same printer using the same plates. 135,318 of the duplicate notes could be identified as part of the swindle because they were printed on plates not used for any other Portuguese banknotes. These bogus notes printed with the new plates could be differentiated from older legitimate banknotes because of a few marks that could be identified by an expert using a magnifying glass.
Central to the scam was taking advantage of the practice of the privately owned Bank of Portugal of secretly printing banknotes and neither recorded such transactions in the books, nor informing the government of the increase in the number of circulating banknotes.
(At the time, the Bank of England was also privately owned and only in 1921 had it obtained a monopoly on the issue banknotes in England and Wales. The Bank of Scotland still prints Scottish banknotes that are not legal tender in England. Three northern Irish banks still print banknotes that are legal tender in Northern Ireland. The entire northern Irish currency was withdrawn from circulation after a major bank robbery by the IRA a few years ago and replaced with new notes).
After the scheme unravelled, the Bank of Portugal made good on the fraudulent notes by exchanging them for newly printed, valid notes. The fraud may have contributed to the military coup, some six months later.
In the interim, by illegally increasing the monetary base and investing heavily in currency, land, building, and businesses, the swindlers created a boom in the Portuguese economy.

From the standpoint of monetary economics, I cannot think of a more unanticipated monetary shock. Of a surprise burst of monetary inflation and price inflation and led to the writing of books with titles such as The Man who Stole Portugal.
The final part of the swindle was to actually buy a controlling interest in the Bank of Portugal to validate the fraud by erasing all records that might inconvenience the swindlers.
The chief swindler with accomplices set up a bank of his own to facilitate fast distribution of the forged currency. A bank of their own was necessary because they had the modern equivalent of $150 billion to launder.
This Bank of Angola & Metropole set up to launder the bogus notes was also the initial place of suspicion of something fishy going on because it grew so quickly, while taking no deposits. Germans are also involved with this bank. Germany was suspected by the Portuguese government to have ambitions to take over Portuguese Angola, so this attracted additional attention from the authorities.
The chief swindler, Alves Reis, was depicted in a 50-episode TV series in 2000 as well as several books about the fraud over the decades.

At the time of the swindle, Reis was 28 years old engineering dropout from an undistinguished middle-class Lisbon family. He already had a conviction for cheque fraud. As such, one of the greatest swindles of all time was pulled off by a petty conman.
The swindle unravelled because of the duplicate banknote serial numbers, which was an error the swindler made himself. But for that, the swindle would have been immensely difficult to uncover. The swindlers duplicated the existing serial numbers and hoped they were able to successfully release all the banknotes before they were caught.
Reis, the architect of the swindle, work out the sequence of bank governor names and serial numbers used by the Portuguese central bank, but had neglected to eliminate numbers already ordered.
When the British printer realised this, Reis convinced the London firm that the reuse of existing serial numbers for their purported place of circulation in the Portuguese colony of Angola was not a cause for alarm. Fortunately for the swindlers, a letter from the British printers to the Banco de Portugal, in that he spoke about the agreements to print the banknotes for distribution in Angola went missing in the post.
The Bank of Portugal was not supposed to issue its currency in Angola, but often did circulate its currency in Angola.
This was a clever part of the swindle. By pretending that the Bank of Portugal was doing something slightly dodgy but still standard practice, and thus had to do so in secrecy, the swindlers could induce a whole range of other more legitimate people than them to cooperate quietly with what they were doing.
The shady nature of these dealings to surreptitious circulate Bank of Portugal banknotes in Angola stamped with “Angola” was passed over by the British dupes to the swindle as another example of the corruption of Portuguese officials. The stamp “Angola” was so they wouldn’t be confused with notes from the mother country.
In addition, bank notes for the Portuguese colonies were printed at the time by a competitor. The British printer saw this on the quiet contract as an opportunity to take away some of their trade.
The swindlers said that they would take care of stamping “Angola” on the banknotes once they were delivered to them. The swindlers had accomplices in the Portuguese diplomatic service, who issued them with fake diplomatic passports, which was helpful in persuading the British printers to deliver the bogus banknotes personally to them. Consignments were delivered to the swindlers in February, March and November 1925.
the basis of the scam was forging a contract in the name of Banco de Portugal authorising Reis to print banknotes in return for an alleged loan from a consortium to develop Angola. The whole affair had to be kept secret lest Angola fall into further financial difficulties due to rumours of a pending economic ruin.
The London based specialty printer worked, for among other clients, for the English court system and printed the transcripts of its own trial! This printer tried to have the trial postponed for a year while its chief executive completed his one-year term as Lord Mayor of London to save embarrassment.
The British printing company was found liable in subsequent four years of litigation, but the key question for the court was the amount of damages.
- The Bank argued that the damages were £1 million (less funds collected from the swindlers).
- The British printer duped by the swindlers argued was that the only true costs to the Bank were the expenses for paper and printing of the replacement notes.
The House of Lords determined in 1932 that £610,000 was the correct measure. This award of damages was the £1 million less the funds recovered from the swindlers
The proper measure of damages, in the view of the majority of the Law Lords, was the face value expressed in sterling of the genuine currency given in exchange for the spurious notes.
As these damages would be paid initially in British pounds, this damages award was a real windfall for the Bank of Portugal. Worthless Portuguese banknotes exchanged for good British pounds that could buy imports.
The majority decision of the Law Lords was the correct measure of damages because that is what the bank had to outlay to make itself whole again after the breach of contract. The chief swindler got 20 years.
One of the two Law Lords in dissent had another view of the proper measure of damages:
The judgment of Wright J. should be set aside and judgment entered for the Bank for the sum of £8,922
This law lord and an appeal court justice held this view because the swindle cost the Bank of Portugal nothing bar printing costs to replace the spurious banknotes, which were widely accepted as valid currency in a cash economy.
The Bank of Portugal could issue banknotes in any number at little cost to itself up to the limit provided by Portuguese law. Ropke wrote that:
The English courts presently discovered that the case involved issues of unusual subtlety and complexity, adjudication of which necessitated the admission of testimony by leading monetary theorists.
The question before the courts was: how great were the actual losses incurred by the Bank of Portugal?
If it had been postage stamps instead of bank notes in which the swindlers had trafficked, it is perfectly clear that the loss of the Portuguese government would have equalled the total value of the stamps.
With respect to the bank notes, however, no such simple calculation could be made.
Among the many questions which troubled the experts the following stand out as particularly relevant to our study: would the Bank of Portugal have issued the same amount of notes even if the swindlers had not done so?
If not, was the increase in the supply of money resulting from the introduction of the fraudulent notes good or bad for Portugal?
No one disputes, as several of the Law Lords noted, that the theft of a postage stamp must be made good at face value. People hesitate in this case involving swindling access to banknote plates and printing currency for yourself because what exactly was stolen?
When Reis died in 1955 , The Economist said of the counterfeiting scheme:
The perpetrators, however reprehensible their motives, did Portugal a very good turn according to the best Keynesian principles.
The House of Lords case is a major British legal precedent regarding the duty of the wronged party to mitigate damages in the case of breach of contract.

The House of Lords held that this duty did not apply if it would give your business a bad name in the trade. The Bank of Portugal could have repudiated the duplicate banknotes rather than exchange them for genuine new notes, but chose not to do so because this repudiation of banknotes would have ruined what little reputation it had.
The House of Lords also upheld the right of the wronged party to choose between different methods to mitigate damages from the breach of contract.
Did the World Bank just solve the puzzle of low NZ growth relative to Australia?
20 Dec 2014 1 Comment
in economic growth, macroeconomics, politics - New Zealand Tags: lost decades

The World Bank published a major 300 odd page report that discussed puzzles of economic growth around the world included a chapter on New Zealand’s slow economic growth relative to Australia.
The World Bank publication is copyrighted 2015, so I assume that it has been published very recently. However, the data analysis in the chapter on New Zealand stop in 2002.
The conclusions of the World Bank with regard to the emergence of the trans-Tasman income gap were as follows:
The extent of economic freedom—as determined by propelling institutions—evolved in a similar manner in both countries.
The small differences in propelling institutions in both countries mostly netted out and as such cannot account for the differences in economic performance.
One exception was the fiscal position of the state—a rise in public expenditure after the first oil crisis entailed increased tax burdens in both countries.
A particularly sharp rise in taxation in New Zealand (in comparison to Australia) occurred during the country’s second downturn.
Differences in the size of the public sector figure prominently in the analysis of the World Bank of the emergence of the trans-Tasman income gap. The measure by the World Bank of the size of the public sector in New Zealand and Australia is reproduced below – its figure 3.3.
Figure 3.3 Government expenditure in Australia and New Zealand, 1970–2002
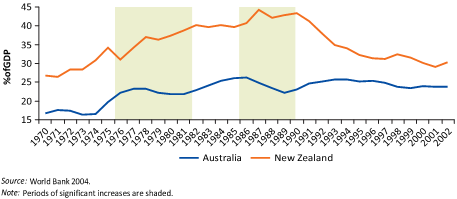
In particular, the World Bank was concerned about the rapid growth in the size of the public sector in New Zealand while the size of the public sector was shrinking in Australia:
In 1977–82 Australia’s government expenditure rose more slowly than that of New Zealand (and in 1975–80 Australia’s expenditure was smaller than New Zealand’s by 13 percent of GDP.
Then, as relative economic growth declined in New Zealand, between 1987 and 1990 public expenditure increased by around 5 percent of GDP from the 1982–86 level. In the meantime, public expenditure in Australia fell by 4 percent of GDP.
As a result, the difference in the general government expenditure level between New Zealand and Australia increased to over 18 percent of GDP in 1987–90.
After 1990 and until 2002 government spending in New Zealand decreased steadily—from approximately 44 percent of GDP in 1990 to roughly 30 percent of in 2002.
In Australia this expenditure was maintained at an average of 25 percent of GDP over the same period (see figure 3.3 with highlighted periods of significant increases of government expenditures in New Zealand).
A spike in the size of state sector in the 1980s may explain a delay in productivity growing rapidly again, but the state sector in New Zealand is now smaller.
Indeed, figure 3.3 above shows that the public sector in New Zealand as measured by general government expenditure has fallen by a quarter in size, by 10 percentage points of GDP in a matter of seven years between 1990 and 1996. There should be rapid growth because of the greatly reduced crowding out by the state sector but that rapid growth is not there.
Figure 2 shows that GDP growth per working age New Zealander resumed at its trend rate of 2% after 1992. This resumption of growth was in conjunction with the decline in the size of public sector tax burden rather than after it. Figure 2 shows that there was no significant growth in real GDP per working age New Zealander from 1974 to 1992. New Zealand lost almost two decades of productivity growth. Real GDP per New Zealander aged 15-64 on a purchasing power parity basis dropped from equality with Australia up until 1974 to a 30 per cent gap by 1992.
Figure 2: Real GDP per New Zealander and Australian aged 15-64, converted to 2013 price level with updated 2005 EKS purchasing power parities, 1956-2012
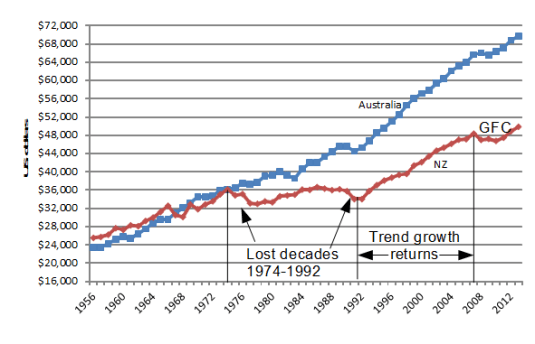
Source: Computed from OECD Stat Extract and The Conference Board, Total Database, January 2014, http://www.conference-board.org/economics
There was no growth rebound when the burden of an oversized public sector was lifted. That is the greater puzzle. The World Bank did not address that greater puzzle. If there is a global pool of useful technological knowledge accessible at a low cost by suitably prepared people, what stops New Zealand from using this knowledge to grow faster until it catches-up with Australia and the USA?
Another puzzle for the World Bank is that it is using general government expenditure estimates by the OECD.
When tax revenue as a percentage of GDP is used to measure the size of the public sector and the burden on private sector initiative, figure 3 shows that the tax burden in the two countries is not that different and is in the low 30% range, not the 40% plus range as is suggested by the general government expenditure data in Figure 3.3.
Figure 3: tax revenue as a percentage of New Zealand and Australian GDP, 1965-2011
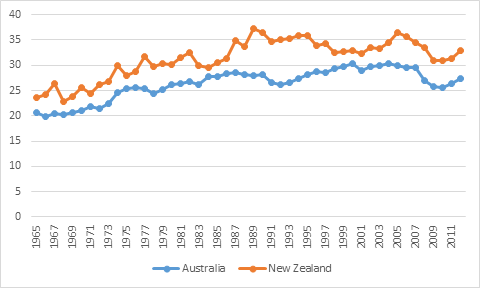
Source: OECD Stats
There are no 14 point gaps in tax burdens in figure 3 as suggested in the World Bank’s analysis. This is because the World Bank’s using general government expenditure shown in its figure 3.3 reproduced above.
A major conclusion about the causes of New Zealand’s poor growth performance in the last few decades should be robust to different measures of the size of the public sector, but it is not.
Economic reforms returned real GDP growth per New Zealander aged 15-64 from no growth from 1974 to 1992 to the previous two per cent trend rate from 1993. There was no sustained productivity growth rebound beyond 2 per cent growth a year for New Zealand to recover the lost ground in the 1980s and 1970s. That is the great puzzle that the World Bank did not address, much less solve.
Henry Hazlett on the fiscal stimulus and other manifestations of the broken window fallacy
19 Dec 2014 1 Comment
in applied welfare economics, fiscal policy, macroeconomics Tags: broken window fallacy, fiscal stimulus, Henry Hazlett

The role of news in real business cycles
18 Dec 2014 Leave a comment
in business cycles, economic growth, entrepreneurship, job search and matching, macroeconomics Tags: real business cycles
Revisions in investor beliefs about productivity prospects can partly account for business expansions and contractions. If favourable news about future technological opportunities can seed a boom today in consumption and investment before the actual technological improvement arrives and is realised, news that future productivity growth may not be as good as was previously expected can induce a recession without any actual change in productivity ever occurring.
Investors build in anticipation, starting new projects and recruiting more staff. Their forecasts can turn out to be too optimistic. When entrepreneurial expectations of future productivity are revised, investment demand can fall because of an excess in capital accumulation – recent investments were made under more optimistic beliefs about productivity (Beaudry and Portier 2004).
Investment demand must be muted for a time until the excess capital accumulation is brought into use, refitted or scraped. There also will be layoffs and a lull in recruitment. Job search strategies must also change as job seekers redirect their careers in light of the news about their revised prospects in different firms, industries and competing occupations.

The optimism and pessimism of investors are rational profit-seeking responses to new entrepreneurial knowledge. Profit expectations reflect consumer preferences, resource constraints and technological factors as they exist and are forecast to change and actual and forecasted opportunities and constraints in the investment sector. Entrepreneurs are dynamic risk takers who profit from anticipating shifts in consumer demand, input costs and technology.
Recessions and booms can arise due to the challenges facing entrepreneurs in forecasting the uncertain and ever-changing future demand for new capital that is implied by their forecasts of consumer demand and technological opportunities as Beaudry and Portier (2004) explain:
The view that recession and booms may arise as the result of investment swings generated by agents’ difficulties to properly forecast the economy’s need in terms of capital has a long tradition in economics.
For example, this difficulty was seen by Pigou as being an inherent feature of any economy with technological progress.
As emphasized in Pigou (1926), when agents are optimistic about the future and decide to build up capital in expectation of future demand then, in the case where their expectations are not met, there will be a period of retrenched investment which is likely to cause a recession.
Revisions in entrepreneurial beliefs and investment plans can be required when new information is uncovered (Beaudry and Portier 2004; Sill 2009). There can be lulls in investment demand following these revisions to entrepreneurial forecasts leading to recessions. As Pigou noted in 1927:
The varying expectations of business men … constitute the immediate cause and direct causes or antecedents of industrial fluctuations
Robert Lucas and where have all the small entrepreneurs gone?
18 Dec 2014 1 Comment
in applied welfare economics, economics of regulation, entrepreneurship, industrial organisation, Robert E. Lucas, survivor principle, theory of the firm Tags: entrepreneurship, firm entry, firm exit, occupational choice
Robert Lucas predicted the decline in the number of small business people and small firms in 1978. The number of small firms will fall and the number of large firms will rise with increases in real wages (Lucas 1978; Poschke 2013; Gollin 2008; Eeckhout and Jovanovic 2012).
Lucas closed his 1978 discussion of the size distribution of firms, and how firms are getting larger an average over the course of the 20th century, with a discussion of a lovely restaurant he visited on the Canadian border. He predicted that in couple of decades time, these type of restaurants will be fewer.
Nations that are more productive over time and have higher wages because they have accumulated more capital per worker.
One consequence of more capital per worker is real wages increase at a faster rate than profits (Gollin 2008; Eeckhout and Jovanovic 2012). For example, the rate of return on capital was stable over the 20th century while real wages increased many fold (Jones and Romer 2010). This relationship turns out to be crucial in terms of occupational choice and the decision to become an entrepreneur – a small business owner
Higher wages reduces the supply of entrepreneurs and increases the average size of firms because entrepreneurship becomes a less attractive occupational choice (Lucas 1978; Gollin 2008; Eeckhout and Jovanovic 2012).
For example, in the mid-20th century, many graduates who were not teachers were self-employed professionals. With an expanding division of labour because of economic growth, many well-paid jobs and new occupations emerged for talented people in white-collar employment.
OECD countries richer than New Zealand should have less self-employment and more firms that are large because paid employment is an increasingly better-rewarded career option for their high skilled workers.
The U.S. had the second lowest share of self-employed workers (7 per cent) in the OECD in 2010 – the latest data – which is less than half the rate of New Zealand self-employment (16.5 per cent) in 2011 (OECD 2013). The Australian self-employment rate was 11.6 per cent in 2010 (OECD 2013).
A companion reason for larger average firm sizes in countries richer than New Zealand is more capital-intensive production can prosper in larger corporate hierarchies than can labour-intensive production (Lucas 1978; Becker and Murphy 1992; Poschke 2011; Eeckhout and Jovanovic 2012).
The more able entrepreneurs can run larger firms with bigger spans of control in richer countries because their employees can profitably use more capital per worker with less supervision. The diseconomies of scale to management and entrepreneurship should rise at a faster rate in less technological advanced countries such as New Zealand because they are more labour intensive economies (Lucas 1978; Becker and Murphy 1992; Poschke 2011; Eeckhout and Jovanovic 2012).
Importantly, the more able entrepreneurs benefit most from introducing frontier technologies because they can deal more easily with their increased complexity and more uncertain prospects (Poschke 2011; Lazear 2005; Shultz 1975; 1980). Growing technological complexity reduces the supply of entrepreneurs because it takes longer to acquire the necessary balance of skills and experience needed to lead a firm (Lazear 2005; Otani 1996).
The more marginal entrepreneurs will switch to be employees as technology advances so the average size of firms will increase. The entrepreneurs that remain in business will be the most able, more skilled and more experienced entrepreneurs and will be more capable of running larger firms that pioneer complex, frontier technologies (Poschke 2011; Lazear 2005, Otani 1996; Lucas 1978).
Countries more technologically advanced than New Zealand will have both larger firms and less self-employment because of growing technological complexity.
The greater is the exposure to foreign competition, the smaller is the fraction of self-employed and small firms in a country (Melitz 2003; Díez and Ozdagli 2012). More foreign competition increases wages because of lower prices, which makes self-employment less lucrative. More exporting favours larger firms both because of the fixed costs of entering export markets and because the stiffer competition will weed-out the lower ability entrepreneurs who run the smaller firms (Melitz 2003; Díez and Ozdagli 2012).
Other factors can countermand the effects that occupational choice, frontier technologies, exporting and capital intensity have to increase the average size of firms as real wages rise.
For example, tax and regulatory policies reduce the average size of firms in many EU member states to levels that are similar to New Zealand. The EU is less likely to have large firms in its labour intensive sectors. Employment protection laws, product market and land use regulation and in particular, high taxes stifled the growth of labour intensive services sectors in the continental EU (Bertrand and Kramatz 2002; Bassanini, Nunziata and Venn 2009; Rogerson 2008).
EU firms are are more capital intensive with fewer employees than otherwise because labour is so expensive to hire in the EU. Small and medium sized firms can struggle to grow in much of the EU because of regulatory burdens that phase in with firm size (Garicano, Lelarge and Van Reenen 2012; Hobijn and Sahin 2013; Rubini, Desmet, Piguillem and Crespo 2012). Average firm sizes are 40% smaller in Spain and Italy than in Germany. Obstacles to firm growth originate in product, labour, technology and financial and the binding constraints differ from one EU member state to another (Rubini, Desmet, Piguillem and Crespo 2012).
Average firm sizes in the USA and UK may be larger because of fewer tax and regulatory policies that limit business growth. Bartelsman, Scarpetta and Schivardi (2005) found that new entrants in the U.S. started on a smaller scale than in Europe but grew at a much higher rate. This willingness to experiment on a smaller scale was worth the risk because the payoff was much larger in terms of growth in the more flexible U.S. markets.
In summary, many factors drive the size distribution of firms countries including taxation and regulation. Underlying this, nonetheless, is Lucas’s point from 1978 that rising real wages makes starting a small business a less inviting occupation choice.

Interview with Robert Lucas on the global financial crisis and the great recession
17 Dec 2014 Leave a comment
in budget deficits, business cycles, economic growth, fiscal policy, global financial crisis (GFC), great depression, great recession, macroeconomics, monetarism, monetary economics Tags: bank runs, GFC, great depression, great recession, Robert E. Lucas
Real business cycles and learning the value of major technological changes
17 Dec 2014 Leave a comment
in business cycles, entrepreneurship, macroeconomics, technological progress Tags: boom and bust, general purpose technologies, real business cycles
The true value of any technological improvement is uncertain. Investors adopt a new technology after forecasting the likely productivity of the new technology. Investor learning in the face of imperfect information about the true value of major new technologies can also lead to business cycle fluctuations (Li 2007).

As a new technology slowly diffuses, entrepreneurs learn more about the true potential of the new technology and re-evaluate in hindsight whether they have invested beyond the optimal amount. If entrepreneurs have not over-invested, they revise their beliefs about the magnitude of the innovation and invest more.
Because the agents have to learn the magnitude of the technology shock, they are cautious in making investment decisions before they have learned much about the underlying technology. Consequently, GDP growth is gradual, which stretches out the length of booms.
When entrepreneurs later find that investment has over-shot the optimal amount, they reduce investment demand perhaps sharply and start a recession (Li 2007). This eventuality may seed a recession within many major technology advances such as the IT boom in the 1990s and the computer revolution in the 1970s.
The true value of the major technological improvement is often discovered only after investment over-shoots the optimal level (Li 2007). A general technological innovation affecting many industries is required for the cluster of entrepreneurial errors about the true magnitude of the productivity increase to seed a recession (Li 2007).
The 2001 US recession followed a long boom involving major new information and communication technologies that raised the productivity of many existing technologies. The information, communications and software boom lasted over a decade in the US (Li 2007).

Entrepreneurs invested gradually in new information and communication capital to learn more about the underlying technologies that they embodied. These new information and communication technologies were productivity improvements of a major but uncertain scope (Li 2007).
The eventual productivity gains come from two complex sources – both from adopting the new technology itself and from its interface with existing capital and expertise. Because both productivity gains must be forecasted and because both are discovered only by experimentation and learning by doing, it is entirely possible that entrepreneurs can invest ahead of consumer demand.
This surplus capacity will emerge despite the best efforts of investors to mitigate this risk by staggering investments to learn more about the true value of the new technology. This investor caution and staggering to allow for more learning is an important factor that stretches out the length of investment booms in major new technologies (Li 2007).

There was a sharp decline in US investment in 2001, with large accumulations of unused capital in some sectors. For example, 90% of the optical fibre laid in the US in the 1990s was unused in the years that followed. Entrepreneurs discovered the optimum investment level in, for example, optical cable fibre by investing past it and revised plans for further investments in light of this over-shooting (Li 2007).

Real business cycles of a significant magnitude can emerge simply from technological learning.
Li (2007) argued that many investment booms start with the advent of a revolutionary technology and ended with overinvestment. For example, canal building boomed after the invention of the steamboat, and by the year 1860 more than 4,000 miles of canal had been completed. However, many of these canals did not live up to the expectations of their promoters. Many of these projects eventually turned out to be financial failures.
Later in the same century, the railroad expansion shared a similar fate. Thousands of miles of railroad were built and left unused or under used, a phenomenon described by Schumpeter (1949) as construction “ahead of demand.”
That real business cycle theory required technological regress for there to be recessions is one of its oldest criticisms. That criticism that standard equilibrium business cycle models have difficulties in predicting the investment boom and overshooting grows weaker by the day.
Li presents a strong internal propagation mechanism with respect to technology shocks and endogenous recessions without invoking technological regress:
…firms invest in new capital to take advantage of the IT revolution, without knowing the limit to which this new technology can increase productivity.
The belief of this limit becomes increasingly optimistic over time as investors repeatedly realize that they have not invested enough to exhaust the potential of the new technology. Such belief revisions lead to increasingly aggressive investment and a capital overhang, followed by a recession.

Recent Comments