
Robert Lucas on Depression era policies and current financial crisis
14 Dec 2014 Leave a comment
in global financial crisis (GFC), great depression, great recession, macroeconomics, Robert E. Lucas Tags: great depression, great recession, Robert Lucas
WH Hutt on job search
14 Dec 2014 Leave a comment
in job search and matching, labour economics, macroeconomics, unemployment Tags: job search, search and matching, unemployment, voluntary unemployment
 Unemployment, job search, search and matching
Sector specific technology and demand shocks and the business cycle
14 Dec 2014 Leave a comment
in business cycles, job search and matching, macroeconomics Tags: natural rate of unemployment, real business cycle, sectoral shocks
New technologies unfold daily, and consumer tastes change with rising incomes and the arrival of new products. Jobs will open in the expanding industries and disappear in the shrinking sectors.
A quarter or more of unemployment rate fluctuations over the business cycle could be due to variations in the rate that labour demand shifts across sectors. These sectoral reallocations in labour demand do not arise from mismatches between entrepreneurial forecasts and actual consumer demand.
The higher unemployment rate is not due to a bunching of technological upgrades in a recession. The above average number of sectoral shifts in labour demand is an independent cause of a temporarily higher natural rate of unemployment.
Lilien (1982) suggested that the amount of labour reallocation can change over time. Some periods may be marked by relatively homogeneous growth in labour demand across sectors, whereas others may be characterized by shifts in the composition of labour demand.
Lilien (1982) provided empirical estimates of the variation in the equilibrium unemployment rate from sectoral reallocation. He concluded that the wide unemployment fluctuations in the 1970s were largely induced by unusual structural shifts in the U.S. economy, which caused the equilibrium unemployment rate to fluctuate by about 3 percentage points over the decade!

An important factor behind business fluctuations arises not from the balance between aggregate output and aggregate consumption, but from the accuracy of entrepreneurial matching of the individual patterns of output with the pattern of actual consumer demand in individual sectors (Black 1987, 1995).
Fluctuations in the match between resource deployment to different sectors and product demand across sectors can create major fluctuations in output and employment because moving resources from one sector into another is costly and time consuming.
To a significant extent, observed fluctuations in the unemployment rate can be fluctuations in the natural rate of unemployment rather than deviations from that natural rate due, for example, to aggregate demand shocks. There will always be some unemployment. There will be new labour force entrants looking for jobs and workers who are between jobs.
The natural rate of unemployment is a long-run level of unemployment that cannot be altered by monetary policy. The natural rate of unemployment depends on the flexibility of wage contracts and labour market institutions, variations in labour demand and supply in individual markets, demographic change, the mobility of workers, unemployment benefits, the cost of gathering information about vacancies and available labour, labour market regulation and random variations in the rate of reallocation of jobs across industries and regions as technology advances and consumer tastes change.
Sectoral shifts in labour demand has a randomness about them because the size, pace and diffusion of technological advances across firms and industries is uneven (Andolfatto and MacDonald 1998, 2004).
The implications of technological progress for jobs has a further randomness because new technologies can displace existing jobs and create new jobs or renovate and update current equipment and employee skills (Mortensen and Pissarides 1998).
As a new technology diffuses, productivity will grow faster in the sectors that are adopting the new technology. During this implementation phase, which is slow, costly and may require considerable learning, there will be reorganisations to capitalise on the impending productivity gains. New technologies differ in the size of the improvement over existing methods and designs and in the difficulty of adopting the new methods. There will be lower growth in years where new technologies offer comparatively minor or less broadly applicable improvements on existing methods. Learning consumes resources, and attempts to learn a new technology through innovation or imitation diverts the resources of firms and workers away from production (Andolfatto and MacDonald 1998, 2004).
This unevenness in the pace and sectoral diffusion of technological progress will introduce unevenness in the rate of labour reallocation across sectors.
With both growing and shrinking sectors, employment may stagnate or fall for a time because the unemployed are searching for new jobs in different industries and perhaps in new occupations or are retraining.
A revival in growth in output and productivity in conjunction with initially poor employment growth is possible and has the attributes of a delayed recovery in employment (Andolfatto and MacDonald 2004).
Cross-sector job searches and the redirection of careers is a longer process than job search in the same industries and occupations. Job migration is more time consuming than the more traditional process of layoffs and rehiring by the same employer or in the same industry and occupation.
During periods of more intensive or above-average sectoral reallocation of labour demand, a mismatch can arise between the skills and experience of the workers who have exited the shrinking sectors and the immediate requirements of the expanding sectors. More workers than average can be moving into new sectors. Some of these job seekers may not be immediately viable candidates for the available jobs and may exert little downward pressure on wages.
There can be mismatch unemployment because the skills and locations of job seekers can be poorly matched with the locations of vacancies. Some local labour markets will have more workers than jobs. Others will have shortages. Job finding can depend on the rate at which the unemployed can retrain or move to locations with unfilled jobs, the rate at which jobs open in different locations and the rate at which workers vacate jobs in places with ready replacements (Shimer 2007).
Cyclical unemployment is a reversible response to lulls in aggregate demand. At the start of a recession, there is a general decline in demand, with few industries creating jobs to replace those that are lost.
As a recession ends, the unemployed are recalled by old employers or find new jobs in those industries as demand renews. Monetary and fiscal policy can aim to smooth these temporary job losses.
Job losses from structural changes in employment and technology are permanent. The sectoral location of jobs has changed. Workers must switch to new industries, sectors and locations or learn new skills.
A role for public policy is to facilitate this process of reallocation to new jobs and retraining.
Critics of the sectoral shifts approach point to the inherent difficulties of distinguishing between sectoral and cyclical movements in unemployment, due to cross-industry differences in sensitivity to aggregate fluctuations.
Does inequality lead to a financial crisis? | VOX, CEPR’s Policy Portal
13 Dec 2014 Leave a comment
in business cycles, economic growth, global financial crisis (GFC), great recession, macroeconomics Tags: GFC, top 1%
Figure 1. Change in loans versus changes in top 1% income shares, 14 countries, 1972–2008

via Does inequality lead to a financial crisis? | VOX, CEPR’s Policy Portal.
Milton Friedman – Abolish The Fed
13 Dec 2014 Leave a comment
in macroeconomics, Milton Friedman, monetarism, monetary economics Tags: Milton Friedman, The Fed
Ideas and Growth Lecture with Nobel Laureate Robert E. Lucas Jr
12 Dec 2014 1 Comment
in economic growth, fiscal policy, macroeconomics, Robert E. Lucas Tags: ideas and growth, Robert E. Lucas
An Economic Explanation for Putin’s Recklessness
12 Dec 2014 Leave a comment


Recessions as reorganisations
12 Dec 2014 Leave a comment
in business cycles, F.A. Hayek, history of economic thought, job search and matching, macroeconomics, Robert E. Lucas, unemployment Tags: FA Hayek, recessions, recoveries, Robert Lucas

Most models of the shape of recoveries draw on a learning process. A long tradition in business cycle theory holds that limited knowledge of relative price changes can temporarily disrupt labour demand and supply because of errors in wage and price perceptions (Alchian 1969; Sargent 2007; Hellwig 2008).
Pricing, investment and production plans are made on the basis of incomplete and conflicting knowledge of constantly changing aggregate, industry and local conditions. Firms and workers will over- or under-supply when they misperceive wages and prices.
With imprecise information, it takes time for employers and workers to sort out temporary from permanent shifts in demand and supply, inflation-driven changes from real changes in prices and input costs, and general changes from the local changes that may be more important to particular firms. As Hayek explained in his Nobel prize lecture:
The true, though untestable, explanation of extensive unemployment ascribes it to a discrepancy between the distribution of labour (and the other factors of production) between industries (and localities) and the distribution of demand among their products.
This discrepancy is caused by a distortion of the system of relative prices and wages. And it can be corrected only by a change in these relations, that is, by the establishment in each sector of the economy of those prices and wages at which supply will equal demand.
Recoveries are shaped by the speed of entrepreneurial learning about the new labour and product market conditions, the relative cost of adjusting capital and labour rapidly or slowly and the costs and benefits of labour market search. This new learning is necessary because the old constellation of prices and wages is no longer valid.
It was a misdirection of resources brought about by the initial inflationary firm, as Hayek explained in a visit to Australia in 1950:
During a process of expansion the direction of demand is to some extent necessarily different from what it will be after expansion has stopped.
Labour will be attracted to the particular occupations on which the extra expenditure is made in the first instance.
So long as expansion lasts, demand there will always run a step ahead of the consequential rises in demand elsewhere.
And in so far as this temporary stimulus to demand in particular sectors leads to a movement of labour, it may well become the cause of unemployment as soon as the expansion comes to an end…
If the real cause of unemployment is that the distribution of labour does not correspond with the distribution of demand, the only way to create stable conditions of high employment which is not dependent on continued inflation (or physical controls), is to bring about a distribution of labour which matches the manner in which a stable money income will be spent.
This depends of course not only on whether during the process of adaptation the distribution of demand is approximately what it will remain, but ‘also on whether conditions in general are conducive to easy and rapid movements of labour.
In a recession, employers and workers do not immediately know that demand has fallen elsewhere as well as in their own local markets and recognise the need to adjust to their poorer prospects everywhere, and it is not known how long the drop in demand will last (Alchian and Allen 1973).
The cost of learning about available opportunities restricts the speed of a recovery. Workers and entrepreneurs must gather information on the new state of demand and the location and nature of new opportunities. This information is costly and is quickly made obsolete by further changes, and the cost of acquiring information is more costly the faster the information is sought to be acquired (Alchian 1969; Alchian and Allen 1967).

The process of recovering from a recession would be a faster process if the new constellation of wages and prices that are the best alternative uses of resources was known immediately and was credible to firms and workers (Alchian and Allen 1973).
Workers and employers must first have sufficient time to discover what new knowledge they now need to know to serve their interests well, leave enough room for the unforeseeable and keep their knowledge fresh in ever-changing markets.
New wage levels must be created by workers and employers testing and retesting in the labour market the new relative scarcities of labour. Imbalances between the allocation of labour supply and demand to different firms and sectors and the new level and pattern of consumer demand are gradually remedied by changes in relative prices and wages, layoffs, business closures and job search.

Prices are a signal wrapped in an incentive. Growing demand induces higher employment and rising wages. Wages stagnate, and there are layoffs where there is an excess supply.
These changes give the unemployed an incentive to move to new uses and entrepreneurs to profitably hire the unemployed. The ensuing reorganisations are time-consuming and information-intensive because a job seeker and an employer with an apt vacancy take time to find each other.
Prices and wages must change sufficiently for firms to profitably create new jobs. New jobs require time to plan and build new job capital. This is the human, physical and organisational capital underlying a new job. There are also job creation costs when reopening existing positions that were mothballed during the downturn.
How is this to be done? Hayek explained again in 1950 in his speech in Australia:
Full employment policies as at present practised attempt the quick and easy way of giving men employment where they happen to be, while the real problem is to bring about a distribution of labour which makes continuous high employment without artificial stimulus possible.
What this distribution is we can never know beforehand. The only way to find out is to let the unhampered market act under conditions which will bring about a stable equilibrium between demand and supply.
Tom Sargent’s Keynote Address BYU CPEC 2012 on taxation and redistribution
11 Dec 2014 Leave a comment
in fiscal policy, labour economics, labour supply, macroeconomics, public economics Tags: taxation and the labour supply, Tom Sargent

Involuntary unemployment and the great vacation theories of the great depression and Eurosclerosis – updated again
10 Dec 2014 1 Comment
in economic growth, Edward Prescott, Euro crisis, great depression, job search and matching, labour economics, macroeconomics, Robert E. Lucas, unemployment Tags: Eurosclerosis, great depression, voluntary unemployment
Most Keynesian economists are convinced that something exists called involuntary unemployment and people can be unemployed through no fault of their own. They will accept the going wage but no employer is willing to offer it to them.
Lucas and Rapping’s (1969) paper, “Real Wages, Employment, and Inflation” provides the micro-foundations for an analysis of the labour suppl. They felt the need to reconcile the existence of unemployment with market clearing and referred to recent work of Armen Alchian (1969) on search explanations of unemployment.
Lucas and Rapping viewed unemployment as voluntary, including the mass unemployment during the great depression (Lucas and Rapping 1969: 748).
Lucas and-Rapping viewed current labour demand as a negative function of the current real wage. Current labour supply was a positive function of the real wage and the expected real interest rate, but a negative function of the expected future wage.
Under their framework, if workers expect higher real wages in the future or a lower real interest rate, current labour supply would be depressed, employment would fall, unemployment rise, and real wages increase.
Lucas and Rapping depicted labour suppliers as rational optimisers who engaged in inter-temporal substitution: working more when current wages were high relative to expected wages. The prevailing Keynesian approach assumed labour supply was passive, and movements in the demand for labour determined changes in employment.
Lucas and Rapping offered an unemployment equation relating the unemployment rate to actual versus anticipated nominal wages, and actual versus anticipated price levels. Unemployment could be the product of expectational errors about wages.
Lucas and Rapping’s model was poor at explaining unemployment after 1933 in terms of job search and expectational errors.
The graph below shows two different series for unemployment in the 1930s in the USA: the official BLS level by Lebergott; and a data series constructed famously by Darby. Darby includes workers in the emergency government labour force as employed – the most important being the Civil Works Administration (CWA) and the Works Progress Administration (WPA).
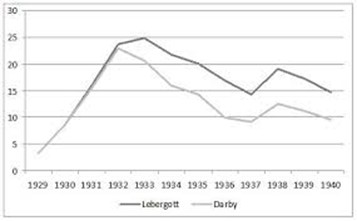
Once these workfare programs are accounted for, the level of U.S. unemployment fell from 22.9% in 1932 to 9.1% in 1937, a reduction of 13.8%. For 1934-1941, the corrected unemployment levels are reduced by two to three-and-a half million people and the unemployment rates by 4 to 7 percentage points after 1933.
Not surprisingly, Darby titled his 1976 Journal of Political Economy article Three-and-a-Half Million U.S. Employees Have Been Mislaid: Or, an Explanation of Unemployment, 1934-1941.
The corrected data by Darby shows stronger movement toward the natural unemployment rate after 1933. Darby concluded that his corrected date are suggests that the unemployment rate was well explained by a job search model such as that by Lucas and Rapping together with the wage fixing under the New Deal that kept real wages up and unemployment high.
Both the Keynesian approach to unemployment and the job search approach to unemployment view workers in emergency government work programs as employed and not as unemployed.
In the late 1970s, Modigliani dismissed the new classical explanation of the U.S. great depression in which the 1930s unemployment was mass voluntary unemployment as follows:
Sargent (1976) has attempted to remedy this fatal flaw by hypothesizing that the persistent and large fluctuations in unemployment reflect merely corresponding swings in the natural rate itself.
In other words, what happened to the U.S. in the 1930’s was a severe attack of contagious laziness!
I can only say that, despite Sargent’s ingenuity, neither I nor, I expect most others at least of the nonMonetarist persuasion,. are quite ready yet. to turn over the field of economic fluctuations to the social psychologist!
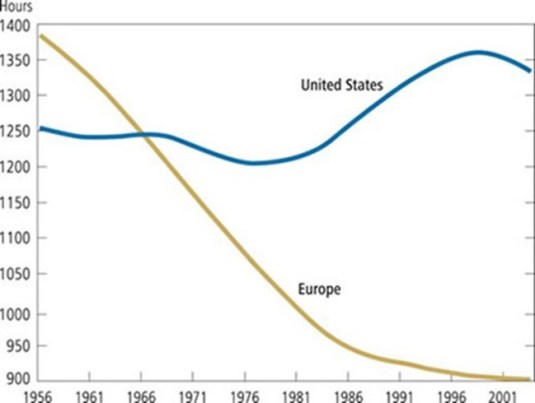
As Prescott has pointed out, the USA in the Great Depression and France since the 1970s both had 30% drops in hours worked per adult. That is why Prescott refers to France’s economy as depressed. The reason for the depressed state of the French (and German) economies is taxes, according to Prescott:
Virtually all of the large differences between U.S. labour supply and those of Germany and France are due to differences in tax systems.
Europeans face higher tax rates than Americans, and European tax rates have risen significantly over the past several decades.
In the 1960s, the number of hours worked was about the same. Since then, the number of hours has stayed level in the United States, while it has declined substantially in Europe. Countries with high tax rates devote less time to market work, but more time to home activities, such as cooking and cleaning. The European services sector is much smaller than in the USA.
Time use studies find that lower hours of market work in Europe is entirely offset by higher hours of home production, implying that Europeans do not enjoy more leisure than Americans despite the widespread impression that they do.
Richard Rogerson, 2007 in “Taxation and market work: is Scandinavia an outlier?” found that how the government spends tax revenues when assessing the effects of tax rates on aggregate hours of market work:
- Different forms of government spending imply different elasticities of hours of work with regard to tax rates;
- While tax rates are highest in Scandinavia, hours worked in Scandinavia are significantly higher than they are in Continental Europe with differences in the form of government spending can potentially account for this pattern; and
- There is a much higher rate of government employment and greater expenditures on child and elderly care in Scandinavia.
Examining how tax revenue is spent is central to understanding labour supply effects:
- If higher taxes fund disability payments which may only be received when not in work, the effect on hours worked is greater relative to a lump-sum transfer; and
- If higher taxes subsidise day care for individuals who work, then the effect on hours of work will be less than under the lump-sum transfer case.
Others such as Blanchard attribute the much lower labour force participation in the EU since the 1970s to their greater preference for leisure in Europe. An increased preference for leisure is another name for voluntary unemployment.
The lower labour force participation in higher unemployment in Europe is voluntary because of the higher demand for leisure among Europeans. According to Blanchard:
The main difference [between the continents] is that Europe has used some of the increase in productivity to increase leisure rather than income, while the U.S. has done the opposite.
An unusual left-right unity ticket emerged to explain the great depression in the 1930s and the depressed EU economies from the 1970s: the great vacation theory.
Trends in Income Inequality and its Impact on Economic Growth – OECD working paper (9 December 2014) – updated
10 Dec 2014 2 Comments
in economic growth, economics, economics of education, human capital, labour supply, occupational choice, politics - Australia, politics - New Zealand, politics - USA, poverty and inequality Tags: financing constraint on education, inequality and economic growth, poverty and inequality, student loans, taxation and the labour supply, top 1%
Figure 1: Estimated consequences of changes in inequality (1985 – 2005) on subsequent cumulative growth (1990-2010)
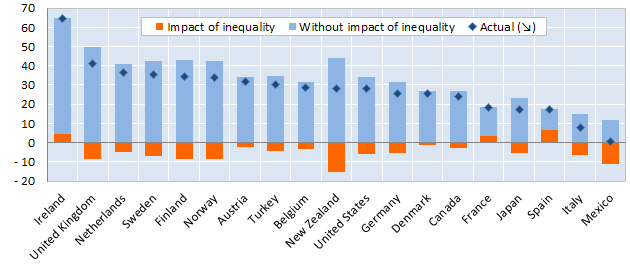
Drawing on harmonised data covering the OECD countries over the past 30 years, the econometric analysis suggests that income inequality has a negative and statistically significant impact on subsequent growth.
In particular, what matters most is the gap between low income households and the rest of the population.
In contrast, no evidence is found that those with high incomes pulling away from the rest of the population harms growth.
The paper also evaluates the “human capital accumulation theory” finding evidence for human capital as a channel through which inequality may affect growth.
Analysis based on micro data from the Adult Skills Survey (PIAAC) shows that increased income disparities depress skills development among individuals with poorer parental education background, both in terms of the quantity of education attained (e.g. years of schooling), and in terms of its quality (i.e. skill proficiency).
Educational outcomes of individuals from richer backgrounds, however, are not affected by inequality.
via Trends in Income Inequality and its Impact on Economic Growth – Papers – OECD iLibrary.
The OECD analysis published overnight in Paris suggest that the increase in equality in New Zealand the late 1980s is still scarring economic growth today by about 15 percentage points in lost cumulative economic growth.
The analysis of the OECD published overnight depends crucially upon how greater inequality reduces the ability of the lower income families to invest in human capital:
The evidence strongly suggests that high inequality hinders the ability of individuals from low economic background to invest in their human capital, both in terms of the level of education but even more importantly in terms of the quality of education.
The OECD theory of inequality and lower growth is there is a financing constraint because of inequality that reduces economic growth because of less human capital accumulation by lower income families.
This is interesting because in 2002, with Pedro Carneiro, James Heckman showed that lack of credit is not a major constraint on the ability of young Americans to attend college. They found that credit constraints prevent, at most, 4% of the U.S. population from attending. Credit constraints is weakening as a rationale for a lack of an accumulation of human capital, and can be easily solved.

The OECD is putting a lot of their growth inequality nexus eggs in one basket. That student loans and other government interventions are not closing credit constraints on financing higher education.
To add to that basket , they are placing a lot of weight in human capital as a driver of growth, and in New Zealand’s case, of technology absorption, which is a main foundation of economic growth in New Zealand. The evidence that human capital is a key contributor to higher economic growth is weakening ruck rather than strengthening.
The trend rate of productivity growth did not accelerate over the 20th century despite a massive rise in investments in human capital and R&D because of the rising cost of discovering and adapting new technological knowledge. The number of both R&D workers and highly educated workers increased many-fold over the 20th century in New Zealand and other OECD member countries including the global industrial leaders such as the USA, Japan and major EU member states.
Higher education has been free for the low income families for several generations. Student loans are readily available. It is hard to believe that such a readily solvable problem is a major source of inequality and lower growth.
Cross-country differences in total factor productivity are due to differences in the technologies that are actually used by a country and the degree in the efficiency with which these technologies are used. Differences in total factor productivity, rather than differences in the amount of human capital or physical capital per worker explain the majority of cross-country differences in per capita real incomes (Lucas 1990; Caselli 2005; Prescott 1998; Hall and Jones 1999; Jones and Romer 2010).
Differences in the skills of the individual worker or in the total stock of human capital of all workers in a country cannot explain cross national differences in value added per worker at the industry level.
- The USA competes with Japan for productivity leadership in many manufacturing industries.
- The Japanese services sector productivity can be as little as a one-third of that of the USA.
- Japanese labour productivity is almost twice Germany’s in producing automobiles and is better that Germany by a large margin for many other manufactured goods.
- The USA is uniformly more productive in services sector labour productivity. For example, British, French and German telecom workers were 38 to 56 per cent as productive as their American counter-parts.
The USA, Japan, France, the UK and Germany all have relatively well-educated, experienced and tested labour forces. For example, the 1993 McKinsey’s study inquired into the education and skills levels of Japanese and German steel workers. Comparably skilled German steel workers were half as productive as their Japanese counterparts (Prescott and Parente 2000, 2005).
As for the source of the growing income inequality, there is a long literature dating back 25-years arguing that skill-biased technological change is increasing the returns to investing in education
Important is the OECD conclusion that inequality in terms of the rich getting richer does not harm growth. To make sure I have not misquoted them , I quote once again from their abstract, where the OECD summarises its own findings:
Drawing on harmonised data covering the OECD countries over the past 30 years, the econometric analysis suggests that income inequality has a negative and statistically significant impact on subsequent growth.
In particular, what matters most is the gap between low income households and the rest of the population.
In contrast, no evidence is found that those with high incomes pulling away from the rest of the population harms growth.
That conclusion of the OECD almost saves me from having to go on about how inequality has not increased in New Zealand for the last 20 years, see figure 2, and that the top 1% have not increased their share of income in recent decades – see figure 3. The fact that the rich can get richer without harming the poor is an important conclusion that will surely not be reported by the media.
Figure 2: Gini coefficient New Zealand 1980-2015
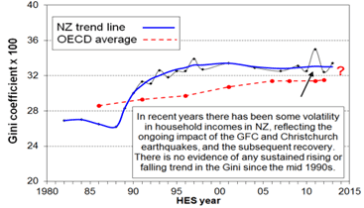
Figure 3: Top 1% income shares, USA, New Zealand and Australia, 1970-2012

Another inconvenience for the OECD is the last major increase in Gini coefficient in New Zealand was followed by a 15 year economic firm – see figures 2 and 4.
Figure 4: Real GDP per New Zealander and Australian aged 15-64, converted to 2013 price level with updated 2005 EKS purchasing power parities, 1956-2013

The NZ top 1% share has been steady at 8-9% since the mid-1990s see figure 4; the top 1%’s share rose strongly in the USA in recent decades, from 13% in the mid-1980s to 19% in 2012.
The Occupy crowd blame everything from the global financial crisis to a bad environment on growing inequality and the growing riches of living top 1%. Such an argument has no foundation in fact in New Zealand. The last major increase in Inequality was a long time ago in New Zealand.
The OECD is also rather casual about how policies to redistribute wealth and increasing incomes. While Western Europe is diverse, as a group, the higher taxes in the European Union reduced incentives to work. Employment as a percentage of the population has been consistently lower in Western Europe than in the USA since the 1950s, with an average employment rate gap of 10 percentage points over 1980-2007.
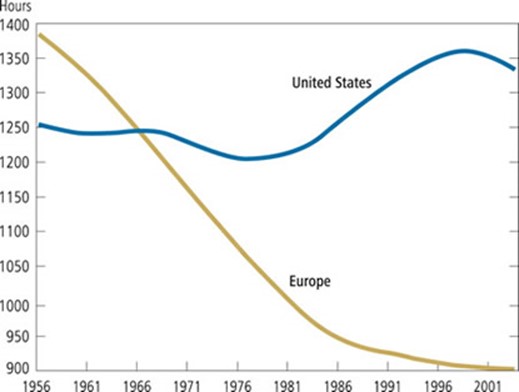
Large increases in taxes on income from labour since the 1970s, enhanced incentives for retire early, and the interaction of generous employment insurance with the larger skill losses among workers displaced by the greater economic turbulence since 1980 all acted to reduce both real GDP and hours worked per week per working age person by up to a third in Western Europe as compared to the USA since the 1970s (Prescott 2004, 2007; Rogerson 2006, 2008; Ohanian et al. 2008; Ljungqvist and Sargent 1998, 2007, 2008). For example, Ohanian, Rao and Rogerson 2008 in “Work and taxes: allocation of time in OECD countries” found that:
- A steep decline in average hours worked per adult and large variations across OECD member countries in the magnitude of this decline.
- Changes in labour taxes accounted for a large share of the trend differences.
- Countries with high tax rates devote less time to market work, but more time to home activities, such as cooking and cleaning.
- This reallocation of time from market work to home work is much stronger for females than for males.
Europeans pay more taxes, work fewer hours per year, have longer vacations, retire sooner, and invest less in human capital in an era in which trends in technology have significantly increased the demand for skilled workers, more innovation, more intense competition and greater entrepreneurial alertness. In The Impact of Labor Taxes on Labor Supply: An International Perspective (AEI Press, 2010) Rogerson finds that:
• a 10 percentage point increase in the tax rate on labour leads to a 10 to 15 per cent decrease in hours of work.
• Even a 5 per cent decrease in hours worked would mean a decline in labour output equating to a serious recession.
• While recessions are temporary, permanent changes in government spending patterns have long-lasting repercussions.
• Although government spending provides citizens with important benefits, such benefits must be weighed against the disincentive effects of increased labour taxes.
• Policymakers who fail to account for the decrease in labour output risk expanding government programs beyond their optimal scale.
Robert Lucas estimated in 1990 that eliminating all taxes on income from capital would increase the U.S. capital stock by about 35% and consumption by 7%.
Hans Fehr, Sabine Jokisch, Ashwin Kambhampati, and Laurence J. Kotlikoff (2014) found that eliminating the corporate income tax completely would raise the U.S. capital stock (machines and buildings) by 23%, output by 8% and the real wages of unskilled and skilled workers each by 12%.
In summary, this one paper by the OECD, which is a working paper makes profound conclusions about taxation and economic growth that contradict a large literature based on the lack of statistical significance of coefficients in the OECD’s regressions.
More fundamentally, linking lower economic growth to inequality through credit constraints on the human capital accumulation of the lower middle class is a weak reed to hang its argument. Human capital is not a good explanation of variations in growth across time or between countries.
What happened to income inequality in New Zealand in the late 1980s is not a credible explanation for lower growth 30 years later. Lower economic growth because of greater inequality is certainly an easy problem to solve if all that is required is more action on the financing constraint on human capital accumulation.
Early Adoption of Technologies since 1750 till 2012
08 Dec 2014 Leave a comment
in applied welfare economics, economic growth, economic history, entrepreneurship Tags: 10-90 lag, international technology diffusion, technology diffusion, technology usage lags
Deigo Comin has been doing excellent work documenting both the length of 10-90 technology lags even for major technologies we now take for granted, and the contribution of these technology usage lags to international differences in living standards and post-war growth rates.
The East Asian Tigers all coincided with a catch-up in the range of technologies used with respect to industrialized countries. These development miracles all involved a substantial reduction of their technology adoption lags relative to (other) OECD countries
15 to 30 years is a common technology usage lag even within the United States for the 10-90 technology lag. The 10-90 lag is how long it takes between when 10% of industry is using a technology, and 90% of an industry is using that technology.


There is a plenty of research carried out about how important early adoption of technology is. I’ve recently skimmed a couple of researches on this topic. In my opinion there are two authors that made a better job than others. Their names are Diego Comin and Bart Hobijn.
They performed a cross-country analysis called Cross-country Historical Adoption of Technology (CHAT). This research dataset covers the diffusion of 104 technologies in 161 countries during the last 200 years. The data is available for download.
I just want to share with you the results of their report which could help better understand what’s happening in today’s world of innovations and entrepreneurship and what expect from future.
Finding # 1. “On average, countries adopted a new technology 45 years after its invention.”
Finding # 2. “Variation in adoption rates is larger than you might expect and accounts for 25% of differences…
View original post 95 more words
The shape of the welfare state in the USA
08 Dec 2014 Leave a comment
in fiscal policy, income redistribution, labour economics, labour supply, politics - USA, public economics, welfare reform Tags: effective marginal tax rates, Obama care, poverty traps, welfare reform

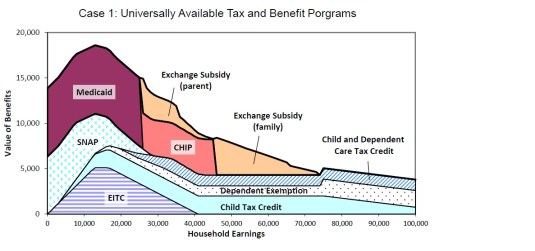
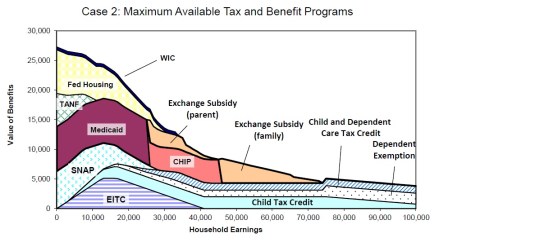
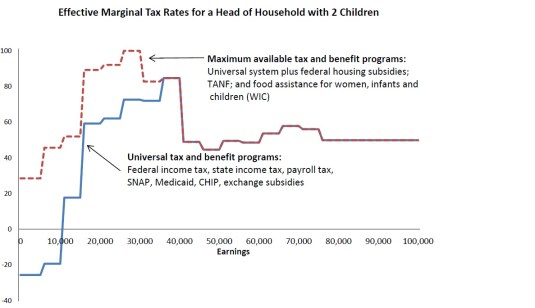
One in five Americans on Medicaid; this image does not include those on Medicare –those over 65 who get their healthcare paid by the government.



Recent Comments