What’s the difference between inflation and counterfeiting? The Portuguese banknote caper

Robert Barro recounts in his macroeconomics textbook a marvellous example where swindlers induced a British manufacturer of bank notes to print and deliver to them 3 million pounds’ worth of Portuguese escudos, which was equivalent to about 1% of Portugal’s nominal GDP in 1926.

This company, Waterlow and Sons Ltd. of London, also printed the legitimate notes for the Bank of Portugal. These bogus notes were,at first pass, indistinguishable from the real thing (except that the serial numbers were duplicates of those from a previous series of legitimate notes).


It was impossible to differentiate between the original and most of the duplicate banknotes because they were printed by the same printer using the same plates. 135,318 of the duplicate notes could be identified as part of the swindle because they were printed on plates not used for any other Portuguese banknotes. These bogus notes printed with the new plates could be differentiated from older legitimate banknotes because of a few marks that could be identified by an expert using a magnifying glass.

Central to the scam was taking advantage of the practice of the privately owned Bank of Portugal of secretly printing banknotes and neither recorded such transactions in the books, nor informing the government of the increase in the number of circulating banknotes.

(At the time, the Bank of England was also privately owned and only in 1921 had it obtained a monopoly on the issue banknotes in England and Wales. The Bank of Scotland still prints Scottish banknotes that are not legal tender in England. Three northern Irish banks still print banknotes that are legal tender in Northern Ireland. The entire northern Irish currency was withdrawn from circulation after a major bank robbery by the IRA a few years ago and replaced with new notes).

After the scheme unravelled, the Bank of Portugal made good on the fraudulent notes by exchanging them for newly printed, valid notes. The fraud may have contributed to the military coup, some six months later.

In the interim, by illegally increasing the monetary base and investing heavily in currency, land, building, and businesses, the swindlers created a boom in the Portuguese economy.

From the standpoint of monetary economics, I cannot think of a more unanticipated monetary shock. Of a surprise burst of monetary inflation and price inflation  and led to the writing of books with titles such as The Man who Stole Portugal.

The final part of the swindle was to actually buy a controlling interest in the Bank of Portugal to validate the fraud by erasing all records that might inconvenience the swindlers.

The chief swindler with accomplices set up a bank of his own to facilitate fast distribution of the forged currency. A bank of their own was necessary because they had the modern equivalent of $150 billion to launder.

This Bank of Angola & Metropole set up to launder the bogus notes was also the initial place of suspicion of something fishy going on because it grew so quickly, while taking no deposits. Germans are also involved with this bank. Germany was suspected by the Portuguese government to have ambitions to take over Portuguese Angola, so this attracted additional attention from the authorities.

The chief swindler, Alves Reis, was depicted in a 50-episode TV series in 2000 as well as several books about the fraud over the decades.

At the time of the swindle, Reis was 28 years old engineering dropout from an undistinguished middle-class Lisbon family. He already had a conviction for cheque fraud. As such, one of the greatest swindles of all time was pulled off by a petty conman.

The swindle unravelled because of the duplicate banknote serial numbers, which was an error the swindler made himself. But for that, the swindle would have been immensely difficult to uncover. The swindlers duplicated the existing serial numbers and hoped they were able to successfully release all the banknotes before they were caught.

Reis, the architect of the swindle, work out the sequence of bank governor names and serial numbers used by the Portuguese central bank, but had neglected to eliminate numbers already ordered.

When the British printer realised this, Reis convinced the London firm that the reuse of existing serial numbers for their purported place of circulation in the Portuguese colony of Angola was not a cause for alarm. Fortunately for the swindlers, a letter from the British printers to the Banco de Portugal, in that he spoke about the agreements to print the banknotes for distribution in Angola went missing in the post.

The Bank of Portugal was not supposed to issue its currency in Angola, but often did circulate its currency in Angola.

This was a clever part of the swindle. By pretending that the Bank of Portugal was doing something slightly dodgy but still standard practice, and thus had to do so in secrecy, the swindlers could induce a whole range of other more legitimate people than them to cooperate quietly with what they were doing.

The shady nature of these dealings to surreptitious circulate Bank of Portugal banknotes in Angola stamped with “Angola” was passed over by the British dupes to the swindle as another example of the corruption of Portuguese officials. The stamp “Angola” was so they wouldn’t be confused with notes from the mother country.

In addition, bank notes for the Portuguese colonies were printed at the time by a competitor. The British printer saw this on the quiet contract as an opportunity to take away some of their trade.

The swindlers said that they would take care of stamping “Angola” on the banknotes once they were delivered to them. The swindlers had accomplices in the Portuguese diplomatic service, who issued them with fake diplomatic passports, which was helpful in persuading the British printers to deliver the bogus banknotes personally to them. Consignments were delivered to the swindlers in February, March and November 1925.

the basis of the scam was forging a contract in the name of Banco de Portugal authorising Reis to print banknotes in return for an alleged loan from a consortium to develop Angola. The whole affair had to be kept secret lest Angola fall into further financial difficulties due to rumours of a pending economic ruin.

The London based specialty printer worked, for among other clients, for the English court system and printed the transcripts of its own trial! This printer tried to have the trial postponed for a year while its chief executive completed his one-year term as Lord Mayor of London to save embarrassment.

The British printing company was found liable in subsequent four years of litigation, but the key question for the court was the amount of damages.

  • The Bank argued that the damages were £1 million (less funds collected from the swindlers).
  • The British printer duped by the swindlers argued was that the only true costs to the Bank were the expenses for paper and printing of the replacement notes.

The House of Lords determined in 1932 that £610,000 was the correct measure. This award of damages was the £1 million less the funds recovered from the swindlers

The proper measure of damages, in the view of the majority of the Law Lords, was the face value expressed in sterling of the genuine currency given in exchange for the spurious notes.

As these damages would be paid initially in British pounds, this damages award was a real windfall for the Bank of Portugal. Worthless Portuguese banknotes exchanged for good British pounds that could buy imports.

The majority decision of the Law Lords was the correct measure of damages because that is what the bank had to outlay to make itself whole again after the breach of contract. The chief swindler got 20 years.

One of the two Law Lords in dissent had another view of the proper measure of damages:

The judgment of Wright J. should be set aside and judgment entered for the Bank for the sum of £8,922

This law lord and an appeal court justice held this view because the swindle cost the Bank of Portugal nothing bar printing costs to replace the spurious banknotes, which were widely accepted as valid currency in a cash economy.

The Bank of Portugal could issue banknotes in any number at little cost to itself up to the limit provided by Portuguese law. Ropke wrote that:

The English courts presently discovered that the case involved issues of unusual subtlety and complexity, adjudication of which necessitated the admission of testimony by leading monetary theorists.

The question before the courts was: how great were the actual losses incurred by the Bank of Portugal?

If it had been postage stamps instead of bank notes in which the swindlers had trafficked, it is perfectly clear that the loss of the Portuguese government would have equalled the total value of the stamps.

With respect to the bank notes, however, no such simple calculation could be made.

Among the many questions which troubled the experts the following stand out as particularly relevant to our study: would the Bank of Portugal have issued the same amount of notes even if the swindlers had not done so?

If not, was the increase in the supply of money resulting from the introduction of the fraudulent notes good or bad for Portugal?

No one disputes,  as several of the Law Lords noted, that the theft of a postage stamp must be made good at face value. People hesitate in this case involving swindling access to banknote plates and printing currency for yourself because what exactly was stolen?

When Reis died in 1955 , The Economist said of the counterfeiting scheme:

The perpetrators, however reprehensible their motives, did Portugal a very good turn according to the best Keynesian principles.

The House of Lords case is a major British legal precedent regarding the duty of the wronged party to mitigate damages in the case of breach of contract.

The House of Lords held that this duty did not apply if it would give your business a bad name in the trade. The Bank of Portugal could have repudiated the duplicate banknotes rather than exchange them for genuine new notes, but chose not to do so because this repudiation of banknotes would have ruined what little reputation it had.

The House of Lords also upheld the right of the wronged party to choose between different methods to mitigate damages from the breach of contract.

Did the World Bank just solve the puzzle of low NZ growth relative to Australia?

The World Bank published a major 300 odd page report that discussed puzzles of economic growth around the world included a chapter on New Zealand’s slow economic growth relative to Australia.

The World Bank publication is copyrighted 2015, so I assume that it has been published very recently. However, the data analysis in the chapter on New Zealand stop in 2002.

The conclusions of the World Bank with regard to the emergence of the trans-Tasman income gap were as follows:

The extent of economic freedom—as determined by propelling institutions—evolved in a similar manner in both countries.

The small differences in propelling institutions in both countries mostly netted out and as such cannot account for the differences in economic performance.

One exception was the fiscal position of the state—a rise in public expenditure after the first oil crisis entailed increased tax burdens in both countries.

A particularly sharp rise in taxation in New Zealand (in comparison to Australia) occurred during the country’s second downturn.

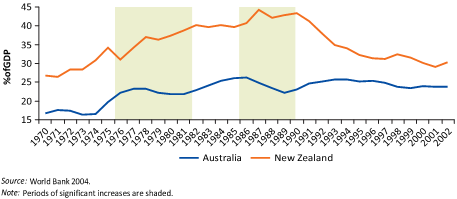
Differences in the size of the public sector figure prominently in the analysis of the World Bank of the emergence of the trans-Tasman income gap. The measure by the World Bank of the size of the public sector in New Zealand and Australia is reproduced below – its figure 3.3.

Figure 3.3 Government expenditure in Australia and New Zealand, 1970–2002

In particular, the World Bank was concerned about the rapid growth in the size of the public sector in New Zealand while the size of the public sector was shrinking in Australia:

In 1977–82 Australia’s government expenditure rose more slowly than that of New Zealand (and in 1975–80 Australia’s expenditure was smaller than New Zealand’s by 13 percent of GDP.

Then, as relative economic growth declined in New Zealand, between 1987 and 1990 public expenditure increased by around 5 percent of GDP from the 1982–86 level. In the meantime, public expenditure in Australia fell by 4 percent of GDP.

As a result, the difference in the general government expenditure level between New Zealand and Australia increased to over 18 percent of GDP in 1987–90.

After 1990 and until 2002 government spending in New Zealand decreased steadily—from approximately 44 percent of GDP in 1990 to roughly 30 percent of in 2002.

In Australia this expenditure was maintained at an average of 25 percent of GDP over the same period (see figure 3.3 with highlighted periods of significant increases of government expenditures in New Zealand).

A spike in the size of state sector in the 1980s may explain a delay in productivity growing rapidly again, but the state sector in New Zealand is now smaller.

Indeed, figure 3.3 above shows that the public sector in New Zealand as measured by general government expenditure has fallen by a quarter in size, by 10 percentage points of GDP in a matter of seven years between 1990 and 1996. There should be rapid growth because of the greatly reduced crowding out by the state sector but that rapid growth is not there.

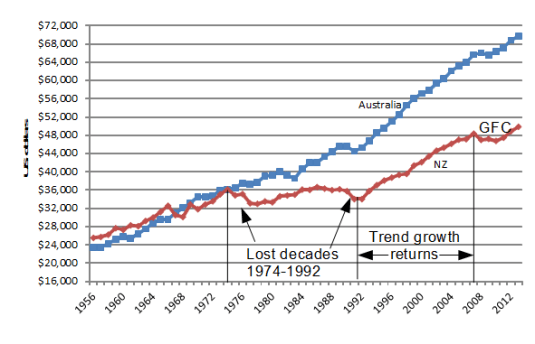
Figure 2 shows that GDP growth per working age New Zealander resumed at its trend rate of 2% after 1992. This resumption of growth was in conjunction with the decline in the size of public sector tax burden rather than after it. Figure 2 shows that there was no significant growth in real GDP per working age New Zealander from 1974 to 1992. New Zealand lost almost two decades of productivity growth. Real GDP per New Zealander aged 15-64 on a purchasing power parity basis dropped from equality with Australia up until 1974 to a 30 per cent gap by 1992.

Figure 2: Real GDP per New Zealander and Australian aged 15-64, converted to 2013 price level with updated 2005 EKS purchasing power parities, 1956-2012

Source: Computed from OECD Stat Extract and The Conference Board, Total Database, January 2014, http://www.conference-board.org/economics

There was no growth rebound when the burden of an oversized public sector was lifted. That is the greater puzzle. The World Bank did not address that greater puzzle. If there is a global pool of useful technological knowledge accessible at a low cost by suitably prepared people, what stops New Zealand from using this knowledge to grow faster until it catches-up with Australia and the USA?

Another puzzle for the World Bank is that it is using general government expenditure estimates by the OECD.

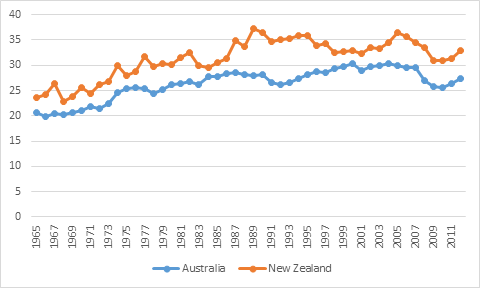
When tax revenue as a percentage of GDP is used to measure the size of the public sector and the burden on private sector initiative, figure 3 shows that the tax burden in the two countries is not that different and is in the low 30% range, not the 40% plus range as is suggested by the general government expenditure data in Figure 3.3.

Figure 3: tax revenue as a percentage of New Zealand and Australian GDP, 1965-2011

Source: OECD Stats

There are no 14 point gaps in tax burdens in figure 3 as suggested in the World Bank’s analysis. This is because the World Bank’s using general government expenditure shown in its figure 3.3 reproduced above.

A major conclusion about the causes of New Zealand’s poor growth performance in the last few decades should be robust to different measures of the size of the public sector, but it is not.

Economic reforms returned real GDP growth per New Zealander aged 15-64 from no growth from 1974 to 1992 to the previous two per cent trend rate from 1993. There was no sustained productivity growth rebound beyond 2 per cent growth a year for New Zealand to recover the lost ground in the 1980s and 1970s. That is the great puzzle that the World Bank did not address, much less solve.

Henry Hazlett on the fiscal stimulus and other manifestations of the broken window fallacy

The role of news in real business cycles

Revisions in investor beliefs about productivity prospects can partly account for business expansions and contractions. If favourable news about future technological opportunities can seed a boom today in consumption and investment before the actual technological improvement arrives and is realised, news that future productivity growth may not be as good as was previously expected can induce a recession without any actual change in productivity ever occurring.

Investors build in anticipation, starting new projects and recruiting more staff. Their forecasts can turn out to be too optimistic. When entrepreneurial expectations of future productivity are revised, investment demand can fall because of an excess in capital accumulation – recent investments were made under more optimistic beliefs about productivity (Beaudry and Portier 2004).

Investment demand must be muted for a time until the excess capital accumulation is brought into use, refitted or scraped. There also will be layoffs and a lull in recruitment. Job search strategies must also change as job seekers redirect their careers in light of the news about their revised prospects in different firms, industries and competing occupations.

The optimism and pessimism of investors are rational profit-seeking responses to new entrepreneurial knowledge. Profit expectations reflect consumer preferences, resource constraints and technological factors as they exist and are forecast to change and actual and forecasted opportunities and constraints in the investment sector. Entrepreneurs are dynamic risk takers who profit from anticipating shifts in consumer demand, input costs and technology.

Recessions and booms can arise due to the challenges facing entrepreneurs in forecasting the uncertain and ever-changing future demand for new capital that is implied by their forecasts of consumer demand and technological opportunities as Beaudry and Portier (2004) explain:

The view that recession and booms may arise as the result of investment swings generated by agents’ difficulties to properly forecast the economy’s need in terms of capital has a long tradition in economics.

For example, this difficulty was seen by Pigou as being an inherent feature of any economy with technological progress.

As  emphasized in Pigou (1926), when agents are optimistic about the future and decide to build up capital in expectation of future demand then, in the case where their expectations are not met, there will be a period of retrenched investment which is likely to cause a recession.

Revisions in entrepreneurial beliefs and investment plans can be required when new information is uncovered (Beaudry and Portier 2004; Sill 2009). There can be lulls in investment demand following these revisions to entrepreneurial forecasts leading to recessions. As Pigou noted in 1927:

The varying expectations of business men … constitute the immediate cause and direct causes or antecedents of industrial fluctuations

Robert Lucas and where have all the small entrepreneurs gone?


Robert Lucas predicted the decline in the number of small business people and small firms in 1978. The number of small firms will fall and the number of large firms will rise with increases in real wages (Lucas 1978; Poschke 2013; Gollin 2008; Eeckhout and Jovanovic 2012).

Lucas closed his 1978 discussion of the size distribution of firms, and how firms are getting larger an average over the course of the 20th century, with a discussion of a lovely restaurant he visited on the Canadian border. He predicted that in couple of decades time, these type of restaurants will be fewer.

Nations that are more productive  over time and have higher wages because they have accumulated more capital per worker.

One consequence of more capital per worker is real wages increase at a faster rate than profits (Gollin 2008; Eeckhout and Jovanovic 2012). For example, the rate of return on capital was stable over the 20th century while real wages increased many fold (Jones and Romer 2010). This relationship turns out  to be crucial in terms of occupational choice and the decision to become an entrepreneur – a small business owner

Higher wages reduces the supply of entrepreneurs and increases the average size of firms because entrepreneurship becomes a less attractive occupational choice (Lucas 1978; Gollin 2008; Eeckhout and Jovanovic 2012).

For example, in the mid-20th century, many graduates who were not teachers were self-employed professionals. With an expanding division of labour because of economic growth, many well-paid jobs and new occupations emerged for talented people in white-collar employment.

OECD countries richer than New Zealand should have less self-employment and more firms that are large because paid employment is an increasingly better-rewarded career option for their high skilled workers.

The U.S. had the second lowest share of self-employed workers (7 per cent) in the OECD in 2010 – the latest data – which is less than half the rate of New Zealand self-employment (16.5 per cent) in 2011 (OECD 2013). The Australian self-employment rate was 11.6 per cent in 2010 (OECD 2013).

A companion reason for larger average firm sizes in countries richer than New Zealand is more capital-intensive production can prosper in larger corporate hierarchies than can labour-intensive production (Lucas 1978; Becker and Murphy 1992; Poschke 2011; Eeckhout and Jovanovic 2012).

The more able entrepreneurs can run larger firms with bigger spans of control in richer countries because their employees can profitably use more capital per worker with less supervision. The diseconomies of scale to management and entrepreneurship should rise at a faster rate in less technological advanced countries such as New Zealand because they are more labour intensive economies (Lucas 1978; Becker and Murphy 1992; Poschke 2011; Eeckhout and Jovanovic 2012).

Importantly, the more able entrepreneurs benefit most from introducing frontier technologies because they can deal more easily with their increased complexity and more uncertain prospects (Poschke 2011; Lazear 2005; Shultz 1975; 1980). Growing technological complexity reduces the supply of entrepreneurs because it takes longer to acquire the necessary balance of skills and experience needed to lead a firm (Lazear 2005; Otani 1996).

The more marginal entrepreneurs will switch to be employees as technology advances so the average size of firms will increase. The entrepreneurs that remain in business will be the most able, more skilled and more experienced entrepreneurs and will be more capable of running larger firms that pioneer complex, frontier technologies (Poschke 2011; Lazear 2005, Otani 1996; Lucas 1978).

Countries more technologically advanced than New Zealand will have both larger firms and less self-employment because of growing technological complexity.

The greater is the exposure to foreign competition, the smaller is the fraction of self-employed and small firms in a country (Melitz 2003; Díez and Ozdagli 2012). More foreign competition increases wages because of lower prices, which makes self-employment less lucrative. More exporting favours larger firms both because of the fixed costs of entering export markets and because the stiffer competition will weed-out the lower ability entrepreneurs who run the smaller firms (Melitz 2003; Díez and Ozdagli 2012).

Other factors can countermand the effects that occupational choice, frontier technologies, exporting and capital intensity have to increase the average size of firms as real wages rise.

For example, tax and regulatory policies reduce the average size of firms in many EU member states to levels that are similar to New Zealand. The EU is less likely to have large firms in its labour intensive sectors. Employment protection laws, product market and land use regulation and in particular, high taxes stifled the growth of labour intensive services sectors in the continental EU (Bertrand and Kramatz 2002; Bassanini, Nunziata and Venn 2009; Rogerson 2008).

EU firms are are more capital intensive with fewer employees than otherwise because labour is so expensive to hire in the EU. Small and medium sized firms can struggle to grow in much of the EU because of regulatory burdens that phase in with firm size (Garicano, Lelarge and Van Reenen 2012; Hobijn and Sahin 2013; Rubini, Desmet, Piguillem and Crespo 2012). Average firm sizes are 40% smaller in Spain and Italy than in Germany. Obstacles to firm growth originate in product, labour, technology and financial and the binding constraints differ from one EU member state to another (Rubini, Desmet, Piguillem and Crespo 2012).

Average firm sizes in the USA and UK may be larger because of fewer tax and regulatory policies that limit business growth. Bartelsman, Scarpetta and Schivardi (2005) found that new entrants in the U.S. started on a smaller scale than in Europe but grew at a much higher rate. This willingness to experiment on a smaller scale was worth the risk because the payoff was much larger in terms of growth in the more flexible U.S. markets.

In summary, many factors drive the size distribution of firms countries including taxation and regulation. Underlying this, nonetheless, is Lucas’s point from 1978 that rising real wages makes starting a small business a less inviting occupation choice.

Japan and Finland in the 1990s

Source: Edward Prescott

Image

Interview with Robert Lucas on the global financial crisis and the great recession

Real business cycles and learning the value of major technological changes

The true value of any technological improvement is uncertain. Investors adopt a new technology after forecasting the likely productivity of the new technology. Investor learning in the face of imperfect information about the true value of major new technologies can also lead to business cycle fluctuations (Li 2007).

As a new technology slowly diffuses, entrepreneurs learn more about the true potential of the new technology and re-evaluate in hindsight whether they have invested beyond the optimal amount. If entrepreneurs have not over-invested, they revise their beliefs about the magnitude of the innovation and invest more.

Because the agents have to learn the magnitude of the technology shock, they are cautious in making investment decisions before they have learned much about the underlying technology. Consequently, GDP growth is gradual, which stretches out the length of booms.

When entrepreneurs later find that investment has over-shot the optimal amount, they reduce investment demand perhaps sharply and start a recession (Li 2007). This eventuality may seed a recession within many major technology advances such as the IT boom in the 1990s and the computer revolution in the 1970s.

The true value of the major technological improvement is  often discovered only after investment over-shoots the optimal level (Li 2007). A general technological innovation affecting many industries is required for the cluster of entrepreneurial errors about the true magnitude of the productivity increase to seed a recession (Li 2007).

The 2001 US recession followed a long boom involving major new information and communication technologies that raised the productivity of many existing technologies. The information, communications and software boom lasted over a decade in the US (Li 2007).

Entrepreneurs invested gradually in new information and communication capital to learn more about the underlying technologies that they embodied. These new information and communication technologies were productivity improvements of a major but uncertain scope (Li 2007).

The eventual productivity gains come from two complex sources – both from adopting the new technology itself and from its interface with existing capital and expertise. Because both productivity gains must be forecasted and because both are discovered only by experimentation and learning by doing, it is entirely possible that entrepreneurs can invest ahead of consumer demand.

This surplus capacity will emerge despite the best efforts of investors to mitigate this risk by staggering investments to learn more about the true value of the new technology. This investor caution and staggering to allow for more learning is an important factor that stretches out the length of investment booms in major new technologies (Li 2007).

There was a sharp decline in US investment in 2001, with large accumulations of unused capital in some sectors. For example, 90% of the optical fibre laid in the US in the 1990s was unused in the years that followed. Entrepreneurs discovered the optimum investment level in, for example, optical cable fibre by investing past it and revised plans for further investments in light of this over-shooting (Li 2007).

Real business cycles of a significant magnitude can emerge simply from technological learning.

Li (2007) argued that many investment booms start with the advent of a revolutionary technology and ended with overinvestment. For example, canal building boomed after the invention of the steamboat, and by the year 1860 more than 4,000 miles of canal had been completed. However, many of these canals did  not live up to the expectations of their promoters. Many of these projects eventually turned out to be financial failures.

Later in the same century, the railroad expansion shared a similar fate. Thousands of miles of railroad were built and left unused or under used, a phenomenon described by Schumpeter (1949) as construction “ahead of demand.”

That real business cycle theory required technological regress for there to be recessions is one of its oldest criticisms. That criticism that standard equilibrium business cycle models have difficulties in predicting the investment boom and overshooting grows weaker by the day.

Li presents a strong internal propagation mechanism with respect to technology shocks and endogenous recessions without invoking technological regress:

…firms invest in new capital to take advantage of the IT revolution, without knowing the limit to which this new technology can increase productivity.

The belief of this limit becomes increasingly optimistic over time as investors repeatedly realize that they have not invested enough to exhaust the potential of the new technology.  Such belief revisions lead to increasingly aggressive investment and a capital overhang, followed by a recession.

What is labour hoarding?

The fall and rebound in employment growth usually lags a few quarters behind the fall and later recovery in output growth in any recession because of labour hoarding. Hamermesh (1993) defined labour hoarding as

a less than proportionate decrease in worker hours in response to a negative demand shock

Firms may hoard or retain under-utilised employees despite falls in demand because of demand uncertainty.

Becker (1975) and Oi (1962) both refer to the fixed costs of employment as an incentive to retain experienced workers with firm-specific human capital during lulls in demand.

The fixed costs of employment are the costs of recruiting and training workers. These fixed costs meant that the demand for labour does not adjust instantly to changes in demand for the firm’s product:

The cyclical behaviour of labour markets reveals a number of puzzling features for which there are no truly satisfying explanations . . .

I believe that the major impediment to rational explanations for these findings lies in the classical treatment of labour as a purely variable factor (Oi 1962).

Hirings and layoffs are costly. Hiring costs include advertising vacancies, the time spent finding and screening applicants and training. Layoff costs include redundancy payments, legal procedures and, importantly, the capital loss of losing access to experienced employees with firm-specific training and then later having to train their replacements.

To reduce these current and capital costs early in recessions, employers will first adjust hours worked and rely on natural attrition of staff to defer laying off their more experienced employees. Only once these options have been exhausted, and demand for the firm’s product is still slack, the capital loss of laying off a worker may become necessary.

Labour hoarding is a speculative investment based on forecasts of demand. The decline in product demand must be seen as short. There will be more layoffs if the recession is expected to be deep or long.

If there is a quick recovery, unnecessary layoffs and the cost of training replacements are both avoided.

What if Abenomics fails?

Image

Entrepreneurship and sectoral mismatches in labour supply and labour demand

An important factor behind business fluctuations arises not from the balance between aggregate output and aggregate consumption, but from the accuracy of entrepreneurial matching of the individual patterns of output with the pattern of actual consumer demand in individual sectors (Black 1987, 1995).

Fluctuations in the match between resource deployment to different sectors and product demand across sectors can create major fluctuations in output and employment because moving resources from one sector into another is costly and time consuming.

What consumers will want and what can be produced in the future is uncertain. A plethora of sectors produce highly differentiated products with increasingly specialised inputs to serve consumers. Modern economic growth is built on ever greater product differentiation, ever greater product variety and ever increasing product quality produced by ever more specialised workers, firms and sectors. This explosion in specialisation is increasing the vulnerability of the business cycle to technology and taste shocks (Black 1987, 1995; Mehrling 2005).

Mismatches in the sectoral pattern of installed production capacity with actual consumer demand will arise because investments are driven by entrepreneurial forecasts of what will be wanted by consumers in the future. The capacity to produce output requires prior investments based on speculations about future consumer tastes, resource availabilities and technology progress. Part of the volatility in output and employment growth is from these investments depending on the uncertain details of the future.

Entrepreneurial errors in forecasting consumer wants will lead to inevitable mismatches of the production capacity with unfolding consumer demand. If future consumer tastes and upcoming technologies were better known now, employment would grow and be reallocated more smoothly to new uses than otherwise (Black 1987, 1995; Mehrling 2005).

When the match between forecasted and realised demand is good, there is a boom. Resources are where consumers want them. When the match is poorer, there is a recession. If events unfold in a markedly unanticipated direction, existing plans, investments and contracts require revision (Black 1987, 1995).

The existing matches between consumer desires, resource allocations by sector and production technologies can deteriorate. While a reallocation occurs, resources are diverted from production and are scrapped or are unemployed while searching for new uses (Black 1987, 1995).

Fixing a deteriorating match requires the structure of production to shift more into line with the structure of consumer demand. This takes time and consumes resources because human and other capital is highly specialised. It takes time for the new investments consistent with the latest entrepreneurial forecasts of consumer demand to be planned, built and start producing (Black 1987, 1995).

What can appear to be cyclical unemployment comes from alternations between periods of above and below average accuracy on entrepreneurial forecasting and better and worse matches in actual consumer demand and actual capacity to supply at the sector level (Black 1987, 1995; Mehrling 2005).

This type of cyclical unemployment is not a product of monetary, fiscal or other policy shocks. Resources need to be reallocated into a better alignment with consumer tastes and technological and resource possibilities. Preventing these sectoral reallocations will keep resources from moving from lower to higher value uses.

After longer booms, more human capital is more specialised to specific sectors, firms and jobs. This increased specialisation that helped underpin the prior economic boom can slow the recovery of employment at the end of the recession.

Job seekers will take longer to find good new job matches if they have more distinct backgrounds and specialised human capital. Job seekers have an incentive to search for longer to find these higher-paid job matches.

Employers will take longer to fill vacancies. The applicant pool is more diverse because of the high degree of specialisation of labour that is a legacy of the long prior boom. This accumulation of specific human capital over the course of longer booms will mean the length of the burden will affect the depth of the subsequent recession.More highly specialised workers have to be re-matched with new occupations and new sectors. More workers than usual will be putting off the day of having to face up to scrapping a significant part of their old human capital.

Was the 1990s in the USA a boom period or business as usual?

Source: Edward Prescott

Image

My bullet train trip deep into the Japanese mountains

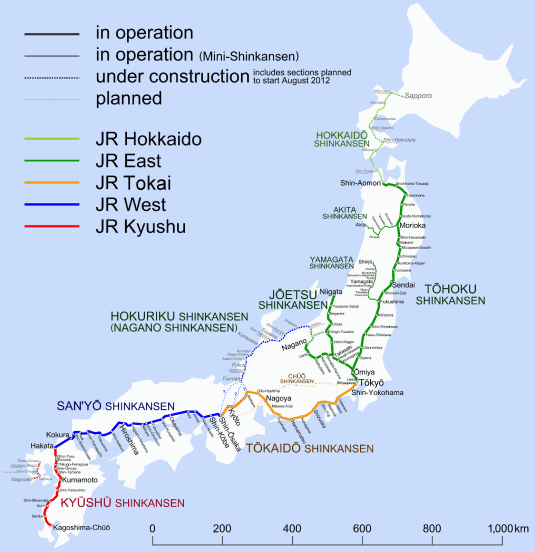
My first trip on the bullet train was zipping from Tokyo to Kyoto and Osaka and then to Hiroshima. A great experience was my trip to Japan in 1993. An excellent tourist destination. I recommend Japan to anyone as a tourist destination. The language barrier is not a problem – there are plenty of English signs.

When I returned to Japan as a student in 1995, the last of my bullet train trips was into the Japanese mountains.

The class field trip travelled on a spur on the Bullet train to the Yamagata city in Yamagata prefecture.

This bullet train line weaved its way through the mountains and rarely hit any sort of speed. The bullet train was no faster than the ordinary Japanese trains I have taken through the mountains in Japan.

When I asked my Professor of Land Transport when we are heading back from our field trip at an isolated rural train station waiting for the Bullet train, why was the Bullet train to such a remote place, he said that the Secretary General of the Liberal Democratic party always wanted the Bullet train to come to his home district.

Yamagata prefecture has a population of about 1 ½ million. Yamagata city has a population of about a quarter of 1 million. That is smaller than Greater Wellington.

The final station in this spur into Yamagata prefecture has a population of 40,000. Perhaps a Bullet train should come to my suburb in the eastern suburbs of Wellington?

Abe’s snap election pays off with big win for LDP | The Japan Times

the ruling bloc secured a two-thirds supermajority in the 475-seat House of Representatives, giving it the power to override the Upper House.

When I arrived in Japan in 1995, the LDP was out of power and written off.

The LDP were true stayers in politics. They managed to get back into power soon after the 1995 general election by forming a coalition with the Socialist party.

The Socialist party leader was initially the Prime Minister then he resigned later and was replaced by an LDP Prime Minister.

The grip on power of the LDP was consolidated by the great competence of the Koizumi administration.

Source: Edward Prescott

The LDP lost power again in about 2007 but regained power in the next election through the extreme incompetence of their opposition.

In the current election, the main opposition party were unable even to put up enough candidates to actually win a majority.

The key contribution of the main opposition parties in Japan was well stated when they last won an election in 2007. They have shown that they can actually win an election when the LDP performs poorly. That is an important discipline that may not have been there in the 1980s.

via Abe’s snap election pays off with big win for LDP | The Japan Times.

Milton Friedman’s plucking model of the business cycle

Friedman (1993) proposed a model of the depth of recessions and steepness of recoveries built on two empirical regularities:

  1. output is on average below a ceiling defined by supply capacity and tends back to this ceiling; and
  2. large contractions are followed by large expansions and mild contractions are followed by mild expansions.

The strength of a recovery should be positively correlated with depth of the recession but there should be no correlation between expansions and recessions (Friedman 1993; Alchian 1969).

Figure 1 illustrates Friedman’s model, which likens the time path of output to a string on the underside of an upward sloping board that is plucked downward at random intervals to various extents into busts that are followed by booms.

Figure 1: Friedman’s plucking model of the economic fluctuations

Source: Garrison (1996).

The upward sloping board plotted as a thick line in Figure 6 represents a ceiling on feasible output and employment in a given year that is set by resource and technology availabilities. The upward slope of this board accounts for trend real GDP growth over time due to technological progress and other factors.

Output is close to the ceiling shown in Figure 6 except for every now and then when it is plucked downwards by a monetary contraction.

There is no floor on these contractions in output to moderate the depth and violence of contractions, so some recessions are deep and sharp (Hansen and Prescott 2005; Friedman 1993; Goodwin and Sweeney 1993; Sichel 1993).

Contraction depth can vary greatly as is shown by the minor, mild and deep recessions in Figure 1. In each episode of plucking illustrated in Friedman’s model in Figure 1, the rebound mirrors the previous fall in output, but the recovery cannot go beyond the ceiling.

Friedman’s model is a bust-boom model of business cycle fluctuations. The business cycle starts with a bust caused by an adverse policy or other shock and is then followed by a boom as the market self-adjusts and the policy errors are reversed.

Without the initial adverse policy or other shock, there would neither be a bust nor a boom. The economy would track close to the ceiling on output and employment as is shown in Figure 1 by the periods between the plucks.

The correlation between busts and booms arises from the monetary contraction that caused the bust eventually inducing an offsetting correction in monetary policy.

The monetary contraction that pushed or plucked output below the upward sloping ceiling is later followed by a monetary expansion that offset the earlier contraction.

With the amplitude of monetary expansions correlated to offset the prior contractions, GDP growth will have similar plucks or falls and rebounds to the upward sloping output ceiling because of the link albeit with a lag between monetary growth and output fluctuations.

The increases and decreases in monetary growth are independent policy choices with unique causes.

The associated upward and downward movements in GDP growth are not correlated with each other but should be correlated with the prior fluctuations in monetary growth.

There would not be a bust and later boom if there is no monetary contraction to start the cycle. This is why Friedman (1993) proposed that the depths of busts are unrelated to duration and strength of prior economic booms. This upset Austrians such as Roger Garrison:

…Austrians work at a lower level of aggregation in order to allow for the outputs of the two sectors to move relative to one another and even to allow for differential movements within the investment-goods sector…

During a credit-induced boom, investment in the relatively high stages of production is excessive in that resources are drawn away (by an artificially low rate of interest) from the relatively low stages of production and from the final stage, consumption.

The decrease in the amount of resources allocated to the low and final stages is forced saving; the misallocation of resources from low to high stages is malinvestment.

Empirically, a credit-induced boom would be but weakly reflected in the conventional investment aggregate and hardly at all in the Monetarists’ output aggregate, which includes consumption.

The boom for the Austrians refers to something going on largely within the output aggregate.

It is represented in Friedman’s plucking model not by a conspicuous recovery to trend but rather by some period preceding a pluck which Friedman, operating at a higher level of aggregation, presumes to be healthy growth.

The publication of Milton Friedman’s paper in 1993, which recalled an obscure paper he wrote in 1964, lead to a large literature blossoming under the heading business cycle asymmetry.

Previous Older Entries Next Newer Entries

David Andolfatto

Celebrating humanity's flourishing through the spread of capitalism and the rule of law

Monetary Non-Neutrality

Celebrating humanity's flourishing through the spread of capitalism and the rule of law

Reason Magazine

Celebrating humanity's flourishing through the spread of capitalism and the rule of law

Coyote Blog

Celebrating humanity's flourishing through the spread of capitalism and the rule of law

Thoughts from the North

Celebrating humanity's flourishing through the spread of capitalism and the rule of law

Fardels Bear

A History of the Alt-Right

Vincent Geloso

Econ Prof at George Mason University, Economic Historian, Québécois

Bassett, Brash & Hide

Celebrating humanity's flourishing through the spread of capitalism and the rule of law

Truth on the Market

Scholarly commentary on law, economics, and more

The Undercover Historian

Beatrice Cherrier's blog

Matua Kahurangi

Celebrating humanity's flourishing through the spread of capitalism and the rule of law

Temple of Sociology

Celebrating humanity's flourishing through the spread of capitalism and the rule of law

Velvet Glove, Iron Fist

Celebrating humanity's flourishing through the spread of capitalism and the rule of law

Why Evolution Is True

Why Evolution is True is a blog written by Jerry Coyne, centered on evolution and biology but also dealing with diverse topics like politics, culture, and cats.

NoTricksZone

Celebrating humanity's flourishing through the spread of capitalism and the rule of law

Homepaddock

A rural perspective with a blue tint by Ele Ludemann

Kiwiblog

DPF's Kiwiblog - Fomenting Happy Mischief since 2003

The Dangerous Economist

Celebrating humanity's flourishing through the spread of capitalism and the rule of law

Watts Up With That?

The world's most viewed site on global warming and climate change

The Logical Place

Tim Harding's writings on rationality, informal logic and skepticism

Doc's Books

A window into Doc Freiberger's library

The Risk-Monger

Let's examine hard decisions!

Uneasy Money

Commentary on monetary policy in the spirit of R. G. Hawtrey

Barrie Saunders

Thoughts on public policy and the media

Liberty Scott

Celebrating humanity's flourishing through the spread of capitalism and the rule of law

Point of Order

Politics and the economy

James Bowden's Blog

A blog (primarily) on Canadian and Commonwealth political history and institutions

Science Matters

Reading between the lines, and underneath the hype.

Peter Winsley

Economics, and such stuff as dreams are made on

A Venerable Puzzle

"The British constitution has always been puzzling, and always will be." --Queen Elizabeth II

The Antiplanner

Celebrating humanity's flourishing through the spread of capitalism and the rule of law

Bet On It

Celebrating humanity's flourishing through the spread of capitalism and the rule of law

History of Sorts

WORLD WAR II, MUSIC, HISTORY, HOLOCAUST

Roger Pielke Jr.

Undisciplined scholar, recovering academic

Offsetting Behaviour

Celebrating humanity's flourishing through the spread of capitalism and the rule of law

JONATHAN TURLEY

Res ipsa loquitur - The thing itself speaks

Conversable Economist

In Hume’s spirit, I will attempt to serve as an ambassador from my world of economics, and help in “finding topics of conversation fit for the entertainment of rational creatures.”

The Victorian Commons

Researching the House of Commons, 1832-1868

The History of Parliament

Articles and research from the History of Parliament Trust

Books & Boots

Reflections on books and art

Legal History Miscellany

Posts on the History of Law, Crime, and Justice

Sex, Drugs and Economics

Celebrating humanity's flourishing through the spread of capitalism and the rule of law

European Royal History

Exploring the Monarchs of Europe

Tallbloke's Talkshop

Cutting edge science you can dice with

Marginal REVOLUTION

Small Steps Toward A Much Better World

NOT A LOT OF PEOPLE KNOW THAT

“We do not believe any group of men adequate enough or wise enough to operate without scrutiny or without criticism. We know that the only way to avoid error is to detect it, that the only way to detect it is to be free to inquire. We know that in secrecy error undetected will flourish and subvert”. - J Robert Oppenheimer.