Romer and Romer vs. Reinhart and Rogoff – MoneyBeat – WSJ

Identifying financial crises after the fact is problematic: researchers will disagree on what their characteristics were, when they started and ended, and what actually counts as a crisis. This is particularly true of crises before World War II or involving developing economies, for which accurate data are harder to come by.

So the Romers created a measure of financial distress based on real-time accounts of developed-economy conditions prepared semiannually by the Organisation for Economic Co-Operation and Development between 1967 and 2007. And to check that the OECD wasn’t for some reason off-base on conditions, they crosschecked it with central bank annual reports and articles in The Wall Street Journal.

They then scored the severity of financial conditions from zero to 15, thus avoiding quibbles over what is and isn’t a crisis and allowing for more precise readings of economic effects.

Their finding: Declines in economic output, as measured by gross domestic product and industrial production, following crises were on average moderate and often short-lived. There was a lot of variation in outcomes, so there was nothing cut and dried about how economies respond to crises…

via Romer and Romer vs. Reinhart and Rogoff – MoneyBeat – WSJ.

Romers’ work suggests the poor performance of economies around the world in the wake of the 2008 financial crisis shouldn’t be cast as inevitable. In The Current Financial Crisis: What Should We Learn From the Great Depressions of the 20th Century? de Cordoba and Kehoe note that:

 Kehoe and Prescott [2007] conclude that bad government policies are responsible for causing great depressions. In particular, they hypothesize that, while different sorts of shocks can lead to ordinary business cycle downturns, overreaction by the government can prolong and deepen the downturn, turning it into a depression.

An Open Letter to Paul Krugman | David K. Levine

via An Open Letter to Paul Krugman | David K. Levine.

Policy bubbles alert: Innovation is a market process of discovery, diffusion, learning by using, entrepreneurial experimentation and decentralised adaptation

Image

Some graphs on the great deviation on both sides of the Atlantic

Figure 1: Actual and potential GDP in the US

Sources: Congressional Budget Office, Bureau of Economic Analysis

Figure 2: Actual and potential GDP in the Eurozone

Sources: IMF World Economic Outlook Databases, Bloomberg

HT: Larry Summers

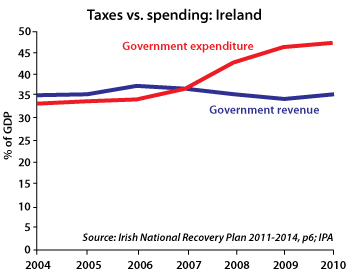
Friday graph: why Ireland is broke

I am planning to blog on why the Irish economic crisis of recent years was caused exclusively by government, and in particular, government responses that made an ordinary recession into a depression

Business Roundtable's avatarRoger Kerr, New Zealand Business Roundtable Executive Director

This is a graph courtesy of the Institute of Public Affairs in Melbourne, an impressive Australian thinktank.

It comes from the Irish government’s own 140 page ‘National Recovery Plan‘ published last week.

It is amazing reading.

  • From 2000 to 2009 average public sector salaries increased 59%
  • In 2004, 34% of income earners were exempt from tax. In 2010, 45% were exempt
  • In 2007 property taxes generated 6.7 billion euros.  In 2010 that figure will be 1.6 billion
  • In 2009 interest on government debt was 8% of tax revenues.  In 2014 it will be 20%.

Naysayers try to tell you that the Celtic Tiger was a myth and that free-market policies brought the Irish economy down.

The truth is exactly the opposite.  Liberalisation caused the Irish economy to surge until a return to big government crushed it.  Membership of the eurozone, poor banking regulation and the government guarantee of…

View original post 34 more words

Policy bubbles alert: most innovation is not about R&D (and boffins in lab coats)

The fire of truth: the relationship between inequality and economic prosperity in New Zealand since the 1970s

Figure 1: Before Housing Costs Gini coefficient, New Zealand, 1982 – 2013

closertogether.org.nz/nzs-income-inequality-problem claims that NZ income inequality increased very rapidly in the late 1980s and 1990s — faster than in any other wealthy country.

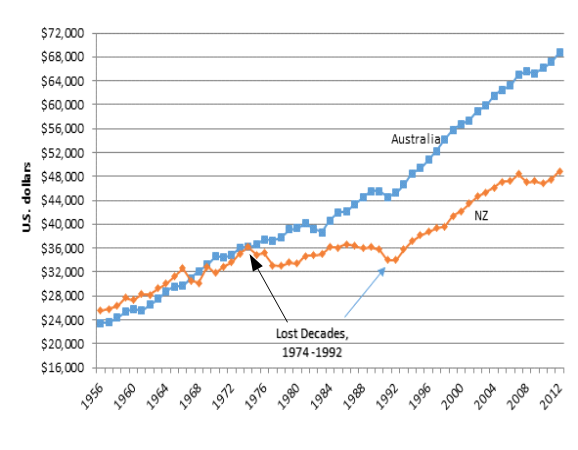
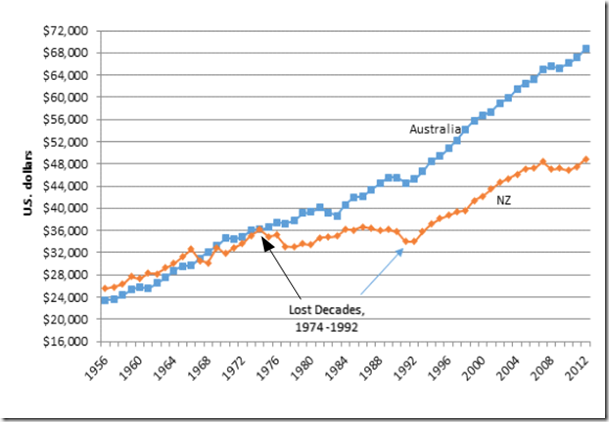
Figure 2 shows that this rapid rise in inequality coincided with the resumption of economic growth after two lost decades: next to no increase in real GDP per working age New Zealander from 1974 to 1992.

Figure 2: Real GDP per New Zealander and Australian aged 15-64, converted to 2013 price level with updated 2005 EKS purchasing power parities, 1956-2012
image

Source: Source: Computed from OECD Stat Extract and The Conference Board, Total Database, January 2014, http://www.conference-board.org/economics

Perry (2014) found that:

  • Income inequality in New Zealand is at a similar level to Australia, Canada, Italy and Japan (Ginis of 32-33) and a little lower than the UK (34). Countries such as Denmark, Norway, Finland and Belgium have lower than average inequality (Ginis of 25-26). The US and Israel have higher scores of 39.
  • The top 1% in New Zealand received around 8% of all taxable income in 2010 and 2011 (before tax), similar to Norway, Finland and Australia, lower than Ireland and Switzerland (11%) and much lower than the UK and Canada (13%) and the US (18%).
  • The trend for the New Zealand share has been steady at around 8-9% since the mid 1990s, with perhaps a slight fall in the last few years. Many OECD countries saw small rises in the period, and in the USA the top 1% share continued to rise strongly, from 13% to 19%.

Perry (2014) concluded that:

Overall, there is no evidence of any sustained rise or fall in inequality in the last two decades. The level of household disposable income inequality in New Zealand is a little above the OECD median. The share of total income received by the top 1% of individuals is at the low end of the OECD rankings.

This remark by Parry that there is no evidence of any sustained rise or fall in inequality in New Zealand in the last 20 years  is very much at odds with the claim of Closer Together New Zealand that income inequality inequality increased rapidly in the late 1980s and 1990s.

The increase in inequality in New Zealand  was in the late 1980s  and early 1990s. In the early 1990s, a long economic boom started that lasted until the global financial crisis.

Figure 3 : Income Inequality in New Zealand as Assessed by the Gini Coefficient

Source: Perry 2014 derived from Statistics NZ Household Economic Survey (HES) 1982–2012.

Figure 4: Income Inequality in New Zealand as Assessed by the P80/P20 Ratio

Source: Perry 2014 derived from Statistics NZ Household Economic Survey (HES) 1982–2012.

Figures 3 and 4 both show that after housing costs inequality in New Zealand is higher, but has been pretty stable for 20 years as measured by the Gini coefficient and by the P80/P20  ratio. (When individuals are ranked by equivalised household income and then divided into 100 equal groups, each group is called a percentile. If the ranking starts with the lowest income, then the income at the top of the 20th percentile is denoted P20; the income at the top of the 80th percentile is called P80. The ratio of the value at the top of the 80th percentile to the value at the top of the 20th percentile is called the P80/20 ratio and is often used as a measure of income inequality).

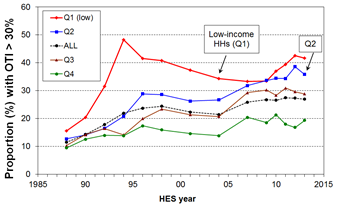
Figure 5: Proportion of HHs with housing cost outgoings to income of greater than 30%, by income quintile

clip_image002

Source: Perry (2014); OTI = outgoings to income

Figure 5 shows that

  • for the bottom quintile (Q1), the proportion with high outgoings to income (OTI) steadily reduced from 48% in 1994 to 34% in 2004, as unemployment fell, employment and income rose, and income-related rental policies were introduced in 2000 for those in HNZC houses. From HES 2009 to HES 2013 the proportion rose strongly from 33% to 42%, the highest it has been in the last 25 years except for the peak of 48% in 1994.
  • For households with incomes in the second quintile (Q2) there was a strong rise from the 1980s through to the mid 1990s, followed by a relatively flat trend to 2004. Since 2004, the proportion with high OTIs has risen strongly from 27% to 36%.
  • For the third quintile (Q3) the proportion with high OTIs settled at around 30% for 2007 to 2013, up from 21% in 2004 and 10% in 1988.

Rising housing costs in New Zealand have one explanation, which is restrictions on the supply of land under the Resource Management Act.

HT: nzchildren.co.nz/income_inequality for figures 3 and 4.

Murray Rothbard on what is Keynesian macroeconomics

Image

Policy bubbles alert: the R&D fetish is a major threat to innovation and economic growth

Image

Much More to Friedman Than Rule-Based Monetary Policy

Image

A Perspective on Ireland’s Economy

Dot point 4 is the key. The bank guarantee caused the depression.

Business Roundtable's avatarRoger Kerr, New Zealand Business Roundtable Executive Director

Philip Lane is Professor of International Macroeconomics at Trinity College Dublin.  He is also a managing editor of the journal Economic Policy, the founder of The Irish Economy blog, and a research fellow of the Centre for Economic Policy Research.  His research interests include financial globalisation, the macroeconomics of exchange rates and capital flows, macroeconomic policy design, European Monetary Union, and the Irish economy.

Last week he visited New Zealand as a guest of the Treasury, the Reserve Bank, and Victoria University.  During his visit he presented this guest lecture on the troubled Irish economy, drawing on his recent report to the Irish Parliament’s finance committee on ‘Macroeconomic Policy and Effective Fiscal and Economic Governance’.

Some highlights from his talk (also reported here by Brian Fallow in the New Zealand Herald) were:

  • Ireland’s is a real depression: 15% fall in GDP 2007-2010
  • The Celtic Tiger 1994-2001 was no…

View original post 216 more words

Paul Krugman (1998) on the fiscal politics of the minimum wage/living wage movement

Image

Edmund Phelps on the golden rule

Image

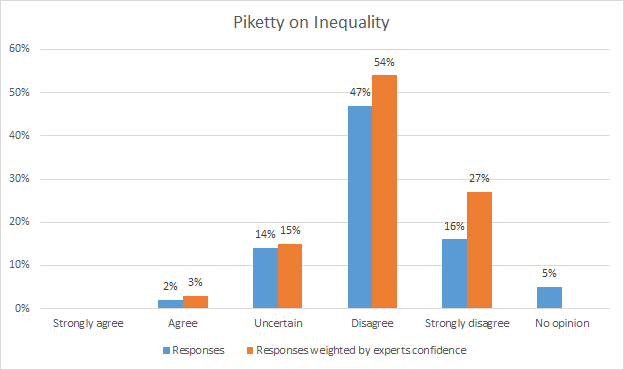
Piketty on inequality: views of the IGM economic experts

image

Question: The most powerful force pushing towards greater wealth inequality in the US since the 1970s is the gap between the after-tax return on capital and the economic growth rate?

Daron Acemoglu and James Robinson have a simple explanation for why Piketty is wrong:

But like Marx, Piketty goes wrong for a very simple reason. The quest for general laws of capitalism or any economic system is misguided because it is a-institutional.

It ignores that it is the institutions and the political equilibrium of a society that determine how technology evolves, how markets function, and how the gains from various different economic arrangements are distributed.

Despite his erudition, ambition, and creativity, Marx was ultimately led astray because of his disregard of institutions and politics. The same is true of Piketty.

David Friedman on the causes of the global financial crisis and the great recession

Image

Previous Older Entries Next Newer Entries

David Andolfatto

Celebrating humanity's flourishing through the spread of capitalism and the rule of law

Monetary Non-Neutrality

Celebrating humanity's flourishing through the spread of capitalism and the rule of law

Reason Magazine

Celebrating humanity's flourishing through the spread of capitalism and the rule of law

Coyote Blog

Celebrating humanity's flourishing through the spread of capitalism and the rule of law

Thoughts from the North

Celebrating humanity's flourishing through the spread of capitalism and the rule of law

Fardels Bear

A History of the Alt-Right

Vincent Geloso

Econ Prof at George Mason University, Economic Historian, Québécois

Bassett, Brash & Hide

Celebrating humanity's flourishing through the spread of capitalism and the rule of law

Truth on the Market

Scholarly commentary on law, economics, and more

The Undercover Historian

Beatrice Cherrier's blog

Matua Kahurangi

Celebrating humanity's flourishing through the spread of capitalism and the rule of law

Temple of Sociology

Celebrating humanity's flourishing through the spread of capitalism and the rule of law

Velvet Glove, Iron Fist

Celebrating humanity's flourishing through the spread of capitalism and the rule of law

Why Evolution Is True

Why Evolution is True is a blog written by Jerry Coyne, centered on evolution and biology but also dealing with diverse topics like politics, culture, and cats.

NoTricksZone

Celebrating humanity's flourishing through the spread of capitalism and the rule of law

Homepaddock

A rural perspective with a blue tint by Ele Ludemann

Kiwiblog

DPF's Kiwiblog - Fomenting Happy Mischief since 2003

The Dangerous Economist

Celebrating humanity's flourishing through the spread of capitalism and the rule of law

Watts Up With That?

The world's most viewed site on global warming and climate change

The Logical Place

Tim Harding's writings on rationality, informal logic and skepticism

Doc's Books

A window into Doc Freiberger's library

The Risk-Monger

Let's examine hard decisions!

Uneasy Money

Commentary on monetary policy in the spirit of R. G. Hawtrey

Barrie Saunders

Thoughts on public policy and the media

Liberty Scott

Celebrating humanity's flourishing through the spread of capitalism and the rule of law

Point of Order

Politics and the economy

James Bowden's Blog

A blog (primarily) on Canadian and Commonwealth political history and institutions

Science Matters

Reading between the lines, and underneath the hype.

Peter Winsley

Economics, and such stuff as dreams are made on

A Venerable Puzzle

"The British constitution has always been puzzling, and always will be." --Queen Elizabeth II

The Antiplanner

Celebrating humanity's flourishing through the spread of capitalism and the rule of law

Bet On It

Celebrating humanity's flourishing through the spread of capitalism and the rule of law

History of Sorts

WORLD WAR II, MUSIC, HISTORY, HOLOCAUST

Roger Pielke Jr.

Undisciplined scholar, recovering academic

Offsetting Behaviour

Celebrating humanity's flourishing through the spread of capitalism and the rule of law

JONATHAN TURLEY

Res ipsa loquitur - The thing itself speaks

Conversable Economist

In Hume’s spirit, I will attempt to serve as an ambassador from my world of economics, and help in “finding topics of conversation fit for the entertainment of rational creatures.”

The Victorian Commons

Researching the House of Commons, 1832-1868

The History of Parliament

Articles and research from the History of Parliament Trust

Books & Boots

Reflections on books and art

Legal History Miscellany

Posts on the History of Law, Crime, and Justice

Sex, Drugs and Economics

Celebrating humanity's flourishing through the spread of capitalism and the rule of law

European Royal History

Exploring the Monarchs of Europe

Tallbloke's Talkshop

Cutting edge science you can dice with

Marginal REVOLUTION

Small Steps Toward A Much Better World

NOT A LOT OF PEOPLE KNOW THAT

“We do not believe any group of men adequate enough or wise enough to operate without scrutiny or without criticism. We know that the only way to avoid error is to detect it, that the only way to detect it is to be free to inquire. We know that in secrecy error undetected will flourish and subvert”. - J Robert Oppenheimer.