Some #tax cuts produce more growth than others: https://t.co/oncO22g3Hs @ScottElliotG pic.twitter.com/VlkMz93wUy
— Tax Foundation (@TaxFoundation) December 19, 2015
Some #tax cuts produce more growth than others
12 Jan 2016 Leave a comment
in applied price theory, labour economics, politics - USA, public economics Tags: laffer curve
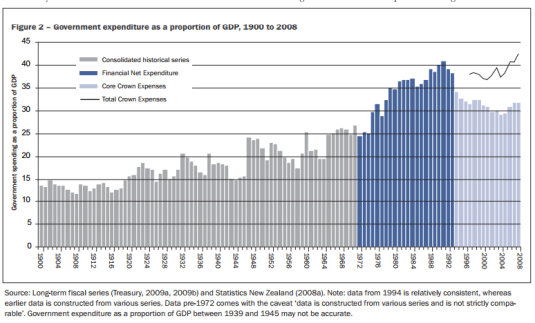
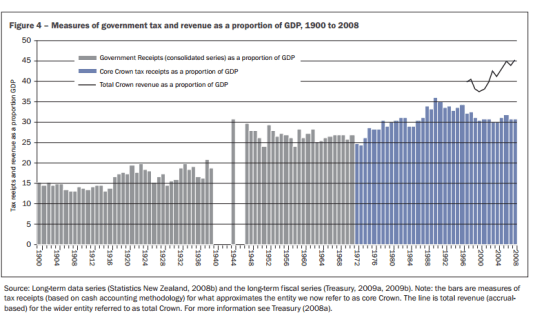
@EricCrampton @conradhackett the size of the New Zealand government since 1900
04 Jan 2016 Leave a comment
in economic history, politics - New Zealand, public economics
Oddly enough, the lost decades of New Zealand growth coincide with the rapid growth in the size of government between 1974 and 1992. The return of growth to New Zealand from 1992 after 17 years of stagnation and next to no real GDP growth coincided with the decline in the size of government.
Source: David Rea 2009.
Source: David Rea 2009.
Top 1% pays almost as much tax as the bottom 95%
27 Dec 2015 1 Comment
in politics - USA, public economics Tags: top 1%
@GarethMorgannz the universal basic income is inferior to the minimum family tax credit
20 Dec 2015 4 Comments
in labour economics, labour supply, politics - New Zealand, poverty and inequality, public economics, welfare reform Tags: Aaron Director, Director's Law, Gareth Morgan, negative income tax, social insurance, universal basic income, welfare state
Gareth Morgan’s universal basic income appears to make everybody better off except those for whom the modern welfare state was established to protect. Examples of these from his online calculator are single mothers and retirees.

Source: The Big Kahuna – Tax and Welfare.
To stay even just with single mothers blows a good $10 billion hole in the budget deficit according to the online calculator provided by Gareth Morgan. Retirees are still worse off.

Source: The Big Kahuna – Tax and Welfare.
Central to the package is a comprehensive capital gains tax despite evidence growing with each day that the optimal tax rates on income from capital and on capital gains are zero.
A universal basic income for New Zealand is a long trip to where we are now. There is already a guaranteed minimum family income in New Zealand.
The minimum family tax credit makes sure that a family’s annual income (net income after tax has been deducted) doesn’t fall below $23,036 a year ($443 per week). To qualify, you must work for a salary or wage for at least 30 hours each week as a couple, or 20 hours each week as a single parent, and receive a family tax credit.
The Treasury modelled a Guaranteed Minimum income at the request of the Welfare Working Group in 2010. A guaranteed minimum income of $300 per week – the mean benefit income among those on benefits – would cost $44.5 billion or $52.6 billion if we extended it to super annuitants as a replacement for NZ Superannuation or old age pension. The former could be covered by a flat personal income tax rate of 45.4%; the latter, 48.6%. Full fiscal neutrality would require tax rates of 50.6% and 54.4%.
The universal basic income seems to be a big day out for Director’s Law of Public Expenditure. Director’s Law is public expenditure is used primary for the benefit of the middle class, and is financed with taxes which are borne in considerable part by the poor and the rich.

The universal basic income and a comprehensive capital gains tax seems to cause a lot of economic upheaval but still struggles to make the worse off groups in society even break-even on this throwing of all the cards in the air. Brian Easton put it well the other day when he said:
Many advocates put the UMI forward without doing the sums. Those who do, find that the required tax rates are horrendous or the minimum income is so low that it is not a viable means of eliminating poverty. Among the latter are New Zealanders Douglas, Gareth Morgan and Keith Rankin.
Income sources of older people in USA, Canada, France, Germany, Australia and New Zealand
18 Dec 2015 Leave a comment
in labour economics, labour supply, public economics Tags: economics of retirement, old-age pension, older workers, social insurance, welfare state

Old age poverty rates in the G7, Australia, New Zealand and Korea
17 Dec 2015 Leave a comment
in labour economics, politics - Australia, politics - New Zealand, politics - USA, poverty and inequality, public economics Tags: old age poverty, old-age pension, social insurance, welfare state

US, British, German, French and Japanese tax revenues as % of GDP, 1965 – 2014
11 Dec 2015 Leave a comment
in economic history, politics - USA, public economics
Despite neoliberalism doing its worst, tax revenues as the percentage of GDP have been pretty stable across the G5.
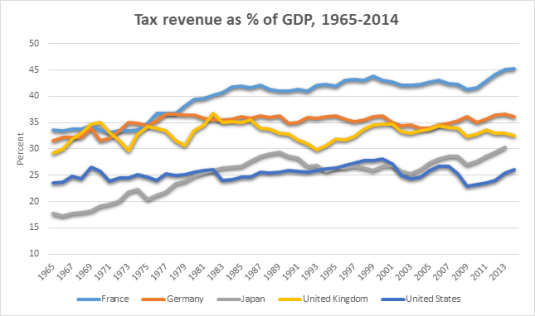
Data extracted on 11 Dec 2015 09:39 UTC (GMT) from OECD.Stat.
Nothing has happened to tax revenues as a percentage of GDP in Germany for a good 40 years. The same pretty much goes for the USA as well but with some ups and downs around the time of the GFC.
Margaret Thatcher’s time as Prime Minister coincided with the fall in tax revenue as a percentage of GDP but John Major did his best to reverse that.
French taxes have been steady since 1981 but started to increase as a percentage of GDP after the GFC. Tax revenues also increased in Japan as a percentage of GDP after the GFC.
Time spent paying taxes in USA, UK, France, Germany, Italy, Japan, Australia and New Zealand
08 Dec 2015 Leave a comment
in economics of bureaucracy, public economics
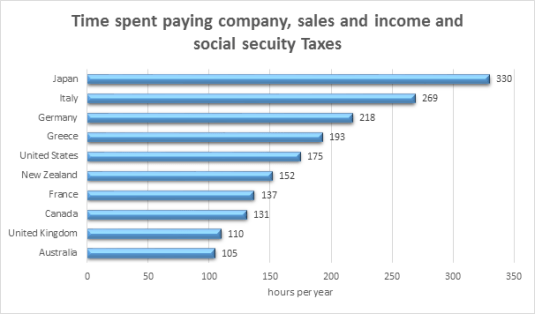
Source: Download: Paying Taxes 2016: PwC.
How Scandinavian Countries Pay for Their Government Spending
20 Nov 2015 1 Comment
in politics - Australia, politics - New Zealand, politics - USA, Public Choice, public economics Tags: Denmark, Finland, growth of government, Norway, Scandinavia, size of government, Sweden, taxation and entrepreneurship, taxation and investment, taxation and labour supply, welfare state
US, UK, Danish and Swedish tax revenues as % of GDP since 1966
13 Nov 2015 Leave a comment
in economic history, public economics, Sam Peltzman
You can’t find Reaganomics in the tax statistics below. Maggie Thatcher stopped a rapid growth in British tax revenues which caused the UK to become the sick man of Europe. She then unwound that growth in tax revenues as a percentage of British GDP. The election of the Blair government in 1997 stopped the rapid growth in tax revenues as a share of British GDP under that double secret socialist John Major. As Sam Peltzman previously noticed, the growth the government stopped in Denmark and Sweden in the mid-1980s.
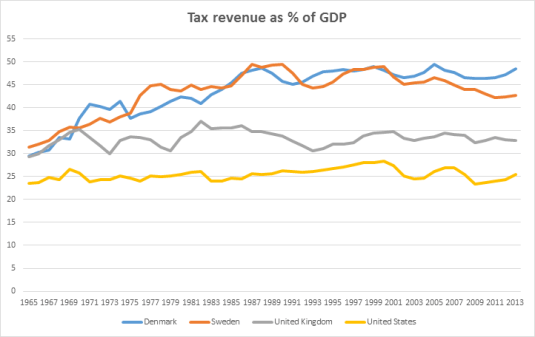
Data extracted on 12 Nov 2015 23:56 UTC (GMT) from OECD.Stat
Eurosclerosis illustrated in the labour market
13 Nov 2015 Leave a comment
in economic history, Euro crisis, labour economics, labour supply, macroeconomics, politics - USA, public economics Tags: employment law, Eurosclerosis, France, Germany, growth of government, labour market regulation, size of government, taxation and labour supply

Source: Linda Regber.
Do the European welfare states free ride off American entrepreneurship and innovation?
12 Nov 2015 1 Comment
in applied price theory, applied welfare economics, comparative institutional analysis, constitutional political economy, economic history, economics of regulation, entrepreneurship, industrial organisation, politics - USA, public economics, survivor principle, taxation, technological progress Tags: creative destruction, Daron Acemoglu, Denmark, entrepreneurial alertness, Eurosclerosis, international technology diffusion, taxation and entrepreneurship, taxation and innovation, taxation and investment, taxation and labour supply, technology followers, welfare state

Source: Daron Acemoglu A Scandinavian U.S. Would Be a Problem for the Global Economy – NYTimes.com.
Did @MaxRashbrooke make his case for wealth and inheritance taxes?
08 Nov 2015 2 Comments
in applied price theory, applied welfare economics, politics - New Zealand, public economics
Veteran left-wing grumbler Max Rashbrooke yesterday argued for a wealth tax and inheritance taxes in New Zealand because of a widening wealth gap. He wants to tax inheritances of more than a mere $200,000 over your lifetime!
Yeah, I mean, we really are an international outlier in the sense that we don’t really tax wealth in any form. We don’t tax capital gains except now in very limited circumstances. We don’t tax inheritances. We don’t tax gifts. We don’t tax wealth in general, and this is a complicated area. In a lot of countries inheritance taxes are falling out of fashion. They get called death taxes and that kind of thing. But in response to that, what a lot of people are talking about are things like kind of a lifetime capital receipts tax. So rather than taxing the giver, you tax the recipient, and you say, ‘Look, over your lifetime, you can inherit, say, $200,000 tax free,’ so that your parents can pass on a bit to you.
That means an inheritance tax on the family home given current house prices in Auckland and Wellington and small families. I can’t see the Labour Party or even the Greens following him in on that one if they want to win office ever again.
Did Rashbrooke make a case for a widening wealth gap by looking at a 2004 survey of income and wealth?
Currently, the most recent publicly available information on wealth inequality in New Zealand comes from the 2004 round of the Survey of Family, Income and Employment, known as Sofie… Because wealthy people often refuse to take part in surveys such as Sofie, such data tends to underestimate how much of the pie is owned by the wealthiest people and overstate the share of everyone else. But it is still the best data we have.
Rashbrooke used this 2004 survey to draw a number of conclusions about the distribution of wealth in New Zealand:
The wealthiest tenth of individuals (including that wealthiest one per cent) had 52 per cent of all assets. In contrast, the poorest half of the country had just five per cent of all wealth. Some 190,000 people had negative net worth (more debts than assets), owing $4.7 billion between them.
Did Rashbrooke make his case that there is 52% of all assets in New Zealand are held by the wealthiest 10%? He did not because his definition wealth is too incomplete. Because of that, his focus on inheritance taxes and wealth taxes as solutions are equally poorly made. Any definition of wealth including that by Rashbrooke that doesn’t include human capital or acknowledge the limitations of not including human capital isn’t worth serious attention in public policy circles.

Source: Gary Becker, ‘Give Us Your Skilled Masses’ (2005).
Rashbrooke ignores 70% of the capital, the wealth in any economy. Gary Becker’s estimate that human capital is 70% of all capital in the US economy travels well to New Zealand as shown in the chart below.
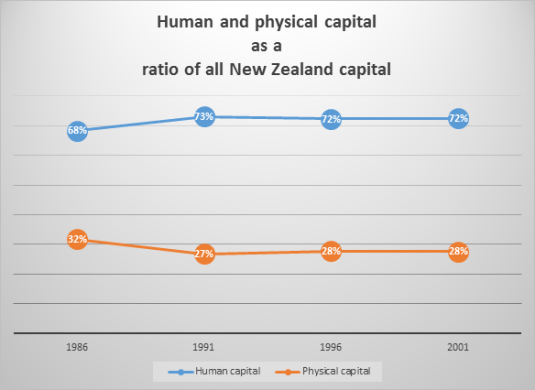
Source: Lˆe Thi. Vˆan Tr`ınh, Estimating the monetary value of the stock of human capital for New Zealand, University of Canterbury PhD thesis (September 2006), Table 4.8: Human and physical capital stocks.
Over 70% of all capital in New Zealand is human capital. That cannot be ignored in any discussion of a widening wealth gap or in a case for inheritance and wealth taxes.
Dollar value estimates were available to Rashbrooke of human and physical capital of the same vintage as his wealth data from an excellent New Zealand PhD thesis by Lˆe Thi. Vˆan Tr`ınh. Her estimates of the aggregate dollar value of New Zealand physical and human capital are charted below. These estimates show that physical capital doubled between 1981 and 2001 but New Zealand human capital quadrupled.

Source: Lˆe Thi. Vˆan Tr`ınh, Estimating the monetary value of the stock of human capital for New Zealand, University of Canterbury PhD thesis (September 2006), Table 4.8: Human and physical capital stocks.
The rich are clearly not getting richer and the poor getting poorer and some people have no wealth at all. Human capital is the dominant form of capital in New Zealand and is growing rapidly. Any discussion of wealth does not include estimates of human capital or acknowledge the limitations of not having those estimates, which are easily available, should not be considered in public policy debates on inequality.
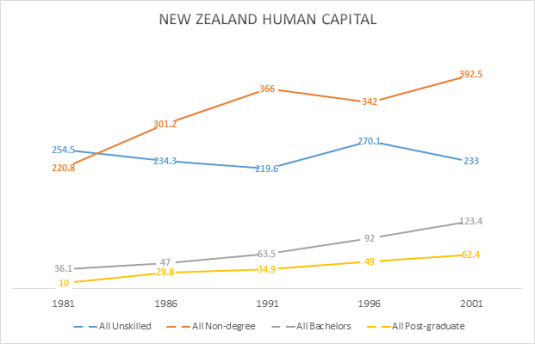
Source: Lˆe Thi. Vˆan Tr`ınh, Estimating the monetary value of the stock of human capital for New Zealand, University of Canterbury PhD thesis (September 2006).
The only group in New Zealand that doesn’t have more human capital in 2001 than in 1981 were the unskilled as the chart above shows. This was because their numbers dropped by one-third as a share of the working age population.

Source: Lˆe Thi. Vˆan Tr`ınh, Estimating the monetary value of the stock of human capital for New Zealand, University of Canterbury PhD thesis (September 2006), table 3.1.
I don’t think a solution to skills gaps is to increases taxes on those who investing in human capital. But that is the logic of Rashbrooke. When someone gets ahead, drag them back down rather than lift everybody up.
The reason for the lack of growth in the dollar value of unskilled human capital is the massive increase in investment in higher education in New Zealand. More New Zealanders go to university, Polytech or other diploma education. Working class New Zealanders are taking the advice of that unrepentant Stalinist but brilliant screenwriter Dalton Trumbo.

What is most disappointing is the unrepentant lack of gender analysis in the writings of Max Rashbrooke on inequality and wealth. Without a gender analysis, no discussion of wealth and inequality in New Zealand has any meaning.
Few labour market statistics have any meaning unless broken down by gender. Whenever you don’t see statistics with a gender breakdown, the first question for any sort of credible audience is “Gender analysis! Gender analysis! Where is your gender analysis?”
Max Rashbrooke inadvertently illustrated the meaningless of statistics that don’t have a gender analysis when griping recently about poverty and inequality in New Zealand as compared to the good old days before the economic reforms of the 1980s.
To paint pre-1984 New Zealand, pre-neoliberal New Zealand as an egalitarian paradise, Rashbrooke had to ignore two thirds of the population. He brushed over the inequalities they suffered in the heavily regulated, heavily taxed economy so looked upon with dewy eyes by the left of politics:
“New Zealand up until the 1980s was fairly egalitarian, apart from Maori and women, our increasing income gap started in the late 1980s and early 1990s,” says Rashbrooke. “These young club members are the first generation to grow up in a New Zealand really starkly divided by income”.
Racism and patriarchy can sit comfortably with a fairly egalitarian society if you are to believe a leading spokesman of the Left. I disagree as would John Rawls with this boy’s own view of trends in New Zealand inequality. Boy’s own because trends in gender inequality are not discussed. No weight is given to the closing of the gender pay gap, a massive increase in female employment and women out-numbering male university new graduates for well over a decade.

Perry (2014) reviews the poverty and inequality data in New Zealand every year for the Ministry of Social Development. He concluded that:
Overall, there is no evidence of any sustained rise or fall in inequality in the last two decades. The level of household disposable income inequality in New Zealand is a little above the OECD median. The share of total income received by the top 1% of individuals is at the low end of the OECD rankings.
As there is no evidence of any sustained rise or fall on inequality New Zealand for the last 20 years, the case for inheritance and wealth taxes simply doesn’t get out of the box.
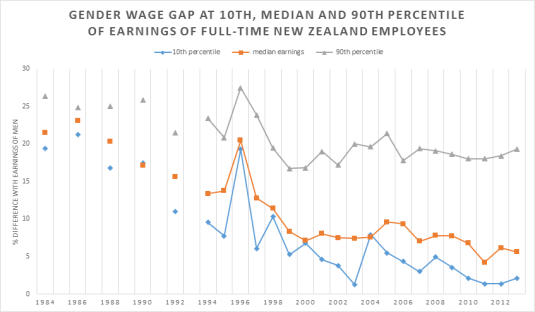
Source: OECD Employment Database.
That case for inheritance and wealth taxes by Max Rashbrooke doesn’t deserve to get into the box to go under starter’s orders if that analysis doesn’t include an analysis of human capital and a gender analysis. For example, male human capital increased by 31% in New Zealand between 1981 and 2001. Over the same period, female human capital increased by 112%. This not insignificant achievement in gender empowerment by capitalism and freedom bears celebration in any discussion of inequality.
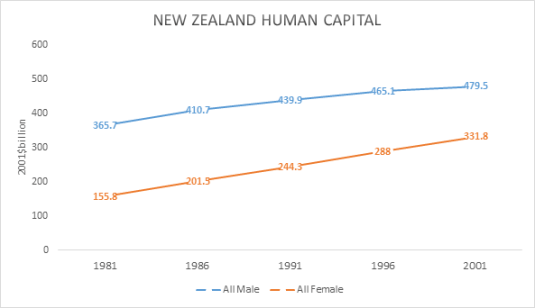
Source: Lˆe Thi. Vˆan Tr`ınh, Estimating the monetary value of the stock of human capital for New Zealand, University of Canterbury PhD thesis (September 2006).
The only group of women for whom the gender pay gap has not all but disappeared over the last 30 years are the top 10% of women. This is the very group that Max Rashbrooke wants to tax heavily to prevent them accumulating and inheriting wealth.
The reason for those taxes on wealth and inheritances on successful women in the professions and business is growth in inequality but there is little to no evidence of that in New Zealand for at least 20 years.
How many of the richest Americans inherited their fortune? Find out. buff.ly/1DNM3g2 http://t.co/QlarE5yAdT—
HumanProgress.org (@humanprogress) August 14, 2015
The case of wealth and inheritance taxes as a way of coping with inequality is just not keeping up with recent trends in superstar wealth. New Zealand top 1% is lazy when compared to their more entrepreneurial American brothers.
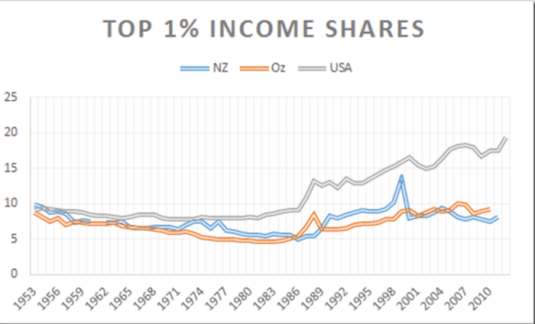
Source: The World Top Incomes Database.
Our local top 1% earns the same share of total income as 30 years ago or even 60 years ago. Any growth in wealth gaps in New Zealand isn’t showing up in top incomes shares.

Source: The World Top Incomes Database.
As for overseas, Piketty and Saez (2003) concluded that a substantial fraction of the rise in top incomes was due to surging top wage incomes. These world-renowned social economists concluded that top executives (the ‘working rich‘) replaced top capital owners (the ‘rentiers’) at the top of the income hierarchy in the USA and Canada. The largest portion of the top incomes comes from earning wages. Top wage earners work for their living founding, building and/or directing successful businesses.

What’s the difference between embedded neoliberalism and Director’s Law of public expenditure?
06 Nov 2015 Leave a comment
in economic growth, economic history, fiscal policy, George Stigler, Marxist economics, Public Choice, public economics Tags: conspiracy theories, growth of government, Leftover Left, median voter theorem, neoliberalism, rational ignorance, Sam Peltzman, size of government
I learnt a new word today off the back of Jane Kelsey winning a $600,000 Marsden grant to study embedded neoliberalism and her latest transnational conspiracy theory about trade agreements.
I’ve never heard of embedded liberalism before today despite a keen interest in popular and academic news. I don’t think I’m poorer for that ignorance but let’s push on. According to that source of all knowledge and truth Wikipedia, embedded neoliberalism’s been around for about 35 years:
Embedded liberalism is a term for the global economic system and the associated international political orientation as it existed from the end of World War II to the 1970s. The system was set up to support a combination of free trade with the freedom for states to enhance their provision of welfare and to regulate their economies to reduce unemployment. The term was first used by the American political scientist John Ruggie in 1982.[1]
Mainstream scholars generally describe embedded liberalism as involving a compromise between two desirable but partially conflicting objectives. The first objective was to revive free trade. BeforeWorld War I, international trade formed a large portion of global GDP, but the classical liberal order which supported it had been damaged by war and by the Great Depression of the 1930s. The second objective was to allow national governments the freedom to provide generous welfare programmes and to intervene in their economies to maintain full employment.[2] This second objective was considered to be incompatible with a full return to the free market system as it had existed in the late 19th century—mainly because with a free market in international capital, investors could easily withdraw money from nations that tried to implement interventionist and redistributive policies.[3]
The resulting compromise was embodied in the Bretton Woods system, which was launched at the end of World War II. The system was liberal[4] in that it aimed to set up an open system of international trade in goods and services, facilitated by semi fixed exchange rates. Yet it also aimed to “embed” market forces into a framework where they could be regulated by national governments, with states able to control international capital flows by means of capital controls. New global multilateral institutions were created to support the new framework, such as the World Bank and theInternational Monetary Fund.
Source: Embedded liberalism – Wikipedia, the free encyclopedia.
Decoding Marxist rhetoric is never easy, but I think what these academic Marxists are trying to do is describe the rise of the mixed economy and the welfare state over the course of the early and middle parts of 20th century.

The welfare state was never an easy thing for your card-carrying Marxist looking forward to the immiserisation of the proletariat as the trigger for the proletarian revolution.
Embedded neoliberalism mostly all about what Aaron Director in the 1950s explained as the reasons for the growth of government in the 20th century. He put forward what George Stigler label for him Director’s Law of Public Expenditure. George Stigler published an article on this law because Aaron Director published next to nothing for reasons no one understands. Director founded law and economics through teaching law classes at the University of Chicago law school.
Long live the Slopegraph. Long live Edward Tufte. tinyurl.com/naeh7rc http://t.co/C8Lgnupxz9—
Amity Shlaes (@AmityShlaes) May 16, 2015
Sam Peltzman pointed out that most of modern public spending is supported by the median voter – the ‘swinging’ voter. He observed that governments at the start of the 20th century were a post office and a military; at the end of the 20th century, governments are a post office, a larger military and a very large welfare state.
Studies starting from Peltzman in 1980 showed that governments grew in line with the growth in the size and homogeneity of the middle class that was organised and politically articulate enough to implement a version of Director’s Law.
Director’s Law of public expenditure is that public expenditure is used primary for the benefit of the middle class, and is financed with taxes which are borne in considerable part by the poor and the rich. Based on the size of its population and its aggregate wealth, the middle class will always be the dominant voting bloc in a modern democracy. Growth in the size of governments across the developed world took off in the mid-20th century as the middle class blossomed. Peltzman maintained that:
“The levelling of income differences across a large part of the population … has in fact been a major source of the growth of government in the developed world over the last fifty years” because the levelling created “a broadening of the political base that stood to gain from redistribution generally and thus provided a fertile source of political support for expansion of specific programs. At the same time, these groups became more able to perceive and articulate that interest … [and] this simultaneous growth of ‘ability’ served to catalyse politically the spreading economic interest in redistribution.”
After the 1970s economic stagnation, the taxed, regulated and subsidised groups had an increasing incentive to converge on new, lower cost modes of income redistribution.
- economic reforms ensued, led by parties on the left and right, with some members of existing political and special interest groupings benefiting from joining new coalitions.
- More efficient taxes, more efficient spending, more efficient regulation and a more efficient state sector reduced the burden on the taxed groups.
- Most of the subsidised groups benefited as well because their needs were met in ways that provoked less political opposition from the taxpaying groups.
Sweden, Norway and Denmark could be examples of Gary Becker’s idea that political systems converge on the more efficient modes of both regulation and income redistribution as their deadweight losses grew in the 1970s and 1980s and after. Unlike some of their brethren abroad, more of the Nordic Left and, more importantly, the Nordic median voter were cognizant of the power of incentives and to not killing the goose that laid the golden egg. Taxes on income from capital are low in Scandinavia.
The rising deadweight losses of taxes, transfers and regulation all limit the political value of inefficient redistributive policies. Tax and regulatory policies that are found to significantly cut the total wealth available for redistribution by governments are avoided relative to the germane counter-factual, which are other even costlier modes of redistribution.
An improvement in the efficiency of either taxes or spending reduces political pressure from taxed and regulated groups for suppressing the growth of government and thereby increases total tax revenue and spending because there is less political opposition. Efficient taxes lead to higher taxes.
Improvements in the efficiency of taxes, regulation and in spending reduce political pressure from the taxed and regulated groups in society. This suppressed the growth of government and thus increased or prevented cuts to both total tax revenue and spending since 1980. Economic regulation lessened after 1980 and there were privatisations, but social and environmental regulation grew unabated. Certainly in New Zealand the post-1984 economic reforms followed a good 10 years of economic stagnation and regular economic crises:
In the early 1980s, New Zealand’s economy was in trouble. The country had lost its guaranteed export market when Britain joined the European Economic Union in 1973. The oil crisis that year had also taken a toll.
The post-1980 reforms of Thatcher, Reagan, Clinton, Hawke and Keating, Lange and Douglas and others saved the modern welfare state for the middle class. Most income transfer programmes in modern welfare states disproportionately benefit older people. With an aging society, that trend can only continue. That is why these reforming policies survived political competition, election after election. The political parties on the left and right that delivered efficient increments and streamlined the size of government were elected, and in turn, got thrown out from time to time because they became tired and flabby.

The rest of embedded neoliberalism is trying to explain widespread economic deregulation and liberalisation of international trade along with the continual growth of social regulation. This is something that Gary Becker, George Stigler and Sam Peltzman have written on previously.
The continued growth of social regulation is best explained by the median voter theorem. Both Bryan Caplan and Sam Peltzman pointed out that it’s hard to think of any major government program or regulation that does not enjoy widespread popular support.
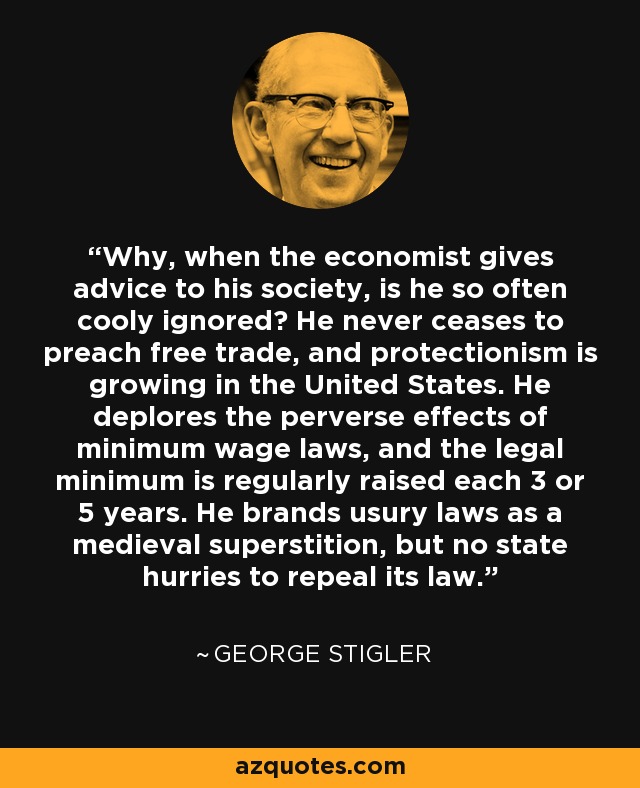
As for the public been duped by neoliberal economists, George Stigler argued that ideas about economic reform need to wait for a market. As Stigler noted, when their day comes, economists seem to be the leaders of public opinion but when the views of economists are not so congenial to the current requirements of special interest groups and voting public, these economists are left to be the writers of letters to the editor in provincial newspapers. These days they would run an angry blog.

Recent Comments