The European League of Home Ownership. Fascinating positions. The U.K. in the relegation zone. pic.twitter.com/PcRC4jHrKZ
— Paul Kirby (@paul1kirby) January 29, 2016
Next to nobody rents in Romania! The European League of Home Ownership
10 Feb 2016 Leave a comment
in urban economics Tags: EU, Generation Rent, homeownership, housing prices, Romania
@NZGreens a bright future for this student in housing policy
10 Feb 2016 Leave a comment
in applied price theory, urban economics
If you love nature, stay away from it – Ed Glaeser
09 Feb 2016 Leave a comment
in energy economics, environmental economics, global warming, politics - New Zealand, transport economics, urban economics
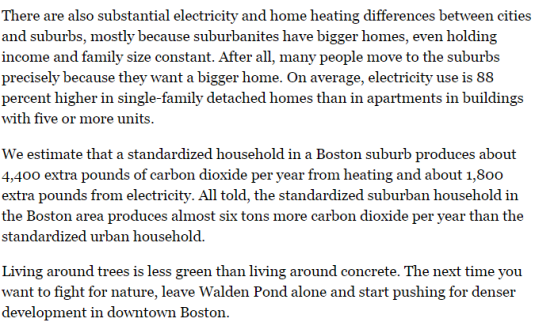
It is hard to imagine any merchant who harmed the environment as much as Henry David Thoreau…
We are a destructive species, and if you love nature, stay away from it. The best means of protecting the environment is to live in the heart of a city.
Ed Glaeser
Source: If you love nature, move to the city – The Boston Globe.
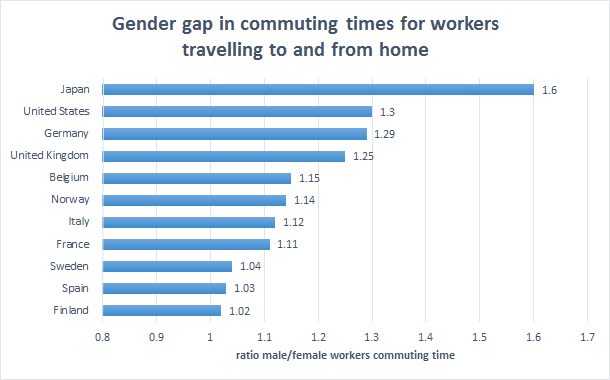
Gender commuting gap for workers who travel to and from home to work
04 Feb 2016 Leave a comment
in discrimination, gender, labour economics, labour supply, occupational choice, transport economics, urban economics Tags: commuting times, reverse gender gap
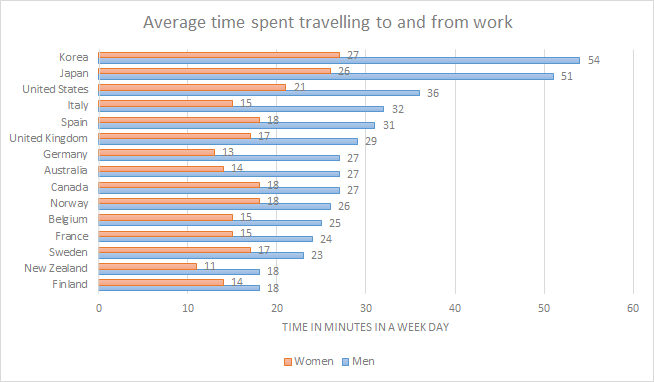
I lived in Japan so that 60% extra time the Japanese men spend travelling to and from work in those cramped trains is not to be underrated.
Source: OECD Family Database – OECD.
@TransportBlog forgets the car ownership data it published
04 Feb 2016 Leave a comment
in economic history, politics - New Zealand, transport economics, urban economics
Transport Blog was making much of some data about how a lot of people used public transport and New Zealand in the 1950s:
Take Auckland as an example. According to Paul Mees [Transport for Suburbia, p. 21], in 1954 Auckland’s public transport network “accounted for 58 per cent of trips by motorized modes, private transport only 42 per cent. When walking and cycling, which were not surveyed, are taken into account, it is likely that fewer than a third of daily trips were by car.”
… public spending to enable car travel did not respond to existing demand – it was intended to shape future demand. (And in doing so, change the shape of the city).
…
“roads first” transport policies seem less like an exercise in meeting demands, and more of a component of a large social engineering programme.
Transport Blog forgot previous data it dugout on trends in car ownership per capita in New Zealand since 1925. There is an explosive growth in car ownership from the 1950s onwards with the post-war economic boom. The roadbuilding that followed responded to this growing wealth of the New Zealand people rather than the other way round.
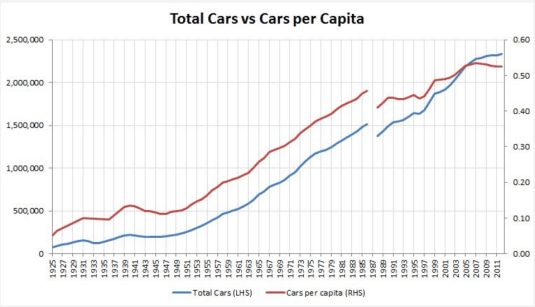
Source: The Infernal Combustion Engine « transportblog.co.nz.
People like owing and driving cars. Transport Blog begrudgingly admits in its post today that cars have some advantages.
Young people save up to buy a car not because they are duped by the enemies of public transport, they save because a car is a good way to get around.
Privately owned cars are more comfortable, faster, more private, more convenient in trip timing, and more flexible for multiple tasks on one trip than any form of public transit. What cannot be avoided as Anthony Downs explains is:
As household incomes rise around the world, more and more people shift from slower, less expensive modes of movement to privately owned cars and trucks.
Downs argues that it is time to settle down and accept what cities are:
…peak-hour traffic congestion is inescapable in large modern metropolitan areas the world over. Business firms want most people on the job during the same hours so that workers can interact efficiently. Many firms also want to locate in low-density establishments scattered across the landscape.
Households want a range of choices of where to live and work, and most want to live in low-density settlements that are separate from poorer households, use private vehicles for most travel and be able to carry out multiple errands on a single trip.
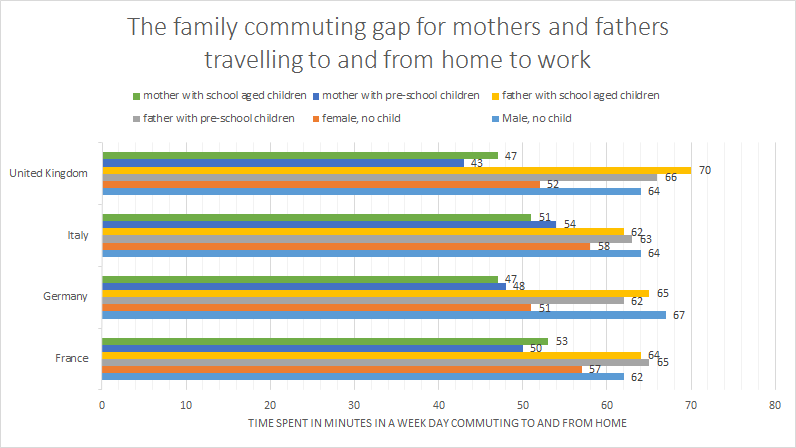
No asymmetric marriage premium in commuting: the family commuting gap for mothers and fathers travelling to and from work by school age of child in the UK, Germany, France and Italy
04 Feb 2016 Leave a comment
in discrimination, economics of love and marriage, gender, human capital, labour economics, labour supply, occupational choice, transport economics, urban economics Tags: asymmetric marriage premium, commuting times, gender wage gap, reversing gender gap
Few labour market statistics have any meaning unless broken down by gender. The compensating differentials that explain much of the family pay gap extend strongly to commuting times.
Source: OECD Family Database – OECD, Table LMF2.6.A.
Mothers commute a good 15 to 20 minutes less than fathers in the UK, Italy, Germany and France. Single women commute 5 to 10 minutes further than mothers. Single men and fathers commute much the same distance.
NZ households spending 30% plus of disposable income on housing, 1988–2013
01 Feb 2016 Leave a comment
in economic history, economics of regulation, urban economics
The reverse gender gap in commuting times across the OECD @JulieAnneGenter
31 Jan 2016 2 Comments
in discrimination, gender, labour economics, labour supply, occupational choice, transport economics, urban economics Tags: commuting times, compensating differentials, gender wage gap, reversing gender gap
Commuting times need to be incorporated into calculations of the gender wage gap because they do represent a serious fixed cost of working that is higher for men than for women.
Source: OECD Family Database.
Not only is the commuting time for female workers less, there is much less variation across the OECD member countries than for men.
The figures for New Zealand are so low that they are suspicious.
Half of Australians live in the red areas
27 Jan 2016 Leave a comment
in population economics, urban economics Tags: Australia, geography
NZ, Oz & US real housing price index, January 1975 – September 2015 @philtwyford @JulieAnneGenter
14 Jan 2016 Leave a comment
in economic history, economics of regulation, politics - Australia, politics - New Zealand, politics - USA, urban economics
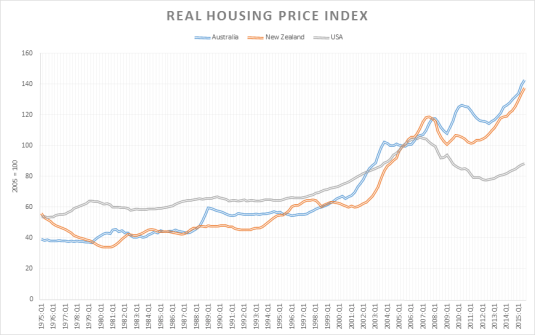
Notice that New Zealand housing prices were pretty flat until the passage of the Resource Management Act in 1993.
Rooms per person across the OECD member countries
07 Jan 2016 Leave a comment
in politics - Australia, politics - New Zealand, politics - USA, population economics, urban economics Tags: housing economics, living standards
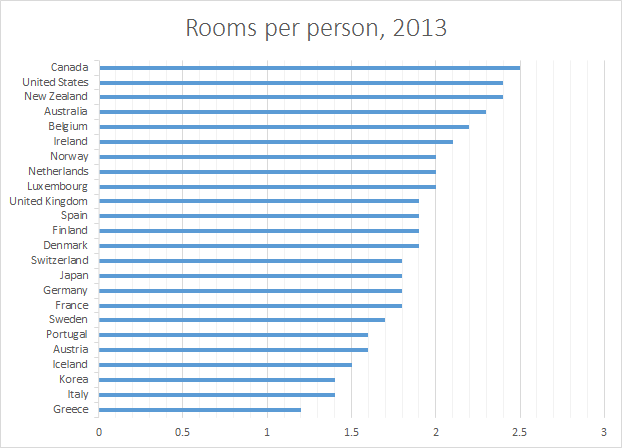
There are quite large differences in the number of rooms per person in the European offshoots and the countries in Europe. Americans have much more room per person than the much exalted welfare states of northern Europe.
Source: OECD Better Life Index – Data extracted on 07 Jan 2016 06:55 UTC (GMT) from OECD.Stat
Jason Furman on residential housing supply, NIMBYism, and economic growth
05 Jan 2016 Leave a comment
in economics of regulation, environmental economics, politics - New Zealand, politics - USA, Public Choice, rentseeking, urban economics Tags: housing affordability, land use planning, RMA, zoning
Central Park in New York City
31 Dec 2015 Leave a comment
in urban economics Tags: New York City
Central Park in New York City.
(3D version here: bit.ly/1EFhgBS) http://t.co/Le2tbgyzI5—
Max Roser (@MaxCRoser) June 28, 2015
@TransportBlog @JulieAnneGenter community outrage at new bike lane death trap in Island Bay
22 Dec 2015 Leave a comment
in health and safety, politics - New Zealand, transport economics, urban economics

Source: Wellington’s Island Bay cycleway has left residents confused and angry | Stuff.co.nz.
We drove past this bicycle death trap in island Bay in Wellington the other weekend. The first thing I noticed is a lot of bicycle will be sideswiped as passengers in cars open their left door not expecting anybody to be there. The bike lane also narrows the road from buses. Residents now have a lot of trouble safely getting out of their houses without both are running over bicyclists and seeing oncoming cars. Further proof that bikes are a killer green technology.

Source: Wellington’s Island Bay cycleway has left residents confused and angry | Stuff.co.nz.
Part of the nonsense behind this death trap is that more people ride their bike if they can do so safely such as on this death trap according to the local mayor:
Wellington Mayor Celia Wade-Brown acknowledged the recent social media backlash – which she dubbed “bike-lash” – but was confident it would simmer down once the cycleway was complete.
She pointed to the council’s research, which showed 76 per cent of Wellingtonians would cycle more if cycling was safer.
“And I think a scientific survey is a clearer indication [of Wellingtonians’ views on the cycleway] than the number of social media likes or dislikes.”
Obviously our local mayor has not heard of the social acceptability bias that arises when answering questions about whether or whether not they are use fashionable forms of transport.

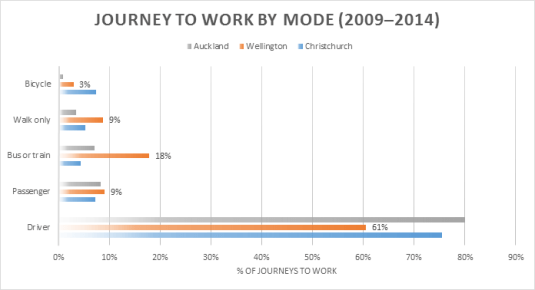
The number of people in Wellington taking a bicycle to work in Wellington is trivial. Three times as many walk to work as take a bike to work in Wellington.
Source: New Zealand Transport Agency.
The Twitter Left mantra as championed by the Greens and Transport Blog is that it would all be so much different we invested a little bit more in public transport is a myth.
The experience in Europe and North America is that if you make buses free, the cheapies that currently bike take the bus or train. In addition, the street people find it comfortable warm place to hang out when during the day which drives the regular customers away.
A 2002 report released by the National Center for Transportation Research indicated that the lack of fares attracted hordes of young people, who brought with them a culture of vandalism, graffiti, and bad behavior—which all necessitated costly maintenance. The lure of “free,” the report implied, attracted the “wrong” crowd—the “right” crowd, of course, being wealthier people with cars, who aren’t very sensitive to price changes.
In Wellington CBD, average value of commercial building is almost halved with a red or yellow sticker
17 Dec 2015 Leave a comment
in economics of natural disasters, economics of regulation, politics - New Zealand, urban economics Tags: earthquakes, efficient markets hypothesis, entrepreneurial alertness
Within the Wellington CBD, the average value of a commercial building is almost halved if it receives a legally binding earthquake-prone declaration. Discounts on specific buildings will vary around this average level, reflecting a number of factors such as costs of remediation and the nature of existing rental agreements.


Recent Comments