The Labour Party and the Greens both plan to build 100,000 affordable houses as a way of offsetting soaring housing prices in Auckland and other New Zealand cities. These plans were announced in the 2014 Election in New Zealand.
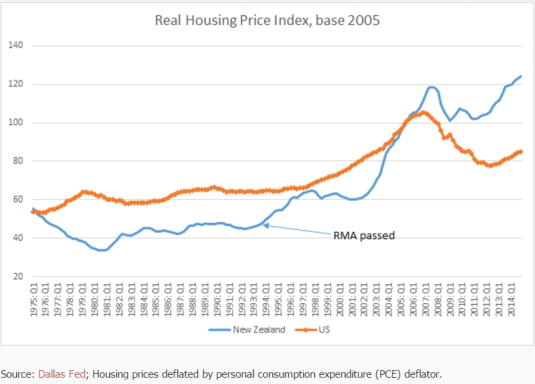
A trite but insurmountable objection to the proposal to build 100,000 affordable houses is there are no plans to increase the supply of land. That would require RMA reform which both Labour and the Greens oppose. They oppose RMA reform partly for ideological reasons and partly to cultivate middle-class home owner votes.
Unless there is an increase in the supply of land in Auckland and the other New Zealand cities, the government under the plans of the Labour Party and the Greens are building houses the private sector would have built anyway but for the government bought from the same new supply of land released every year by local councils.
The proposals of Labour and the Green to build affordable houses simply changes the identity of who builds the same number of new houses in New Zealand. There is no net increase in this supply of houses so there will not be any improvement in housing affordability.
If the supply of land were to be increased through RMA reforms, there be no need to for the government to build the houses. This is because the market will take care of building the houses on the additional land released by local councils if there is a demand for them and they’re obviously is.
Attempts by a Labour and Green Government to build affordable houses is no more than displace the efforts of private developers to supply houses but in configurations more closely aligned with market demand in terms of the quality and size of the house.
Another insurmountable but still minor objection to supplying 100,000 affordable houses is Friedman’s second law of economics: you can’t give anything away for free because people will queue up for access.
If the government is selling cheap houses to ordinary families, people change that circumstances to make themselves more eligible for the house, which presumably will be targeted by income. Easiest way to do that is to fund a low income family member such as a student to buy the house and sell it to you. Alternatively, you could make an advanced of them against their inheritances as a way of them buying a house.
The classic New Zealand example of the inability to give anything away for free was the introduction of school zoning. People now pay hundreds of thousands of dollars more for a house if it is in a favourable school zone.
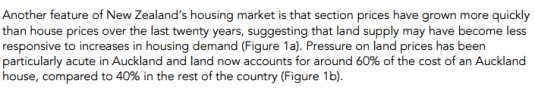
A more serious objection that can never be overcome is as soon as the lucky ordinary family buys the affordable house, they will renovate it to the proper standing reflecting the underlying value of the land. Affordable houses under the plans of the New Zealand Labour Party and the Greens is to build a cheap house on expensive land in Auckland. Land in Auckland is 60% of the price of a house. Land use to be 40% of the value of the house in Auckland.
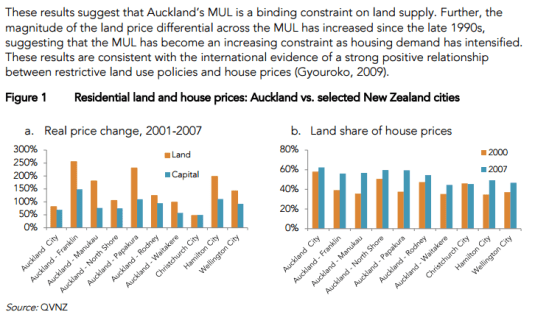
Source: New Zealand Productivity Commission (2013).
Plenty of people are in the game of home renovation; some do it as a full-time occupation. They buy an old rundown house on good land and a good location and renovate the house to match the value of the underlying land and location.
The possibility of subsequent renovation to the cheap house on the good land is the death knell of any attempt to sell affordable housing in Auckland or the other New Zealand cities where house prices are spiralling upwards because of restrictions on the supply of land.
Building 100,000 affordable houses were simply present 100,000 renovation opportunities to entrepreneurs. The families who are lucky enough to be first to buy the affordable house will get a marvellous windfall. There will be no long-term impact on the price of land in Auckland because you can’t give anything away for free. Any undervalued good as quickly resold at a profit by budding entrepreneurs after renovating the house to bring it up to market standard given the value of the underlying land.
If the Labour Party and the Greens want more affordable housing, they must support RMA reforms that will increase the supply of land. They won’t do out of sheer political expediency. Labour and the Greens want to win the votes of disgruntled National party voters who already own homes.


Recent Comments