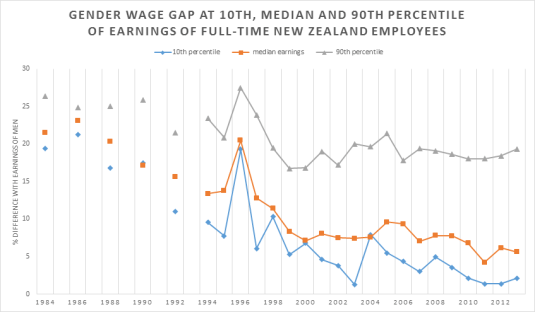
In common with New Zealand, the most persistent gender pay gap is at the top end of the labour market. There is more gender equality among the lowest paid female workers than the highest-paid female workers. The gender pay gap for the top 10% of female workers has been static for 20 years. Gender pay gaps for female workers at the median weekly earnings for a full-time worker and at the bottom have been still closing albeit slowly over that same 20 years.
It is not usual to measure the gender wage gap against average earnings. Median earnings preferably on an hourly basis is the normal measure. Moreover, more long-term data is readily available on the Internet about median earnings rather than average earnings.
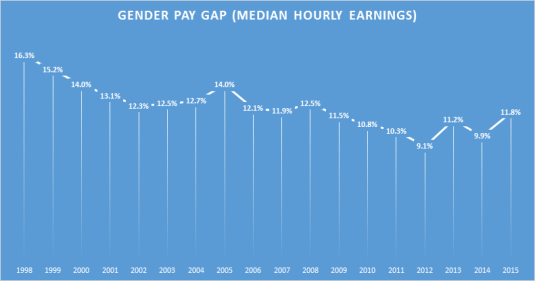
For example, as the chart below shows the unadjusted gender wage gap in New Zealand is a little bit less than the 14% claimed by Auckland YMCA when measured against median earnings and has been slowly tapering down for 15 years.
Source: Statistics New Zealand New Zealand Income Survey.
My larger claim is the gender pay gap has been in a long-term decline for generations. More importantly, the gender will pay gap is disappeared at the bottom of the labour market. For the past 5 to 10 years, the unadjusted gender wage gap rounds down to zero at the bottom of the pay structure for full-time employees.
The gender wage gap remains stubbornly high at the high end of the wage market at 15-20% because of compensating differentials. Women are balancing families and careers in choosing the occupations that best suits each individual woman.
Studies of top earning professionals show that they make quite deliberate choices between family and career. The better explanation of why so many women are in a particular occupation is job sorting: that particular job has flexible hours and the skills do not depreciate as fast for workers who take time off, working part-time or returning from time out of the workforce. Low job turnover workers will be employed by firms that invest more in training and job specific human capital.
Higher job turnover workers, such as women with children, will tend to move into jobs that have less investment in specialised human capital, and where their human capital depreciates at a slower pace.
Women, including low paid women, select careers in jobs that match best in terms of work life balance and allows them to enter and leave the workforce with minimum penalty and loss of skills through depreciation and obsolescence.
This is the choice hypothesis of the gender wage gap. Women choose to educate for occupations where human capital depreciates at a slower pace. This gender wage gap for professionals can be explained by the marriage market combined with assortative mating:
Graduates are likely to marry each other and form power couples; and
There tends to be an age gap between men and women in long-term relationships and marriages of two years.
This two-year age gap means that the husband has two additional years of work experience and career advancement. This is likely to translate into higher pay and more immediate promotional prospects. Maximising household income would imply that the member of the household with a higher income, and greater immediate promotional prospects stay in the workforce. This is entirely consistent with the choice hypothesis and equalising differentials as the explanation for the gender wage gap. As Solomon Polachek explains:
At least in the past, getting married and having children meant one thing for men and another thing for women. Because women typically bear the brunt of child-rearing, married men with children work more over their lives than married women. This division of labour is exacerbated by the extent to which married women are, on average, younger and less educated than their husbands.
This pattern of earnings behaviour and human capital and career investment will persist until women start pairing off with men who are the same age or younger than them.
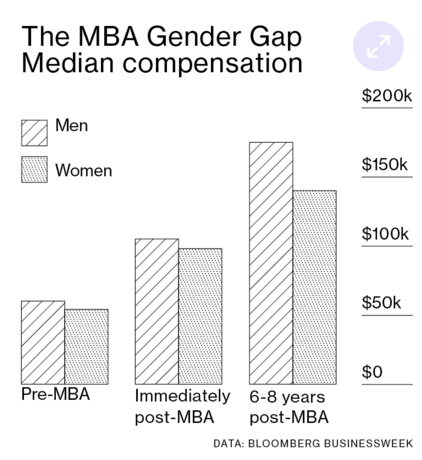
Claudia Goldin did a great study of Harvard MBAs using online surveys of their careers. She found that three proximate factors accounted for the large and rising gender gap in earnings:
differences in training prior to MBA graduation,
differences in career interruptions, and
differences in weekly hours.
The greater career discontinuity and shorter work hours for female MBAs are largely associated with motherhood. There are some jobs that are severely penalise any time out of the workforce. A 2014 Harvard Business School study found that 28 percent of recent female alumni took off more than six months to care for children; only 2 percent of men did.
Claudia Goldin has described pharmacy is the most family friendly occupation. She compares it to law. In law, if you work long hours, you are on partnership track and win the top clients. In pharmacy, the only advantage of working longer hours as you earn more money that week. Also, pharmacists are completely interchangeable. Do you care which pharmacist fills out your prescription at your local pharmacy or even know which one fills it out? Lawyers are not interchangeable: they cannot just handover a case. Detailed briefings would be required. You expect your lawyer to show up in court or at meetings on time anywhere without fail.
Claudia Goldin found one counterfactual that cancels out the gender wage gap amongst MBA professionals: hubby earns less! Female MBAs who’ve have a partner who earn less than them earn as much as the average MBA professional on an hourly basis but work a few less hours per week.
The gender wage gap is persisted in high-paying jobs because career women have so many options. They can mix and match career and motherhood in fine detail.
In low-paying jobs, there is little in the way of trade-offs other than full-time or part-time work. Low-paid jobs do not involve choosing majors at university, choosing careers, industries and employers that call for long hours and uninterrupted careers or not so long hours, fewer human capital and promotional penalties for time off and more work-life balance.
The choice hypothesis is the far better explanation for the persistence of the unadjusted gender wage gap in New Zealand, which is small by international standards. As Polachek explains:
The gender wage gap for never marrieds is a mere 2.8%, compared with over 20% for marrieds. The gender wage gap for young workers is less than 5%, but about 25% for 55–64-year-old men and women.
If gender discrimination were the issue, one would need to explain why businesses pay single men and single women comparable salaries. The same applies to young men and young women. One would need to explain why businesses discriminate against older women, but not against younger women. If corporations discriminate by gender, why are these employers paying any groups of men and women roughly equal pay?
Why is there no discrimination against young single women, but large amounts of discrimination against older married women? … Each type of possible discrimination is inconsistent with negligible wage differences among single and younger employees compared with the large gap among married men and women (especially those with children, and even more so for those who space children widely apart)
The main drivers of the gender wage gap are unknown to employers such as whether the would-be recruit or employer is married, their partner is present, how many children they have, how many of these children are under 12, and how many years are there between the births of their children.
In countries such as Sweden, the gender wage gap is no better than the OECD average, despite generous maternity and paternity leave. The reason is obvious. You do not close the gender wage gap for professional women by paying them to stay out of the workforce for a year or more perhaps several times over at critical junctures early in their careers.
Long parental leave in Sweden is responsible for a thick Swedish glass ceiling because of lower levels of human capital investment among women and employers’ responses by placing fewer women in fast-track career. Extensive parental leave makes holding a job easier and more family-friendly, it may not be as effective as some might think in eradicating the gender gap for professional women.
There are large differences in the education premium between English speaking countries and also by gender. The tertiary premium in New Zealand is pretty poor compared to the USA, UK or Ireland and is still mediocre when compared to Australia and Canada.
If a Martian landed on earth and was asked at Immigration Control to pick when Reagan and Thatcher were in office based on tax policies, our Martian applicant for a visitors’ visa would get it right for the UK. Taxes as a percentage of GDP increased from 31% to 37% under the 1970s Wilson and Callaghan administrations which led to the sick man of Europe. Under Thatchernomics, tax revenue as a percentage of British GDP fell from 37% to 31% by the time Mrs Thatcher had left office.
Taxes as percentage of GDP actually increased in the Reagan years so Martians will not be able to identify Reaganomics based on taxes as a percentage of GDP. The Democratic Party controlled at least the House of Representatives for the entire time of the Reagan administration so any tax agenda would have been tempered. There were large cuts in marginal tax rates funded by tax base expansion. That’s the traditional meaning of tax reform. There is no actual reduction in taxes as percentage of GDP. Marginal tax rates are funded by increases in tax base or increases in indirect taxes.
As for Tony Blair as a continuation of Thatchernomics, tax revenues as a percentage of GDP stopped increasing under his watch after increasing again under John Major.
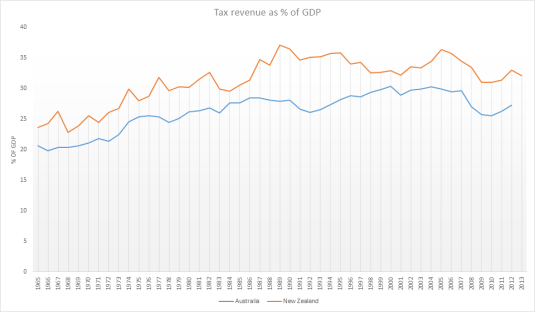
Revenue is a percentage of GDP has always been higher in New Zealand as compared to Australia for as far back as data is available. Tax revenue grew by a third as a percentage of GDP between 1965 and 1989 in New Zealand with a sharp spike from 1984 onwards. The growth in tax revenues as percentage of Australian GDP was smoother rather than spikes such as in the mid-1980s in New Zealand.
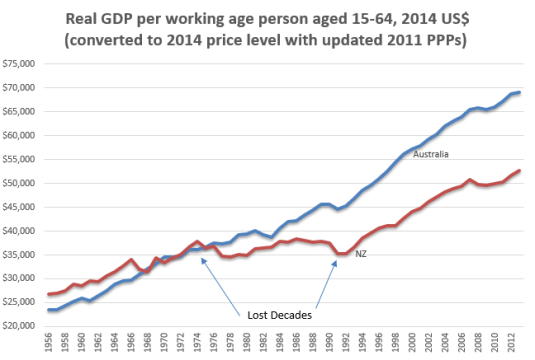
Interestingly, this faster growth in the New Zealand tax revenues as a percentage of GDP coincided with the two lost decades of New Zealand growth between 1974 and 1992. Furthermore, the chart below shows that an emerging recovery in labour productivity in the early 1980s stalled when tax revenues started growing again as a percentage of New Zealand GDP.
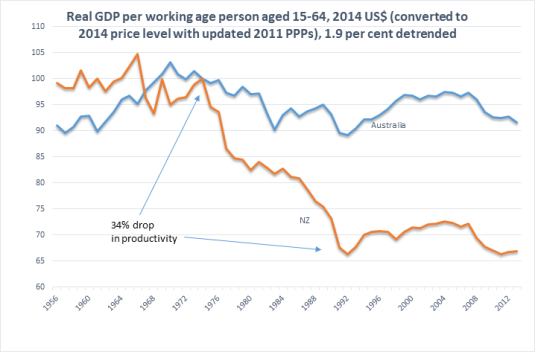
Between 1974 and 1992, New Zealand lost 34% and productivity against trend of 1.9%. In the chart below, a flat line is growth at a rate equal to the trend rate of growth for the USA in the 20th century which is 1.9%. A falling line indicates growth at less than 1.9% for the year. A rising line means growth in excess of 1.9% for the year. The chart below confirms what the chart above says. Productivity stopped falling in the early 1980s then started falling rapidly at the same time that tax revenues spiked as percentage of GDP in the early 1980s.
in the above chart, Australia had pretty steady growth since about 1970. There is a productivity slowdown in the 1970s and above-average growth as the economy recovered from the Keating recession in the early 1990s. The so-called mining boom is hardly noticeable in Australia’s trend growth rate.
Why Evolution is True is a blog written by Jerry Coyne, centered on evolution and biology but also dealing with diverse topics like politics, culture, and cats.
In Hume’s spirit, I will attempt to serve as an ambassador from my world of economics, and help in “finding topics of conversation fit for the entertainment of rational creatures.”
“We do not believe any group of men adequate enough or wise enough to operate without scrutiny or without criticism. We know that the only way to avoid error is to detect it, that the only way to detect it is to be free to inquire. We know that in secrecy error undetected will flourish and subvert”. - J Robert Oppenheimer.


Recent Comments