Decongesting Auckland – For real – by Andrew Atkin
26 Nov 2014 Leave a comment
in politics - New Zealand, urban economics Tags: Andrew Atkin, Auckland urban limit, congestion charges, RMA, zoning
More Efficient Tax Systems Lead to Bigger Government
26 Nov 2014 Leave a comment
in comparative institutional analysis, constitutional political economy, politics - USA, Public Choice Tags: Casey Mulligan, Gary Becker, growth in government, public choice

Reason for UKIP’s success?
23 Nov 2014 Leave a comment
What does it mean to be worse off now than in 1979?
22 Nov 2014 Leave a comment
in applied welfare economics, politics - USA Tags: poverty and inequality, The Great Enrichment
Does the chart say that the basket of goods you could buy in 1979, in quantity and quality, was better than now? Every technological upgrade and new product has passed everyone by but the rich?
It’s not just Ed Miliband. Labour’s on the wrong side of history » The Spectator
21 Nov 2014 Leave a comment
in applied price theory, applied welfare economics, comparative institutional analysis, constitutional political economy, election campaigns, liberalism, macroeconomics, Marxist economics, political change, politics - Australia, politics - New Zealand, politics - USA, public economics, technological progress Tags: free trade, globalisation, market augmenting governments

Politicians can’t be heroes any more. Instead, they have to operate within the tightly drawn tramlines of the global economy.
This is true for those on the left and the right, but the pressure that this places on countries to adopt a low-tax, light-regulation regime is something with which the right is far more comfortable.
via It’s not just Ed Miliband. Labour’s on the wrong side of history » The Spectator.
Intergenerational mobility in 1 chart
20 Nov 2014 Leave a comment
in applied welfare economics, human capital, labour economics, occupational choice, politics - USA, Rawls and Nozick Tags: intergenerational mobility
Steven Landsburg on the difference between an absurdity and a lie about Obamacare
20 Nov 2014 Leave a comment
in applied price theory, applied welfare economics, health economics, politics - USA

The New York Times announces the Death of Snow
20 Nov 2014 Leave a comment
in climate change, environmental economics, environmentalism, politics - USA Tags: climate alarmism, global warming
Jon Stewart demolishes Gruber and the Democrats on Obamacare
20 Nov 2014 Leave a comment
in applied price theory, applied welfare economics, economics, economics of regulation, health economics, politics - USA Tags: health insurance, Jon Stewart, Obamacare
US corporate earnings vs. European corporate earnings
19 Nov 2014 Leave a comment
in Euro crisis, great recession, macroeconomics, politics - USA Tags: Euroland, GFC, great recession
The great stagnation continues
19 Nov 2014 Leave a comment
in global financial crisis (GFC), great recession, politics - USA Tags: GFC, Great Deviation, The Great Recession
Real GDP per New Zealander and Australian aged 15-64, PPP, 1956-2013, $US
18 Nov 2014 1 Comment
in business cycles, economic growth, geography, global financial crisis (GFC), great recession, macroeconomics, politics - Australia, politics - New Zealand Tags: lost decades, prosperity and depression
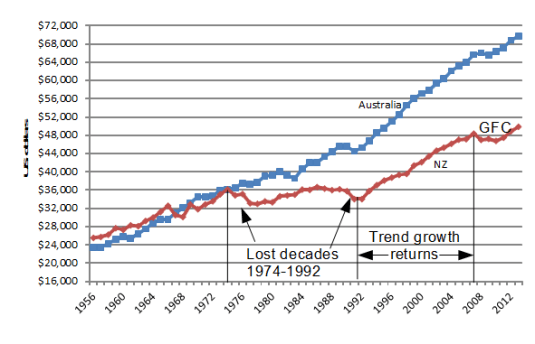
Figure 1: Real GDP per New Zealander and Australian aged 15-64, converted to 2013 price level with updated 2005 EKS purchasing power parities, 1956-2013, $US
Source: Computed from OECD Stat Extract and The Conference Board, Total Database, January 2014, http://www.conference-board.org/economics
Figure 1 shows that New Zealand lost two decades of growth between 1974 and 1992 after level pegging with Australia for the preceding two decades.
New Zealand returned to trend growth between 1992 and 2007. New Zealand did not make up the lost growth of the previous two decades to catch up to Australia.
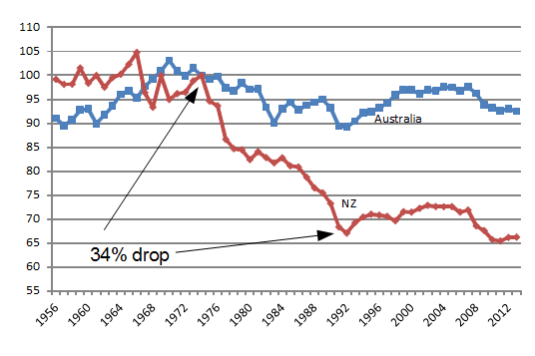
Figure 2: Real GDP per New Zealander and Australian aged 15-64, converted to 2013 price level with updated 2005 EKS purchasing power parities, 1.9 per cent detrended, base 100 = 1974, 1956-2013, $US
Source: Computed from OECD Stat Extract and The Conference Board, Total Database, January 2014, http://www.conference-board.org/economics
In Figure 2, a flat line equates to a 1.9% GDP annual growth rate; a falling line is a below trend growth rate; a rising line is an above 1.9% growth rate.
Figure 2 shows that there was a 34% drop against trend between 1974 and 1992; a return to trend growth and slightly better between 1992 and 2007; and then a recession to 2010.
Australia had its ups and downs since 1956 but essentially grew at the trend growth rate of 1.85% since 1970. The so-called resources boom in Australia does not show up in Figures 1 or 2.
There was no growth rebound in New Zealand to recover the lost ground, either in the lost decades between 1974 and 1992, or after the Global Financial Crisis. The strong GDP growth in Australia after that Keating recession in 1991 is an example of the country recovering lost ground after a recession – See Figure 2.
A trend growth rate of 1.9% is the 20th century trend growth rate that Edward Prescott currently estimates for the global industrial leader, which is the United States of America.


Recent Comments