Landcorp is a state-owned enterprise of the New Zealand government. Its core business is pastoral farming including dairy, sheep, beef and deer. In January 2012, Landcorp managed 137 properties carrying 1.5 million stock units on 376,156 hectares of land. Its total return to shareholders, the taxpayers, has been quite up-and-down in recent years.
Source: The New Zealand Treasury – data released under the Official Information Act.
Source: The New Zealand Treasury – data released under the Official Information Act.
Source: The New Zealand Treasury – data released under the Official Information Act.
In addition to the $10+ billion write-off and collapsed to negative equity, KiwiRail has not paid any dividends for quite some time now to the taxpayer.
Source: The New Zealand Treasury – data released under the Official Information Act.
Source: The New Zealand Treasury – data released under the Official Information Act.
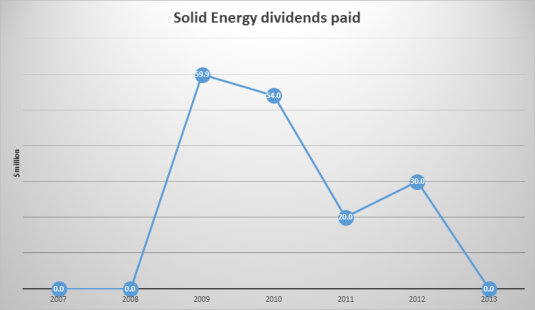
Leaving aside the fortunes and vicissitudes of the mining industry, Solid Energy’s numbers have been up and down by so much that if this was in a private company, you would start to wonder.
Source: The New Zealand Treasury – data released under the Official Information Act.
Taxpayers barely saw a cent of those multibillion-dollar valuations of just a few years ago for a company now under receivership. I doubt the ride was worth the price of passage for the taxpayer.
Source: The New Zealand Treasury – data released under the Official Information Act.
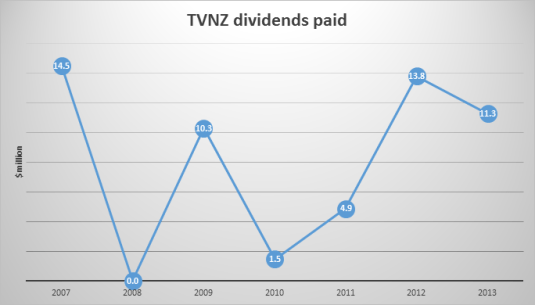
Source: The New Zealand Treasury – data released under the Official Information Act.
The volatile returns to taxpayers from Television New Zealand shows that continuing to own a state-owned enterprise operating a legacy media adds considerable risk to the taxpayers’ portfolio.
Source: The New Zealand Treasury – data released under the Official Information Act.
Source: The New Zealand Treasury – data released under the Official Information Act.
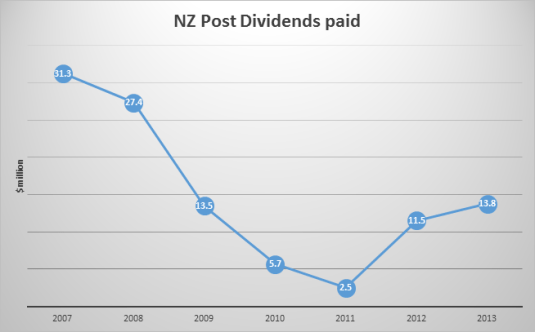
Source: The New Zealand Treasury – data released under the Official Information Act.
New Zealand Post is slowly going out the door with declining dividends to taxpayers, a sustained decline in its commercial valuation and a negative or poor Total Shareholder Return. Letter volumes declined by a one-half in 10 years but the parcels business is growing because of the rise of e-commerce and Internet shopping.
Source: The New Zealand Treasury – data released under the Official Information Act.
Source: The New Zealand Treasury – data released under the Official Information Act.
Source: The New Zealand Treasury – data released under the Official Information Act.
There was rapid growth in the human capital of graduates and postgraduates in New Zealand between 1981 and 2001 according to the census data. The growth in female human capital was particularly rapid and especially so at the postgraduate level.
Source: Lˆe Thi. Vˆan Tr`ınh, Estimating the monetary value of the stock of human capital for New Zealand,thesis submitted in partial fulfilment of the requirements for the Degree of Doctor of Philosophy at the University of Canterbury (September 2006).
Source: Lˆe Thi. Vˆan Tr`ınh, Estimating the monetary value of the stock of human capital for New Zealand,thesis submitted in partial fulfilment of the requirements for the Degree of Doctor of Philosophy at the University of Canterbury (September 2006).
In common with many previous climate summits, the Paris talks will be a futile gesture that will have no significant effect on the pace of global warming and holding the summit is a waste of taxpayers money.
The easy way to tell if there is anything going to happen at a climate summit is the seniority of the delegation.
The Chinese made it clear at the Copenhagen summit in 2009 that they were not interested in an agreement by sending a Vice Minister of Foreign Affairs to a key side meeting of the American and French presidents, the British Prime Minister and the German Chancellor. All subsequent policy manoeuvrings by the Chinese on global warming are an attempt to head off green tariffs on their exports.
The New Zealand Labour Party and New Zealand Greens both make much of the fact that when you privatise a state-owned enterprise the taxpayer is no longer entitled to dividends from the privatised business. The fact that the sale price is the net present value of those future dividends is a rating fallacy that is not the subject of this post.
Source: New Zealand Treasury – data released under the Official Information Act.
What is the subject of this post is whether there are indeed any dividends paid to taxpayers after capital injections. 2007 was the last year in which dividends to the taxpayer exceeded capital injections. The reason was that dog called KiwiRail.
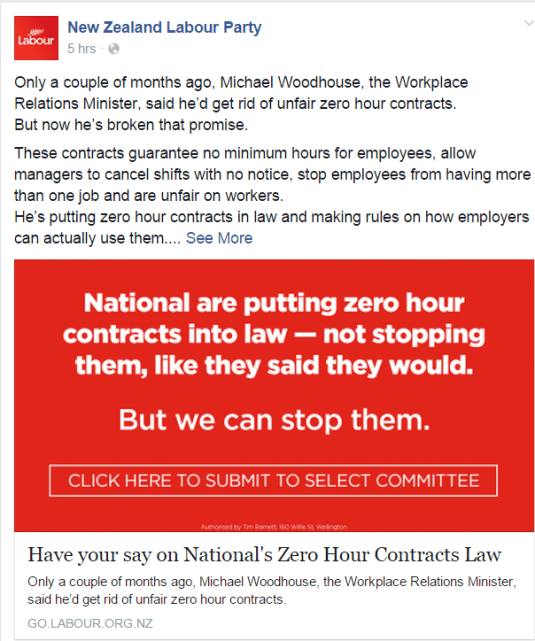
This Labour Party link made it very easy for me to submit to the Select Committee of Parliament to oppose the Bill on regulating zero hours contracts. I oppose the Bill for the exact opposite reasons that the Labour Party opposes the Bill.
I encourage others to make a submission to Parliament as well opposing this draft amendment that will lower the wages of workers. My submission is as follows:
I do not support the proposed changes to the legislation governing zero hour contracts in the Employment Standards Legislation Bill. There should be no regulation of zero hours contracts.
Zero hours contracts is creative destruction at work in the labour market, sweeping away obsolete working time arrangements, mostly in the retail services sector. Plenty of new ways of working have emerged in recent years that include the proliferation of part-time work, temporary workers, leased workers, working from home, teleworking and sub-contracting. Employment laws were built on the now decaying assumption that workers had career-long, stable relationships with single employers.
Advance notice of work schedules is always known only to a minority of temporary and permanent employees in New Zealand, and there’s not much difference between that advance notice between temporary and permanent employees.
Critics overplay their hand if they suggest that somehow workers are very much disadvantaged and employers are holding all the cards. Job turnover and recruitment problems are a serious cost to a business. Workers will not sign zero hours contracts if they are not to their advantage.
Unless labour markets are highly uncompetitive with employers having massive power over employees, employers should have to pay a wage premium if zero-hour contracts are a hassle for workers.
The fixed costs of employment are such that you shouldn’t expect zero-hour contracts: you’ll typically do better with one 40-hour worker over two 20-hour workers because of these costs. Zero hour contracts would be most likely in jobs with low recruitment costs and where specialised training needs are low. Workers with low fixed costs of working will move into the zero-hour sector while those with higher fixed costs would prefer lower hourly rates but more guaranteed hours. Again, read lower here as meaning relative to what they could elsewhere earn.
Unless we have a good idea about why firms are moving to zero hours contracts, which we don’t, and why employees sign these contracts rather than work for other employers who offer more regular hours, meddling in these novel working time arrangements is risky.
Employers must pay a wage premium to induce in workers to sign zero hours contracts. This Bill seeks to deny workers the right to seek higher wages.
Feel free to use the above text as the basis for your own submission to Parliament.
I asked for information from the Treasury for as far back as 2000 but could only get information back to 2008 on the return on equity of the portfolio of state-owned enterprises to the taxpayer.
Source: New Zealand Treasury – released under Official Information Act.
Apparently, long-term information on the performance of the state-owned enterprise portfolio is not available. Anyone wanting to know the performance of an individual or group of listed companies simply looks at the share price was far back as they want. The prices of individual shares reflect market expectations of future dividends and future price movements, and they go up and down as new information is revealed. The history of a share price indicates the ups and downs of a company in one number far better than any other available indicator.
I also included the adjusted rate of return on equity taking out the two dogs in the portfolio: Solid Energy and KiwiRail.
Source: New Zealand Treasury – released under Official Information Act.
Currently New Zealand small refugee quota of 750 is under review. Chances of that been increased to 1000 are reasonable. If people are trying to open the floodgates to millions of people as potential refugees of climate change, if Greenpeace’s own alarmist rhetoric about global warming is to be believed, Greenpeace only strengthens the hand of the anti-immigration and xenophobic parties such as New Zealand First and within the National Party caucus.
Not everyone is a worthy cause, particularly those who make vexatious legal claims that were always going to fail in court. The High Court, the Court of Appeal and the Supreme Court all ruled that it is not their place to expand the scope of the international refugee convention to cover those displaced by climate change. As the Court of Appeal ruled
No-one should read this judgment as downplaying the importance of climate change. It is a major and growing concern for the international community. The point this judgment makes is that climate change and its effect on countries like Kiribati is not appropriately addressed under the Refugee Convention.
Kirabati can do a lot more to help itself rather than looking to others to solve its problems. It is ranked 133rd in the World Bank’s Doing Business database. This means it can do a lot to help its own development, which strengthens its resilience against climate change and rising sea levels. In the High Court, Priestley J observed:
The economic environment of Kiribati might certainly not be as attractive to the applicant and his fellow nationals as the economic environment and prospects of Australia and New Zealand. But he would not, if he returns, be subjected to individual persecution…
The appellant raised an argument that the international community itself was tantamount to the “persecutor” for the purposes of the Refugee Convention. This completely reverses the traditional refugee paradigm. Traditionally a refugee is fleeing his own government or a non-state actor from whom the government is unwilling or unable to protect him. Thus the claimant is seeking refuge within the very countries that are allegedly “persecuting” him.
Kiribati’s Human Development Index value for 2012 is 0.629—in the medium human development category—positioning the country at 121 out of 187 countries and territories. The rank is shared with Indonesia and South Africa. Kiribati is not unusually poor if it is similar in human development index ranking is to Indonesia and South Africa. Since 1980, Kiribati life expectancy at birth has increased from 55 years to 68 years. Average years of schooling is nearly 8 years and expected years of schooling for their children is now 12 years.
Bugger all Aucklanders take the bus (6.5%) or train (1.8%) to work. More Wellingtonians take the train (6.4%) or the public bus (7.9%) than in Auckland but more walk or jog than take either of those two publicly funded and subsidised conveyances. Hardly anybody takes a bike to work these days.
In responding to demands for police to crack down on windscreen washers, some of whom intimidate motorists to pay, the deputy mayor of Christchurch showed a cultured ignorance of youth courts. She has never read newspaper reports that show that youth court defendants are never named and their convictions are not held against them as adults. Furthermore, she is unaware of the spent convictions law in New Zealand that expunges most convictions after seven years, especially petty convictions.
Why Evolution is True is a blog written by Jerry Coyne, centered on evolution and biology but also dealing with diverse topics like politics, culture, and cats.
In Hume’s spirit, I will attempt to serve as an ambassador from my world of economics, and help in “finding topics of conversation fit for the entertainment of rational creatures.”
“We do not believe any group of men adequate enough or wise enough to operate without scrutiny or without criticism. We know that the only way to avoid error is to detect it, that the only way to detect it is to be free to inquire. We know that in secrecy error undetected will flourish and subvert”. - J Robert Oppenheimer.


Recent Comments