Spain's economic growth is being touted as a success story. Don't tell the Spaniards: on.wsj.com/1M45yzI http://t.co/pm4DAd1qkF—
Nick Timiraos (@NickTimiraos) June 03, 2015
The Spanish economic recovery compared
10 Jun 2015 Leave a comment
in business cycles, currency unions, economic growth, Euro crisis, global financial crisis (GFC), great recession, macroeconomics Tags: Eurosclerosis, France, Germany, Italy, Spain
French, German, Italian and British trade union densities, 1960 – 2013
04 Jun 2015 Leave a comment
in economic history, labour economics, unions Tags: British economy, France, Germany, Italy, trade union density, union power
Figure 1: French, German, Italian and British trade union densities, 1960 – 2013
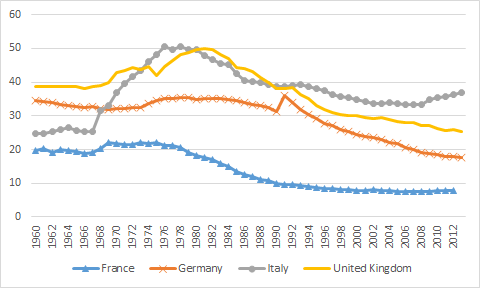
Source: OECD Stat Extract
French, German and Italian unemployment rates, 1956 – 2013
03 Jun 2015 Leave a comment
in economic growth, economic history, job search and matching, labour economics, labour supply, macroeconomics, unemployment Tags: Eurosclerosis, France, Germany, Italy
Figure 1: French, German and Italian unemployment rates, 1956 – 2013

Source: OECD StatExtract.
Real GDP Portugal, Italy, Greece and Spain (PIGS) – 1955 to 2013
06 May 2015 Leave a comment
in currency unions, economic growth, Euro crisis, macroeconomics Tags: Eurosclerosis, Greece, Italy, PIGS, Portugal, Spain
Figure 1: Real GDP per Portuguese, Italian, Greek and Spaniard aged 15-64, converted to 2013 price level with updated 2005 EKS purchasing power parities, 1955-2013
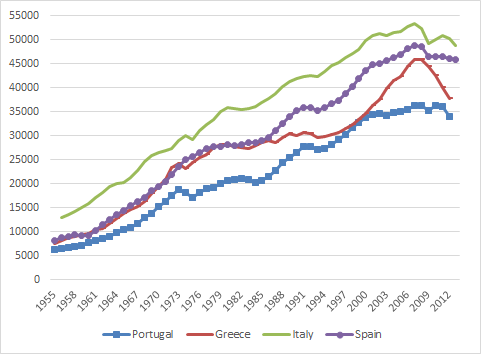
Source: Computed from OECD Stat Extract and The Conference Board, Total Database, January 2014, http://www.conference-board.org/economics
Figure 2: Real GDP per Portuguese, Italian, Greek an Spaniard aged 15-64, converted to 2013 price level with updated 2005 EKS purchasing power parities, 1.9 per cent detrended, 1955-2013
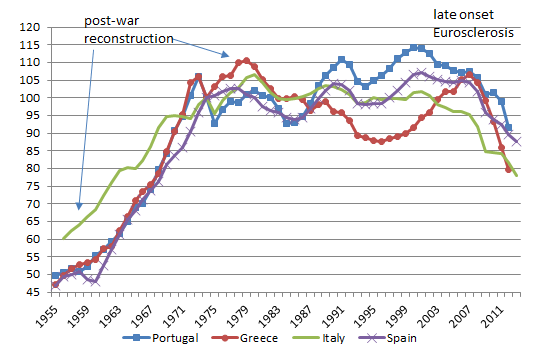
Source: Computed from OECD Stat Extract and The Conference Board, Total Database, January 2014, http://www.conference-board.org/economics
Note that a flat line in figure 2 is growth in real GDP for that year at 1.9%; a rising line is above trend rate of growth; and a falling line is below trend rate growth for that year.
The PIGS had three distinct phases in their post-war growth. Rapid growth up until about the mid 70s. Growth at about the trend rate of growth of 1.9% until about 2000 in the case of Italy. This was followed by slow decline then rapid decline after the global financial crisis.
Figure 3: Real GDP per Italian aged 15-64, converted to 2013 price level with updated 2005 EKS purchasing power parities, 1.9 per cent detrended, 1955-2013
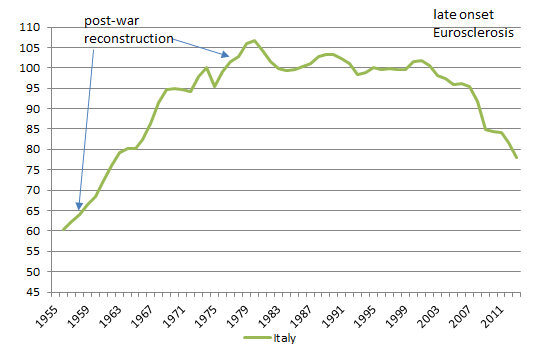
Source: Computed from OECD Stat Extract and The Conference Board, Total Database, January 2014, http://www.conference-board.org/economics
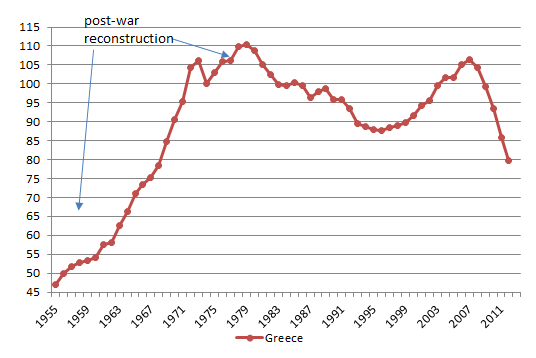
Greece had a different story with the long decline between 1979 to 1995. This was followed by 10 good years of growth followed by sharp decline with the onset of the global financial crisis.
Figure 4: Real GDP per Greek aged 15-64, converted to 2013 price level with updated 2005 EKS purchasing power parities, 1.9 per cent detrended, 1955-2013
Source: Computed from OECD Stat Extract and The Conference Board, Total Database, January 2014, http://www.conference-board.org/economics
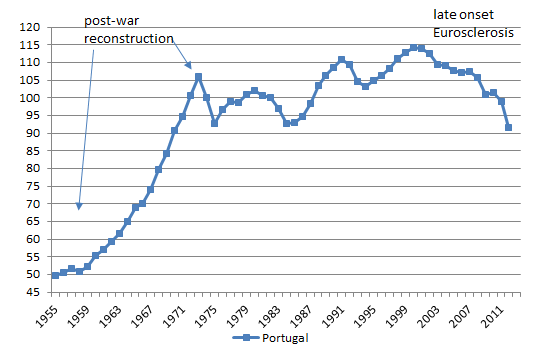
Portugal was in a boom In the 1980s and 1990s followed by what borders on a depression since about 2000.
Figure 5: Real GDP per Portuguese aged 15-64, converted to 2013 price level with updated 2005 EKS purchasing power parities, 1.9 per cent detrended, 1955-2013
Source: Computed from OECD Stat Extract and The Conference Board, Total Database, January 2014, http://www.conference-board.org/economics
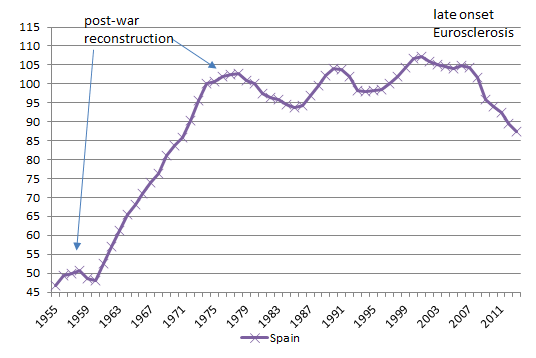
Spain had a pretty good run from the mid-1980s until the eve of the global financial crisis with somewhat above trend growth after a period of decline in the 1970s.
Figure 6: Real GDP per Spaniard aged 15-64, converted to 2013 price level with updated 2005 EKS purchasing power parities, 1.9 per cent detrended, 1955-2013
Source: Computed from OECD Stat Extract and The Conference Board, Total Database, January 2014, http://www.conference-board.org/economics
Post-war reconstruction then Eurosclerosis – Germany, Italy and France 1950-2013
04 May 2015 Leave a comment
in currency unions, economic growth, economic history, Euro crisis, macroeconomics Tags: Eurosclerosis, France, Germany, Italy, post-war reconstruction
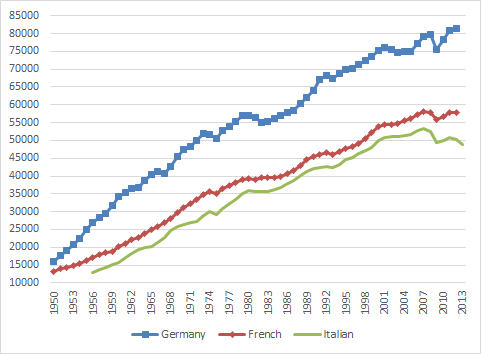
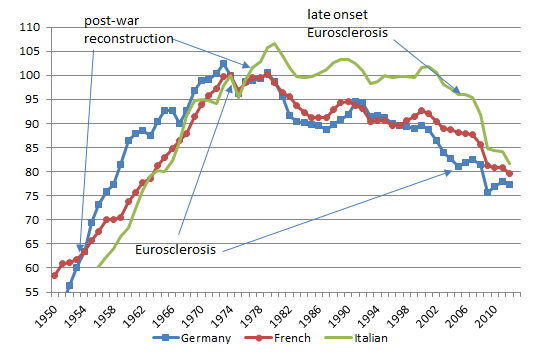
Figure 1: Real GDP per German, Italian and French aged 15-64, converted to 2013 price level with updated 2005 EKS purchasing power parities, 1950-2013
Source: Computed from OECD Stat Extract and The Conference Board, Total Database, January 2014, http://www.conference-board.org/economics
Figure 2: Real GDP per German, Italian and French aged 15-64, converted to 2013 price level with updated 2005 EKS purchasing power parities, 1.9 per cent detrended, 1950-2013
Source: Computed from OECD Stat Extract and The Conference Board, Total Database, January 2014, http://www.conference-board.org/economics
A flat line in figure 2 means real GDP growth of 1.9% per year, which is trend growth. A rising line means growth that is higher than trend rate; a falling line means growth at below the trend rate of 1.9%. 1.9% is the trend rate of growth of the USA in the 20th century. Figure 2 shows that:
- Germany, Italy and France all boomed until the mid-1970s;
- the French and German economies went into a long-term decline from that time; and
- the Italian economy stopped growing at anything more than the trend rate of growth between the mid-1970s and the mid-1990s and then went into a sharp decline that borders on the depression.
Recoveries from recessions across the G-7
28 Apr 2015 Leave a comment
in business cycles, economic growth, Euro crisis, global financial crisis (GFC), great recession, macroeconomics, politics - USA Tags: British economy, Canada, Eurosclerosis, France, Germany, Italy, Japan, recoveries from recessions
UK recovery: stronger than Italy, weaker than US & Canada. http://t.co/C0TEsbzMm3—
Jonathan Portes (@jdportes) April 28, 2015
A refugee boat from Libya
22 Apr 2015 Leave a comment
in Economics of international refugee law, law and economics Tags: European Union, Italy, Libya, refugees
Libyans are dying as they flee a mess that Britain helped create. It's time to help: specc.ie/1GMxFoc http://t.co/zyRgLFPZJ2—
Fraser Nelson (@FraserNelson) April 18, 2015
Equivalent of 5 passenger planes full of people have drowned last week alone amn.st/6010frwe #DontLetThemDrown http://t.co/bEIE2mpJIh—
Amnesty UK (@AmnestyUK) April 20, 2015
Italy is Europe’s ticking time bomb
15 Feb 2015 Leave a comment


Recent Comments