14 Aug 2015
by Jim Rose
in economic history, Euro crisis, labour economics, unions, urban economics
Tags: Eurosclerosis, France, German unification, Germany, Italy, union membership, union power, union wage premium
There are large differences in unionisation rates between the three countries. France has always had low levels of unionisation which halved since the 1970s. Italy had a sharp boost in union membership in the number of unions in the 1960s and 70s. This may have been associated with increased urbanisation. Union membership rate stayed pretty high in Italy ever since with a small taper downwards. Germany had stable unionisation rates prior to German unification after which the numbers about halved up in a slow taper.

Source: OECD Stat Extract.
12 Aug 2015
by Jim Rose
in business cycles, economic history, Euro crisis, job search and matching, labour economics, macroeconomics, unemployment
Tags: employment law, equilibrium unemployment rate, Eurosclerosis, Italy, labour market regulation, natural unemployment rate, unemployment duration
Unemployment of more than a year was slowly tapering down in Italy before the global financial crisis, but ever so slowly.

Source: OECD StatExtract.
05 Aug 2015
by Jim Rose
in currency unions, economic growth, economic history, economics of regulation, Euro crisis, fiscal policy
Tags: British disease, British economy, Eurosclerosis, France, Germany, Italy, sick man of Europe, Sweden, Swedosclerosis
Figure 1 shows stark differences between Sweden, France, Italy and the UK since 1970 in departures from trend growth rates of 1.9% in real GDP per working age person, PPP. Italy did quite OK until 2000 growing at about the trend growth rate of 1.9% after which it fell into a hole so deep that it barely notice the onset of the global financial crisis. Sweden really had been the sick man of Europe until it turned its back on high taxing, welfare state socialism in the early 1990s. France has been in a long decline so much so that the global financial crisis is hard to pick up in the acceleration in its long decline in the mid-1990s. Figure 1 also shows Britain did very well, both under the neoliberal horrors of Thatcherism and the betrayals by Tony Blair of a true Labour Party platform. The UK grew at above the trend annual growth to 1.9% for most of the period from the early 1980s to 2007. The UK has done not so well since the onset of the global financial crisis.
Figure 1: Real GDP per Swede, French, British and Italian aged 15-64, 2014 US$ (converted to 2014 price level with updated 2011 PPPs), 1.9 per cent detrended, 1970-2013
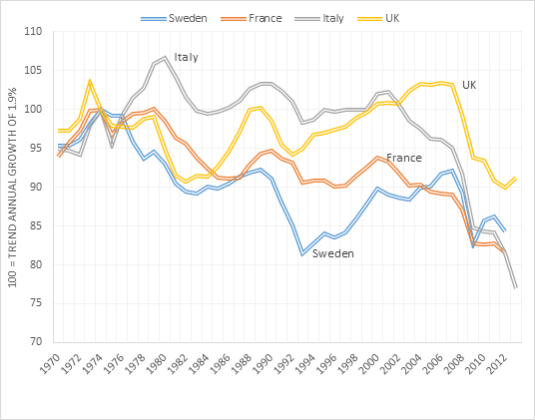
Source: Computed from OECD StatExtract and The Conference Board. 2015. The Conference Board Total Economy Database™, May 2015, http://www.conference-board.org/data/economydatabase/
Note: When the line is flat, the economy is growing at its trend annual growth rate. A falling line means below trend annual growth; a rising line means of above trend annual growth. Detrended with values used by Edward Prescott.
German data was not in figure 1 because German unification threw all of its data into disarray for long-term comparison purposes.
28 Jul 2015
by Jim Rose
in Euro crisis, job search and matching, labour economics, law and economics, macroeconomics
Tags: British economy, employment law, employment law regulation, Eurosclerosis, France, Germany, Greece, Italy, Portugal, Spain
Much easier to fire someone in the USA or UK than on continental Europe. Greece and Spain aren’t that bad by continental European standards for employment law protections against dismissals of individuals.
Figure 1: Strictness of employment protection for individual dismissals, 2013

Source: OECD StatExtract.
27 Jul 2015
by Jim Rose
in currency unions, economic history, Euro crisis, fiscal policy, labour economics, labour supply
Tags: ageing society, demographics crisis, economics of retirement, female labour force participation, Greece, Italy, male labour force participation, old age pensions, older workers, Portugal, social insurance, Social Security, Spain, taxation and labour supply
Figure 1 shows a relatively distinct pattern for men in the PIGs. Portugal aside, there has been a long decline retirement ages. This is different to the Anglo-Saxon countries where effective retirement ages have been increasing in recent years for men.
Figure 1: average effective retirement age (5-year averages), men, Portugal, Italy, Greece and Spain, 1970 – 2012

Source: OECD Pensions at a Glance.
Figure 2 shows that apart from Greece, that after a long decline in female effective retirement ages, there was something the rebound, especially in Italy and Portugal. In Greece, the rebound was in the 80s, followed by a resumption of decline from the mid 90s.
Figure 2: average effective retirement age (5-year averages), women, Portugal, Italy, Greece and Spain, 1970 – 2012

Source: OECD Pensions at a Glance.
19 Jul 2015
by Jim Rose
in business cycles, economic growth, economic history, fiscal policy, job search and matching, labour economics, macroeconomics, unemployment
Tags: Celtic Tiger, equilibrium unemployment rate, Eurosclerosis, Germany, Ireland, Italy, natural unemployment rate, Rance, Spain
Figure 1 shows large contrasts in time path of equilibrium unemployment rates. For example, French and Italian equilibrium unemployment rates haven’t changed much since about 1986.
Figure 1: equilibrium unemployment rates, France, Germany, Italy, Ireland and Spain, 1968 – 2016

Source: OECD Economic Outlook June 2015 via OECD StatExtract..
Figure 1 also shows some fortuitous ups and downs in the German equilibrium unemployment rate. This estimate was available only from after German unification.
The equilibrium German unemployment rate rose from 6% to above 8% on the eve of the global financial crisis. Fortunately for Germany, major labour market reforms brought the equilibrium unemployment rate down as Germany moved into the global financial crisis.
The Spanish equilibrium unemployment rate had been terrible since about 1980, started to fall in the 1990s, then skyrocketed even before the onset of the global financial crisis – see figure 1.
There have been ups and downs in the Irish equilibrium unemployment rate – see figure 1. It was as high as 14% at the end of the Irish great depression of the 1970s and 1980s. The equilibrium Irish unemployment rate was 8% at the heyday of the Celtic tiger then slowly rose in the lead up to the global financial crisis.
17 Jul 2015
by Jim Rose
in economics of regulation, industrial organisation, international economics, politics - USA
Tags: border costs, British economy, Canada, Common market, Common markets, customs unions, EU, France, free trade areas, Germany, Italy, NAFTA, trade costs
Figure 1: World Bank Doing Business rankings and sub rankings for trading across the French, German, Italian, British, Canadian and US borders, 2014

Source: World Bank Doing Business database; note: cost of importing and exporting not included.
Figure 2: World Bank Doing Business rankings – cost of importing and exporting across the French, German, Italian, British, Canadian and US borders, 2014

Source: World Bank Doing Business database; note: cost of importing and exporting not included.
09 Jul 2015
by Jim Rose
in applied price theory, applied welfare economics, comparative institutional analysis, economics of regulation, industrial organisation, law and economics, politics - Australia, politics - New Zealand, politics - USA, property rights
Tags: British economy, doing business, France, Germany, Italy, World Bank
Figure 1: Starting a business rankings – World Bank Doing Business rankings, OECD countries, 2014

Source: Doing Business – Measuring Business Regulations – World Bank Group.
There is surprising wide range in the World Bank Doing Business ranking of the difficulty and delays in starting a business across the OECD.
Germany is ranked 114 from the world for starting a business. New Zealand is ranked first with the USA, Italy and the UK ranked in the mid 40s in the Doing Business database.
05 Jul 2015
by Jim Rose
in applied price theory, applied welfare economics, comparative institutional analysis, economics of regulation, entrepreneurship, industrial organisation, international economics, law and economics, property rights, survivor principle
Tags: doing business, Eurosclerosis, Italy, rule of law, Russia, transitional economies
Figure 1: Doing Business rankings, Russia and Italy, 2014

Source: World Bank Doing Business 2015.
It is rather disturbing that it is a lot easier to register property and enforce contracts in Russia than in Italy and far harder to pay your taxes in Italy. Once again, Italy’s saving grace is the ability to trade across borders Because of its membership of the European Union.
03 Jul 2015
by Jim Rose
in applied price theory, applied welfare economics, currency unions, economic growth, economics of bureaucracy, economics of regulation, Euro crisis, health and safety, income redistribution, industrial organisation, labour economics, law and economics, minimum wage, occupational regulation, property rights, Public Choice, rentseeking, survivor principle, unions, welfare reform
Tags: cost of doing business, Eurosclerosis, Greece, Italy, PIGS, Portugal, Spain
Figure 1: Doing Business rankings, PIGS, 2014

Source: World Bank Doing Business 2015.
All in all, Italy and Greece are a dog of a place to enforce a contract. The long-suffering taxpayer is better off paying taxes in Greece than in Italy! Not surprisingly, trading across borders is the greatest strength in doing business in the PIGS. The European Union does have some benefits.
Figure 2: Doing Business rankings, Greece and Italy, 2014

Source: World Bank Doing Business 2015.
All in all, Italy and Greece are equally bad places to do business and Italy is much worse when it comes to taxes. About the only saving graces of Italy is the registration of property and the protection of minority interests in companies.
Figure 3: Doing Business rankings, Spain and Portugal, 2014

Source: World Bank Doing Business 2015.
Spain and in particular Portugal are much better places to do business than Italy and Greece.
10 Jun 2015
by Jim Rose
in business cycles, currency unions, economic growth, Euro crisis, global financial crisis (GFC), great recession, macroeconomics
Tags: Eurosclerosis, France, Germany, Italy, Spain
Previous Older Entries Next Newer Entries


Recent Comments