Margaret Thatcher was born #OnThisDay in 1925. What Britain looked like under her tenure econ.trib.al/oWL5m7a http://t.co/TtFuexIFdM—
The Economist (@EconBritain) October 13, 2015
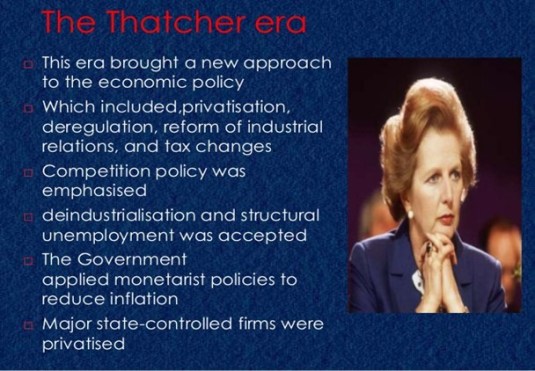
Margaret Thatcher was born #OnThisDay in 1925.
14 Oct 2015 Leave a comment
in economic history Tags: British economy, British politics, Margaret Thatcher
Real GDP per working age British, Dane and Swede 1950 – 2012, PPP
24 Sep 2015 Leave a comment
in economic history Tags: British disease, British economy, Common market, customs unions, Denmark, European Union, Margaret Thatcher, Sweden, Swedosclerosis

Source: Computed from OECD StatExtract and The Conference Board. 2015. The Conference Board Total Economy Database™, May 2015, http://www.conference-board.org/data/economydatabase/

Source: Computed from OECD StatExtract and The Conference Board. 2015. The Conference Board Total Economy Database™, May 2015, http://www.conference-board.org/data/economydatabase/
The data is detrended at 1.9% per year – the trend rate of growth for the USA in the 20th century. A rising line means growth greater than 1.9% for that year, a falling line means growth of less than 1.9% for the year. A flat line is growth of 1.9% for that year.
Britain, Sweden and Denmark all grew quickly up until the 1970s in a period known as post-war catch up.In the 1970s and early 1980s, there was the British disease. The 1970s to the early 1990s was Swedosclerosis. There was a boom in the British economy subsequent to the economics of Mrs Thatcher.
British unemployment incidence by duration since 1983
09 Aug 2015 Leave a comment
in business cycles, economic history, global financial crisis (GFC), job search and matching, labour economics, labour supply, macroeconomics, unemployment Tags: British disease, British economy, equilibrium unemployment rate, Margaret Thatcher, natural unemployment rate, unemployment duration, unemployment rates
In contrast to the USA, there is been a long-term decline in long-term unemployment, that is unemployment of more than a year, in the British economy over the 1990s. The situation then stabilised and then increased after the global financial crisis. There is also a rather rapid fall in long-term unemployment in the mid-1980s as the British economy recovered under Thatchernomics

Source: OECD StatExtract.
Maggie Thatcher’s Rawlsian critique of socialism on her last day as Prime Minister
22 Jul 2015 Leave a comment
in liberalism, Marxist economics, Rawls and Nozick Tags: Leftover Left, Margaret Thatcher
Why I loath consensus making and bipartisanship
19 Jul 2015 Leave a comment
in constitutional political economy, income redistribution, Public Choice, rentseeking Tags: bipartisanship, Margaret Thatcher, political polarisation
Maggie Thatcher on the Greek crisis
17 Jul 2015 Leave a comment
in applied welfare economics, budget deficits, comparative institutional analysis, constitutional political economy, currency unions, economic growth, economic history, economics of regulation, Euro crisis, fiscal policy, income redistribution, macroeconomics, Marxist economics, Public Choice, rentseeking Tags: Greece, growth of government, Margaret Thatcher, size of government
Economic freedom and British productivity
30 May 2015 Leave a comment
in economic growth, macroeconomics Tags: British economy, Margaret Thatcher
Swedosclerosis and the British disease compared, 1950–2013
03 May 2015 2 Comments
in economic growth, economic history, entrepreneurship, macroeconomics, Public Choice, public economics Tags: British disease, British economy, Margaret Thatcher, poor man of Europe, Sweden, Swedosclerosis, taxation and the labour supply, welfare state
In 1970, Sweden was labelled as the closest thing we could get to Utopia. Both the welfare state and rapid economic growth – twice as fast as the USA for the previous 100 years.
Of course the welfare state was more of a recent invention. Assar Lindbeck has shown time and again in the Journal of Economic Literature and elsewhere that Sweden became a rich country before its highly generous welfare-state arrangements were created
Sweden moved toward a welfare state in the 1960s, when government spending was about equal to that in the United States – less that 30% of GDP.
Sweden could afford to expand its welfare state at the end of the era that Lindbeck labelled ‘the period of decentralization and small government’. Swedes in the 60s had the third-highest OECD per capita income, almost equal to the USA in the late 1960s, but higher levels of income inequality than the USA.
By the late 1980s, Swedish government spending had grown from 30% of gross domestic product to more than 60% of GDP. Swedish marginal income tax rates hit 65-75% for most full-time employees as compared to about 40% in 1960. What happened to the the Swedish economic miracle when the welfare state arrived?
In the 1950s, Britain was also growing quickly, so much so that the Prime Minister of the time campaigned on the slogan you never had it so good.

By the 1970s, and two spells of labour governments, Britain was the sick man of Europe culminating with the Winter of Discontent of 1978–1979. What happened?

Sweden and Britain in the mid-20th century are classic examples of Director’s Law of Public Expenditure. Once a country becomes rich because of capitalism, politicians look for ways to redistribute more of this new found wealth. What actually happened to the Swedish and British growth performance since 1950 relative to the USA as the welfare state grew?
Figure 1: Real GDP per Swede, British and American aged 15-64, converted to 2013 price level with updated 2005 EKS purchasing power parities, 1950-2013, $US

Source: Computed from OECD Stat Extract and The Conference Board, Total Database, January 2014, http://www.conference-board.org/economics
Figure 1 is not all that informative other than to show that there is a period of time in which Sweden was catching up with the USA quite rapidly in the 1960s. That then stopped in the 1970s to the late 1980s. The rise of the Swedish welfare state managed to turn Sweden into the country that was catching up to be as rich as the USA to a country that was becoming as poor as Britain.
Figure 2: Real GDP per Swede, British and American aged 15-64, converted to 2013 price level with updated 2005 EKS purchasing power parities, detrended, 1.9%, 1950-2013

Source: Computed from OECD Stat Extract and The Conference Board, Total Database, January 2014, http://www.conference-board.org/economics
Figure 2 which detrends British and Swedish growth since 1950 by 1.9% is much more informative. The US is included as the measure of the global technological frontier growing at trend rate of 1.9% in the 20th century. A flat line indicates growth at 1.9% for that year. A rising line in figure 2 means above-trend growth; a falling line means below trend growth for that year. Figure 2 shows the USA growing more or less steadily for the entire post-war period. There were occasional ups and downs with no enduring departures from trend growth 1.9% until the onset of Obamanomics.
Figure 2 illustrates the volatility of Swedish post-war growth. There was rapid growth up until 1970 as the Swedes converged on the living standards of Americans. This growth dividend was then completely dissipated.
Swedosclerosis set in with a cumulative 20% drop against trend growth. The Swedish economy was in something of a depression between 1970 and 1990. Swedish economists named the subsequent economic stagnation Swedosclerosis:
- Economic growth slowed to a crawl in the 1970s and 1980s.
- Sweden dropped from near the top spot in the OECD rankings to 18th by 1998 – a drop from 120% to 90% of the OECD average inside three decades.
- 65% of the electorate receive (nearly) all their income from the public sector—either as employees of government agencies (excluding government corporations and public utilities) or by living off transfer payments.
- No net private sector job creation since the 1950s, by some estimates!
Prescott’s definition of a depression is when the economy is significantly below trend, the economy is in a depression. A great depression is a depression that is deep, rapid and enduring:
- There is at least one year in which output per working age person is at least 20 percent below trend; and
- there is at least one year in the first decade of the great depression in which output per working age person is at least 15 percent below trend; and
-
There is no significant recovery during the period in the sense that there is no subperiod of a decade or longer in which the growth of output per working age person returns to rates of 2 percent or better.
The Swedish economy was not in a great depression between 1970 and 1990 but it meets some of the criteria for a depression but for the period of trend growth between1980 and 1986.
Between 1970 and 1980, output per working age Swede fell to 10% below trend. This happened again in the late 80s to the mid-90s to take Sweden 20% below trend over a period of 25 years.
Some of this lost ground was recovered after 1990 after tax and other reforms were implemented by a right-wing government. The Swedish economic reforms from after 1990 economic crisis and depression are an example of a political system converging onto more efficient modes of income redistribution as the deadweight losses of taxes on working and investing and subsidies for not working both grew.
The Swedish economy since 1950 experienced three quite distinct phases with clear structural breaks because of productivity shocks. There was rapid growth up until 1970; 20 years of decline – Swedosclerosis; then a rebound again under more liberal economic policies.
The sick man of Europe actually did better than Sweden over the decades since 1970. The British disease resulted in a 10% drop in output relative to trend in the 1970s, which counts as a depression.

There was then a strong recovery through the early-1980s with above trend growth from the early 1980s until 2006 with one recession in between in 1990. So much for the curse of Thatchernomics?
After falling behind for most of the post-war period, the UK had a better performance compared with other leading countries after the 1970s.
This continues to be true even when we include the Great Recession years post-2008. Part of this improvement was in the jobs market (that is, more people in work as a proportion of the working-age population), but another important aspect was improvements in productivity…
Contrary to what many commentators have been writing, UK performance since 1979 is still impressive even taking the crisis into consideration. Indeed, the increase in unemployment has been far more modest than we would have expected. The supply-side reforms were not an illusion.
John van Reenen goes on to explain what these supply-side reforms were:
These include increases in product-market competition through the withdrawal of industrial subsidies, a movement to effective competition in many privatised sectors with independent regulators, a strengthening of competition policy and our membership of the EU’s internal market.
There were also increases in labour-market flexibility through improving job search for those on benefits, reducing replacement rates, increasing in-work benefits and restricting union power.
And there was a sustained expansion of the higher-education system: the share of working-age adults with a university degree rose from 5% in 1980 to 14% in 1996 and 31% in 2011, a faster increase than in France, Germany or the US. The combination of these policies helped the UK to bridge the GDP-per-capita gap with other leading nations.
Maggie Thatcher was early to the show on fossil fuels disinvestment
03 May 2015 Leave a comment
Does The @guardian think that Mrs T was right on fossil fuels after all, asks @Dannythefink http://t.co/GNWxmIAozw—
David Jack (@DJack_Journo) May 02, 2015
Malcolm Fraser was a great Prime Minister
20 Mar 2015 1 Comment
in politics - Australia Tags: Malcolm Fraser, Margaret Thatcher
Malcolm Fraser passed today. Like Margaret Thatcher, he was a great prime minister because he kept the Labor Party out of office until they were sane again.

Thatcher said that her greatest achievement was keeping the British Labour Party out of office when it had insane policies. Sadly, Fraser never came to realise that that was his greatest contribution as Prime Minister of Australia from 1975 to 1983.
Margaret Thatcher’s private bus has been put up for sale | City A.M.
10 Mar 2015 Leave a comment
in economic history Tags: Margaret Thatcher

If you’re a political memorabilia fan, this is a must-have: an armoured bus that once belonged to Margaret Thatcher has just gone up for sale – a snip at £25,000.

via Margaret Thatcher’s private bus has been put up for sale | City A.M..
The timing of major economic reform programmes
01 Mar 2015 Leave a comment
in applied welfare economics, economic growth, economics of regulation, monetarism, politics - Australia, politics - New Zealand, poverty and inequality Tags: economic reform, Margaret Thatcher, rent seeking, Rogernomics
There are plenty of critics of deregulation, albeit enough for them are smart enough to realise they cannot restore the lost monopolies and high marginal tax rates on the middle-class. They admit in their hearts that deregulation and other economic reforms worked as did inflation targeting.
The common force behind economic reform from 1980 onwards was the growing deadweight welfare losses of the pre-1980s status quo.The pressure for reform came from the rising burden that increases in taxes and regulation placed on economic growth as evidenced by the 1970s productivity slowdown and stagflation.
George Stigler argued that ideas about economic reform need to wait for a market. As Stigler noted, when their day comes, economists seem to be the leaders of public opinion. But when the views of economists are not so congenial to the current requirements of special interest groups, these economists are left to be the writers of letters to the editor in provincial newspapers and run angry blogs.
Post-1980 trends in taxes, spending, and regulation in New Zealand and abroad reflect demographic shifts, more efficient taxes, more efficient spending, a shift in the political influence from the taxed to the subsidised, shifts in political influence among taxed groups, and shifts in political influence among the subsidised groups (Becker and Mulligan 1998, 2003).
The common forces behind economic reform across the OECD area have subtle implications for the size of the reform dividend for New Zealand
- The deadweight losses of taxes, income transfers and regulation are a constraint on inefficient policies (Becker 1983, 1985; Peltzman 1989).
- This deadweight loss is the difference between winner’s gains less the loser’s losses from a tax or regulation-induced change in output. Changes in behaviour due to taxes and regulation reduce output and investment.
- Policies that significantly cut the total wealth available for distribution by governments are avoided because they reduce the payoff from taxes and regulation relative to the germane counter-factual, which are other even costlier modes of income redistribution (Becker 1983, 1985).
Certainly, in New Zealand, the post-1984 economic reforms followed a good 10 years of economic stagnation and regular economic crises.
In the early 1980s, New Zealand’s economy was in trouble. The country had lost its guaranteed export market when Britain joined the European Economic Union in 1973. The oil crisis that year had also taken a toll.
The Labour Party Minister of Finance, Sir Roger Douglas, prior coming to office in 1984, wrote a book called There’s Gotta Be A Better Way.

The rising deadweight cost of taxes and regulation due to technological change, and the dissipation of wealth through rising cost structures progressively enfeebled the subsidised groups, allowing others to win the initiative after the 1970s in many countries including New Zealand.
The Labour Government radically reduced the size and role of the state. It corporatised and restructured government departments, often in preparation for privatisation, and sold some state assets to private investors. It abolished many economic controls and removed farming subsidies.
The additional political pressure that the winners had to exert to keep the same dollar gain from income redistribution had to overcome rising pressure from the losers to escape their escalating losses.
Eventually, the fight was no longer worthwhile relative to the alternatives. Taxed, regulated and subsidised groups can find common ground in wealth enhancing policies and an encompassing interest in mitigating any reduction in wealth from income redistribution policies.
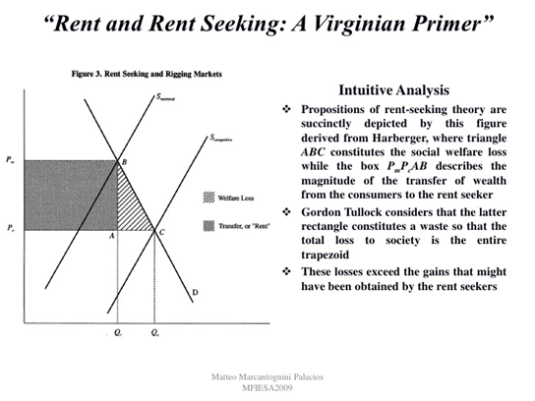
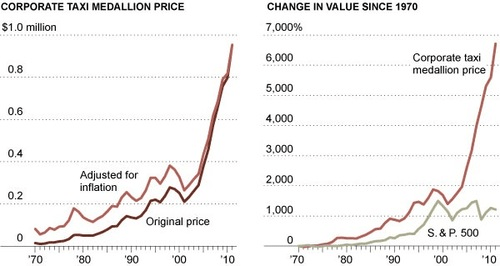
One barrier to reform is the transitional gains trap. The capitalisation of rents from taxi licenses is a classic example of the transitional gains trap.
Those who purchase the medallions from the owners at the time of initial regulation will pay the market rate for them and therefore will not receive any special rents. Yet, they will fight to prevent the taxi medallion system from being eliminated, since these owners will be harmed by such elimination. Thus, the city will be stuck with an inefficient medallion system that will be difficult to eliminate.
Eliminating the medallion program will harm existing taxis, many of whom did not lobby for the system in the first place and do not receive super competitive profits. The resources used in establishing the regulation or other programmes are lost forever.
Termination of a particular regulation or subsidies will nonetheless cause large capital losses for the incumbents. This will motivate incumbents to oppose reforms that jeopardise the income stream that has been previously capitalised (Tullock 1975; McCormick et al. 1984; Tollison and Wagner 1991). Any resources wasted in fighting economic reform must be deducted from the net gains from economic reform.
The literature on the transitional gains trap suggested that economic reform does not necessarily make society better off (Tullock 1975; McCormick et al. 1984; Tollison and Wagner 1991). The rent-seeking costs of the original privileges are capitalised and are lost forever. They are not regained by reform. The transitional gains trap is just a subset of a more general phenomenon indicating that deregulation can never replicate the status quo ante.
Too often it is assumed that deregulation can replicate the status quo ante. The prevailing model of deregulation is essentially a nirvana model, in that the gains from deregulation can essentially be had without cost. Further rent-seeking costs are incurred in lobbying for and against proposed reforms and these too are lost to forever.
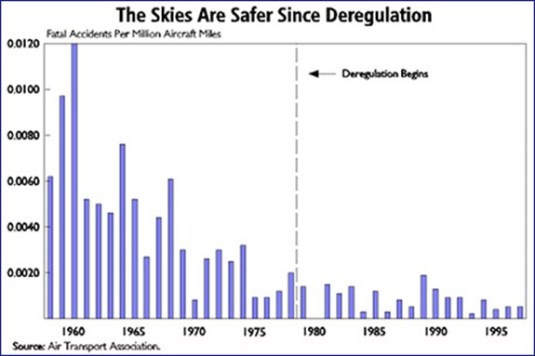
The standard analysis of deregulation too easily treats reform as a return to the status quo ante. Fred McChesney observed
The airline industry of 1999 is not the airline industry of 1978 minus the Civil Aeronautics Board.
The wealth lost in rent seeking is not recovered, or even recoverable by deregulation. Production possibilities have been irretrievably diminished (McCormick et al. 1984; Tollison and Wagner 1991).
Reform is not a free lunch. To the extent that specialised resources were involved in the rent seeking–resources that could have been devoted to amassing specific capital in producing the regulated good–the deregulated relative price must be higher than the pre-regulation or competitive price. The abstract of the relevant article by Tollison and Wagner is as follows:
This paper applies the theory of rent seeking to argue that economic reform, in the sense of correcting past deformities in the economy, does not pay from a social point of view. Economic reform, at best, should focus on the prevention of future deformities.
The analysis is developed in terms of the example of monopoly, but its applicability extends to any example of economic reform. The general principle underlying the analysis is that reform is not a free lunch, all the more so when the costs of the reformer and the resistance of the object of reform are taken into account.
Despite this, new institutions arise when social groups notice opportunities for new gains which are impossible to realise under the prevailing institutional arrangements (Diana Thomas 2009). The chances that new institutional frameworks may develop increase when these alternative technological opportunities and export markets become available.
Reform is more likely when the net benefits of reform become large because there is plenty left over for credible compensation of the losers who could block change (Acemoglu and Robinson 2005; Acemoglu 2008). An example is if taxes or regulation causes cost padding or delay new technologies. Shedding these inefficiencies are potential benefits for all.
The political secret of the East Asian economic miracles was the focus on export led industrialisation. Because the new industries were exporting rather than entering and competing with domestic suppliers to home markets, these domestic special interest groups had no reason to lobby against the establishment of these export industries and otherwise blocked both their entry and the adoption of new technologies. The social change is much more subtle. The local industry is simply had to pay more for contract as the export industries grew and bid away their labour force with higher pay.
Successful subsidised groups are often coalitions of sub-sets of producers, consumers, employees and input suppliers and deregulation is always a possibility if some members can benefit from joining another coalition (Peltzman 1976, 1989). A surprising number of incumbents of regulated and state-owned industries were unprofitable – some close to bankruptcy – because of rising cost structures, the growing losses from mandated services and erosion of rents through non-price competition with existing firms. They would have closed anyway but for bailouts.
The economic reforms that picked up pace around 1980 were a success as Andrei Shleifer’s paper
The Age of Milton Freedom begins
The last quarter century has witnessed remarkable progress of mankind. The world’s per capita inflation-adjusted income rose from $5400 in 1980 to $8500 in 2005.Schooling and life expectancy grew rapidly, while infant mortality and poverty fell just as fast.
Compared to 1980, many more countries in the world are democratic today. The last quarter century also saw wide acceptance of free market policies in both rich and poor countries: from private ownership, to free trade, to responsible budgets, to lower taxes.


Recent Comments