Great quote on the cruelty of the minimum wage from Nobel economist Vernon Smith, illustrated by Henry Payne https://t.co/Lwch51acEY—
Mark J. Perry (@Mark_J_Perry) October 24, 2015
@arindube Vernon Smith on the cruelty of the minimum wage
25 Oct 2015 Leave a comment
in economics of education, human capital, labour economics, labour supply, minimum wage, occupational choice, politics - Australia, politics - New Zealand, politics - USA Tags: living wage, minimum wage, on-the-job training
Tertiary educational attainment by age and gender, USA, UK, Canada and Australia, 2013
25 Oct 2015 Leave a comment
in discrimination, economics of education, gender, human capital, labour economics, occupational choice, politics - Australia, politics - USA Tags: Australia, British economy, Canada, reversing gender gap
There are marked differences in progress in tertiary educational attainment between countries and across the generations. For example, while a few more American women have tertiary degrees as compared to their mothers, there’s been no change for American men for a generation.

Source: Indicators of Gender Equality in Education – OECD.
Canada is firing ahead in both tertiary educational attainment and reversing the gender gap in education for good. Two thirds of prime age Canadian women have a tertiary degree as compared to half of their mothers.
The number of British women with tertiary degrees is also much higher than their mothers. British men are trying their best to keep up.
More evidence on the emergence of the working rich
25 Oct 2015 Leave a comment
in applied price theory, applied welfare economics, economics of education, entrepreneurship, human capital, labour economics, labour supply, Marxist economics, occupational choice Tags: College premium, creative destruction, education premium, entrepreneurial alertness, graduate premium, Leftover Left, superstar wages, superstars, top 1%
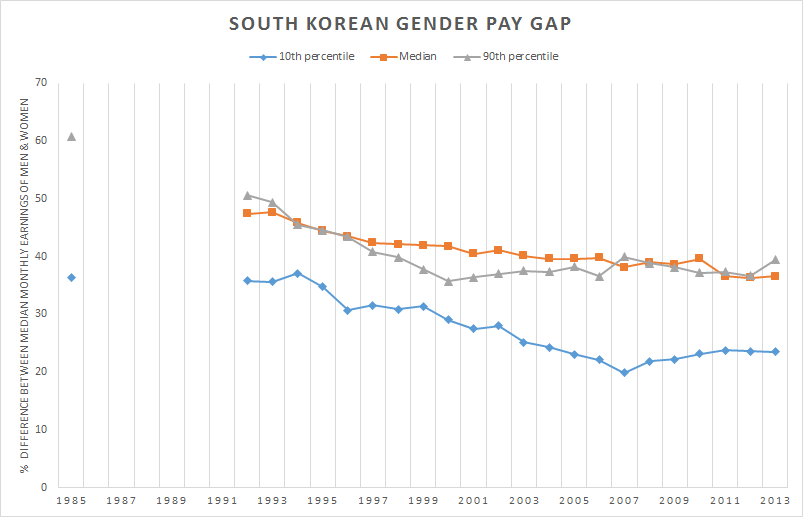
South Korean gender pay gap for the 10th, 50th and 90th percentile since 1985
24 Oct 2015 Leave a comment
in development economics, discrimination, economic history, economics of education, gender, growth miracles, human capital, labour economics, labour supply, occupational choice Tags: asymmetric marriage premium, compensating differentials, gender wage gap, marital division of labour, South Korea
The Japanese gender pay gap at the 10th, 50th and 90th percentile since 1975
23 Oct 2015 Leave a comment
in discrimination, economic history, gender, human capital, labour economics, labour supply, occupational choice Tags: compensating differentials, gender wage gap, Japan
The unadjusted gender pay gap is still large in Japan but is declining slowly.

Keep calm and carry on – the British gender pay gaps at the 10th, 50th and 90th percentiles
23 Oct 2015 Leave a comment
in discrimination, gender, human capital, labour economics, occupational choice, politics - New Zealand, politics - USA, population economics Tags: gender wage gap
Unlike New Zealand or the USA, there is been steady progress up and down the entire British labour market in closing the gender pay gap.
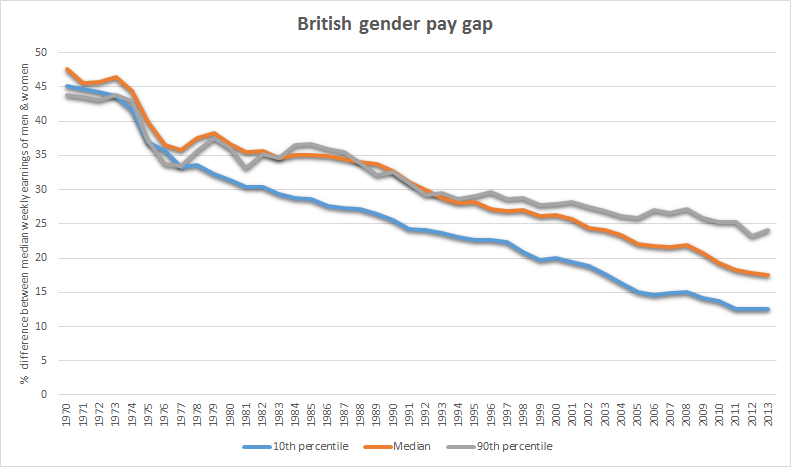
Source: OECD Employment Database.
The reverse gender gap in black education
22 Oct 2015 Leave a comment
in discrimination, economics of education, human capital, labour economics, labour supply, occupational choice, poverty and inequality, welfare reform Tags: reversing gender gap
NZ gender pay gap has closed – at the bottom anyway @YWCAAuckland @SFWU @JanLogie @FairnessNZ @ncwnz
21 Oct 2015 2 Comments
in discrimination, economics of education, gender, human capital, labour supply, politics - New Zealand Tags: Claudia Goldin, gender wage gap, pay equity, Solomon Polachek
Good on you @janlogie, @TraceyMartinMP and Louisa Wall, the next 3 MPs to pledge support at equalpay.org.nz http://t.co/D2rh75VjZx—
SFWU (@SFWU) September 07, 2015
The Auckland YMCA has made some strong claims about the persistence of gender wage gap saying that it is stubbornly stuck at 14% (when measured against average earnings).
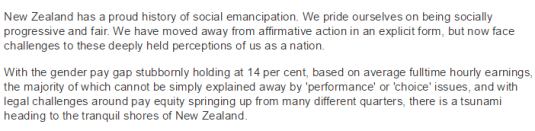
Source: The gender pay gap needs to start closing.
It is not usual to measure the gender wage gap against average earnings. Median earnings preferably on an hourly basis is the normal measure. Moreover, more long-term data is readily available on the Internet about median earnings rather than average earnings.
For example, as the chart below shows the unadjusted gender wage gap in New Zealand is a little bit less than the 14% claimed by Auckland YMCA when measured against median earnings and has been slowly tapering down for 15 years.
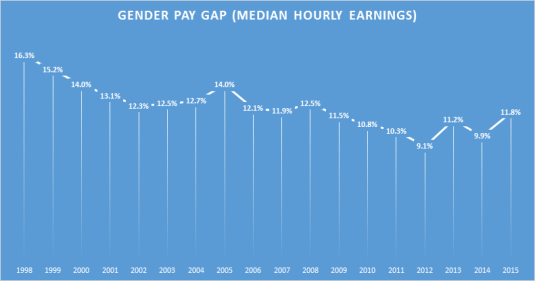
Source: Statistics New Zealand New Zealand Income Survey.
My larger claim is the gender pay gap has been in a long-term decline for generations. More importantly, the gender will pay gap is disappeared at the bottom of the labour market. For the past 5 to 10 years, the unadjusted gender wage gap rounds down to zero at the bottom of the pay structure for full-time employees.
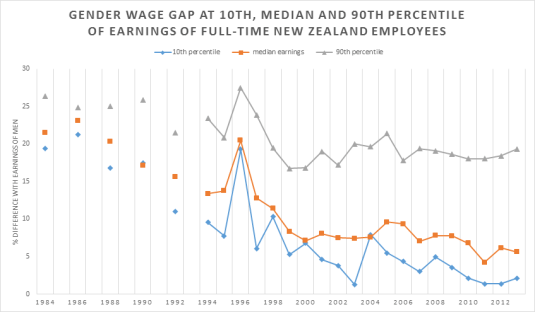
Source: OECD Employment Database.
The gender wage gap remains stubbornly high at the high end of the wage market at 15-20% because of compensating differentials. Women are balancing families and careers in choosing the occupations that best suits each individual woman.
How big is the wage gap in your country? bit.ly/18o8icV #IWD2015 http://t.co/XTdntCRfDQ—
(@OECD) March 08, 2015
Studies of top earning professionals show that they make quite deliberate choices between family and career. The better explanation of why so many women are in a particular occupation is job sorting: that particular job has flexible hours and the skills do not depreciate as fast for workers who take time off, working part-time or returning from time out of the workforce. Low job turnover workers will be employed by firms that invest more in training and job specific human capital.
- Higher job turnover workers, such as women with children, will tend to move into jobs that have less investment in specialised human capital, and where their human capital depreciates at a slower pace.
- Women, including low paid women, select careers in jobs that match best in terms of work life balance and allows them to enter and leave the workforce with minimum penalty and loss of skills through depreciation and obsolescence.
This is the choice hypothesis of the gender wage gap. Women choose to educate for occupations where human capital depreciates at a slower pace. This gender wage gap for professionals can be explained by the marriage market combined with assortative mating:
- Graduates are likely to marry each other and form power couples; and
-
There tends to be an age gap between men and women in long-term relationships and marriages of two years.
This two-year age gap means that the husband has two additional years of work experience and career advancement. This is likely to translate into higher pay and more immediate promotional prospects. Maximising household income would imply that the member of the household with a higher income, and greater immediate promotional prospects stay in the workforce. This is entirely consistent with the choice hypothesis and equalising differentials as the explanation for the gender wage gap. As Solomon Polachek explains:
At least in the past, getting married and having children meant one thing for men and another thing for women. Because women typically bear the brunt of child-rearing, married men with children work more over their lives than married women. This division of labour is exacerbated by the extent to which married women are, on average, younger and less educated than their husbands.
This pattern of earnings behaviour and human capital and career investment will persist until women start pairing off with men who are the same age or younger than them.
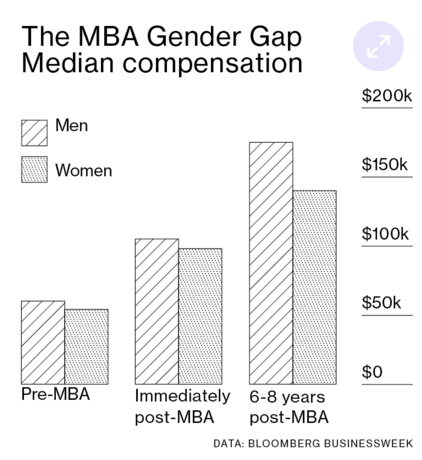
Claudia Goldin did a great study of Harvard MBAs using online surveys of their careers. She found that three proximate factors accounted for the large and rising gender gap in earnings:
- differences in training prior to MBA graduation,
- differences in career interruptions, and
- differences in weekly hours.
The greater career discontinuity and shorter work hours for female MBAs are largely associated with motherhood. There are some jobs that are severely penalise any time out of the workforce. A 2014 Harvard Business School study found that 28 percent of recent female alumni took off more than six months to care for children; only 2 percent of men did.
Claudia Goldin has described pharmacy is the most family friendly occupation. She compares it to law. In law, if you work long hours, you are on partnership track and win the top clients. In pharmacy, the only advantage of working longer hours as you earn more money that week. Also, pharmacists are completely interchangeable. Do you care which pharmacist fills out your prescription at your local pharmacy or even know which one fills it out? Lawyers are not interchangeable: they cannot just handover a case. Detailed briefings would be required. You expect your lawyer to show up in court or at meetings on time anywhere without fail.

Claudia Goldin found one counterfactual that cancels out the gender wage gap amongst MBA professionals: hubby earns less! Female MBAs who’ve have a partner who earn less than them earn as much as the average MBA professional on an hourly basis but work a few less hours per week.
The gender wage gap is persisted in high-paying jobs because career women have so many options. They can mix and match career and motherhood in fine detail.
In low-paying jobs, there is little in the way of trade-offs other than full-time or part-time work. Low-paid jobs do not involve choosing majors at university, choosing careers, industries and employers that call for long hours and uninterrupted careers or not so long hours, fewer human capital and promotional penalties for time off and more work-life balance.
The choice hypothesis is the far better explanation for the persistence of the unadjusted gender wage gap in New Zealand, which is small by international standards. As Polachek explains:
The gender wage gap for never marrieds is a mere 2.8%, compared with over 20% for marrieds. The gender wage gap for young workers is less than 5%, but about 25% for 55–64-year-old men and women.
If gender discrimination were the issue, one would need to explain why businesses pay single men and single women comparable salaries. The same applies to young men and young women. One would need to explain why businesses discriminate against older women, but not against younger women. If corporations discriminate by gender, why are these employers paying any groups of men and women roughly equal pay?
Why is there no discrimination against young single women, but large amounts of discrimination against older married women? … Each type of possible discrimination is inconsistent with negligible wage differences among single and younger employees compared with the large gap among married men and women (especially those with children, and even more so for those who space children widely apart)
The main drivers of the gender wage gap are unknown to employers such as whether the would-be recruit or employer is married, their partner is present, how many children they have, how many of these children are under 12, and how many years are there between the births of their children.
In countries such as Sweden, the gender wage gap is no better than the OECD average, despite generous maternity and paternity leave. The reason is obvious. You do not close the gender wage gap for professional women by paying them to stay out of the workforce for a year or more perhaps several times over at critical junctures early in their careers.
Long parental leave in Sweden is responsible for a thick Swedish glass ceiling because of lower levels of human capital investment among women and employers’ responses by placing fewer women in fast-track career. Extensive parental leave makes holding a job easier and more family-friendly, it may not be as effective as some might think in eradicating the gender gap for professional women.
Has the gender gap closed for graduates over the last generation? @greencatherine
19 Oct 2015 Leave a comment
in discrimination, economics of education, gender, human capital, labour economics, occupational choice Tags: asymmetric marriage premium, compensating differentials, economics of fertility, gender wage gap, marriage and divorce, reversing gender gap
Today’s women who are well-established in their careers in their 30s and 40s are doing better than their mothers who are also tertiary educated in terms of closing the gender wage gap. The gender wage gap in the chart below is unadjusted. It is the raw gender wage gap for women aged 35 to 44 and for women aged 55 to 64.

In Canada and the USA there is been no progress at all. In New Zealand, the gender gap between male and female tertiary educated workers is a little larger for today’s prime age women graduates than for older female workers who completed a tertiary education.
I suspect that gender gap be no smaller for today’s career women as compared to two decades ago has something to do with compensating differentials.

Today’s career women want it all: both motherhood and a career. They trade-off work-life balance for wages.
Women choose university degrees and occupations that are more agreeable to a balancing motherhood and a career.
Tertiary education premium by gender in the English-speaking countries, 2012
19 Oct 2015 1 Comment
in discrimination, economics of education, gender, human capital, labour economics, occupational choice, politics - Australia, politics - New Zealand, politics - USA Tags: Australia, British economy, Canada, College premium, education premium, gender wage gap, Ireland, New Zealand, reversing gender gap
There are large differences in the education premium between English speaking countries and also by gender. The tertiary premium in New Zealand is pretty poor compared to the USA, UK or Ireland and is still mediocre when compared to Australia and Canada.
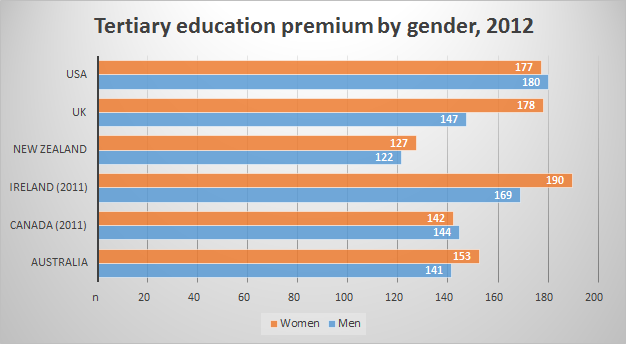
Source: Education at a Glance 2014.
Will high marginal tax rates and redistribution fix inequality?
18 Oct 2015 Leave a comment
in applied price theory, applied welfare economics, entrepreneurship, human capital, labour economics, occupational choice, politics - USA, poverty and inequality Tags: Gini coefficient, rational irrationality, taxation and entrepreneurship, taxation and human capital, taxation and labour supply, taxation investment
@janlogie The dramatic closing of the gender pay gap at the 10th percentile in the US, UK, Australia and NZ since 1970 but not at the 90th percentile!
15 Oct 2015 4 Comments
in discrimination, economic history, gender, human capital, labour economics, politics - Australia, politics - New Zealand, politics - USA Tags: asymmetric marriage premium, compensating differentials, gender wage gap, marriage and divorce
It seems that the top 10% of men are so busy oppressing the top 10% of women that they forgot to keep up the violence inherent in the capitalist system against the bottom 10% of women. The gender pay gap at the bottom of the economic strata closed quite dramatically and consistently since 1970 or as far back as data was available in Australia, New Zealand, the UK and USA. Much of the closing of the gender pay gap for the low-paid was under the scourge of Reagan, Thatcher, Hawke and Keating and Rogernomics.
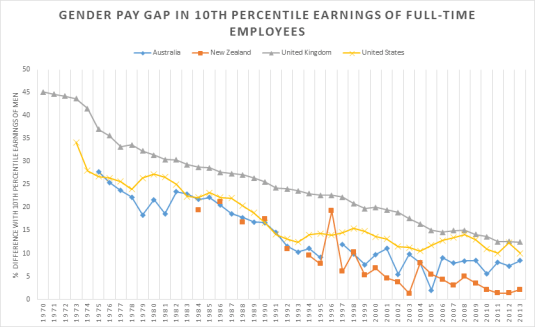
Source and Notes: OECD Employment Database. The gender gap plotted below is unadjusted. It is calculated as the difference between the 10th percentile earnings of men and the 10th percentile earnings of women relative to the 10th percentile earnings of men. Estimates of earnings used in the calculations refer to gross earnings of full-time wage and salary workers. However, this definition may slightly vary from one country to another.
By comparison to this dramatic liberation of women from the gender pay gap at the bottom, the gender pay gap for full-time employees has not really tapered down that much at the top of the income distribution and has been pretty flat for coming on 20 years. It seems the class war is over and has been won by women at the bottom but not at the top?
Younger, more educated women delay having families and can earn as much as their partners. bit.ly/1jw98Ky http://t.co/BaDIlBIBA2—
Ninja Economics (@NinjaEconomics) October 14, 2015
Rather than up the workers, the battle cry of the Posh Trots is up the managers, liberate them from insidious pay inequities imposed upon them by a vast sexist conspiracy of male managers.
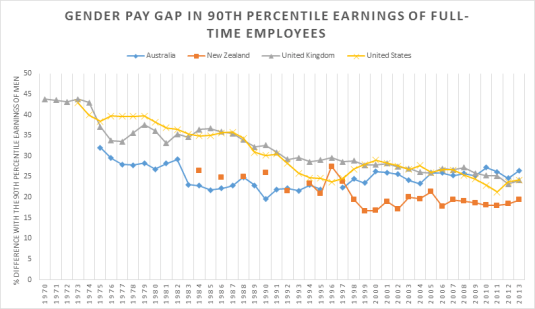
Source and Notes: OECD Employment Database. The gender gap plotted below is unadjusted. It is calculated as the difference between the 10th percentile earnings of men and the 10th percentile earnings of women relative to the 10th percentile earnings of men. Estimates of earnings used in the calculations refer to gross earnings of full-time wage and salary workers. However, this definition may slightly vary from one country to another.
This failure to close the gender pay gap at the top requires more investigation. The available of reliable contraceptives in the late 1960s led to an explosion of investment by women in long duration professional education and in careers where absences because of motherhood in their 20s and 30s was penalised in terms of human capital depreciation and promotional opportunities.

The reason for the endurance of the gender pay gap at the top of the income distribution is compensating differentials. Women at the top were able to have it all.

Professional women could invest in a career and a family and mix-and-match according to their own preferences for career and family and timing of births rather than the preferences of others who looked upon them as some sort of pathfinder for their gender. It is at the top of the income distribution where short absences from the workplace can has very large consequences for wages and promotion.
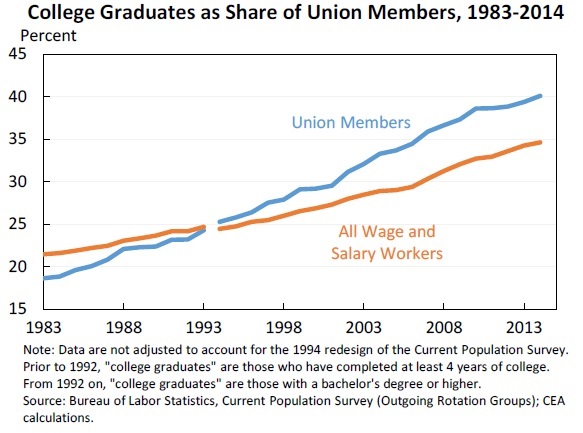
The withering away of unions as a working class movement @nzlabour @FairnessNZ
09 Oct 2015 Leave a comment
% women 25-34 & 45-54 with at least tertiary education, English-speaking countries, 2008
06 Oct 2015 Leave a comment
in discrimination, economics of education, gender, human capital, labour economics
With 40 to 50% of women, and many more in Canada, now going on to tertiary education, claims such as recently by the OECD and IMF that there is problems of access to education as a driver of inequality seem even more doubtful.
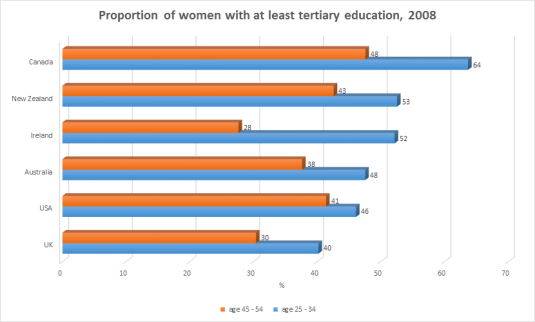
Source: DOING BETTER FOR FAMILIES – OECD 2011, Figure Box 1.3.
Not only do women have to overcome the financing constraint on going onto higher education that so troubles the IMF and the OECD, women of today and yesterday must overcome the dead hand of patriarchy. They have the both the top 1% and all men scheming against them, apparently. Despite this double secret double conspiracy against them, the number of women going on to some form of tertiary education has increased rapidly within a generation from an already high base.
dodgy @OECD paper on inequality & growth doing the Twitter Left rounds again
05 Oct 2015 1 Comment
in economic growth, economic history, economics of education, human capital, politics - New Zealand, politics - USA, population economics, poverty and inequality Tags: economics of personality traits, economics of schools, education premium, endogenous growth theory, IMF, James Heckman, Leftover Left, OECD, student loans, top 1%, Twitter left
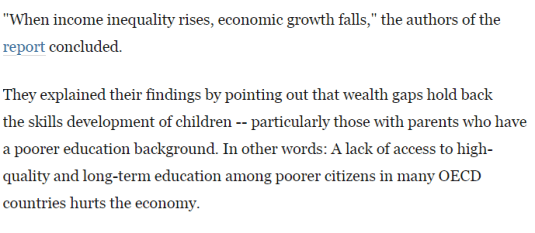
Rick Noack did a great job in the Washington Post today to concisely summarise the hypothesis behind the OECD’s claim that inequality holds back growth. In the case of New Zealand 15 ½ percentage points of economic growth was lost due to rising equality since the late 1980s.
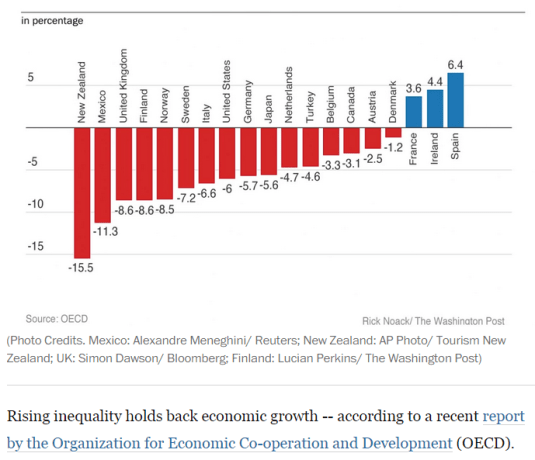
Source: How inequality made these Western countries poorer – The Washington Post.
According to the OECD, it is all about the ability to lower middle class and working class families to finance the human capital investments of their children. The OECD theory of inequality and lower growth is there is a financing constraint because of inequality that reduces economic growth because of less human capital accumulation by lower income families.
Source: How inequality made these Western countries poorer – The Washington Post.
In an age of interest-free student loans or cheap student loans everywhere for several decades now at least, the OECD is nonetheless hanging its head on the notion that not enough has been done to ensure there is enough graduates from the lower middle class and working class families making it to university. Taylor also has the same problem as me with the OECD’s human capital and inequality nexus:
There are a few common patterns in economic growth. All high-income countries have near-universal K-12 public education to build up human capital, along with encouragement of higher education. All high-income countries have economies where most jobs are interrelated with private and public capital investment, thus leading to higher productivity and wages. All high-income economies are relatively open to foreign trade.
In addition, high-growth economies are societies that are willing to allow and even encourage a reasonable amount of disruption to existing patterns of jobs, consumption, and ownership. After all, economic growth means change.
One of the findings of the Coleman report in the 1960s, which is been pretty much backed up since then such as by top labour economists such as James Heckman, is family background is the key to skills development in children, not the quality of their schools or their access to finance for higher education.

Schools work with what families present to them in terms of innate ability, and personality traits such as to pay attention and work. There is not much difference between an average bad public school and an average good public school when it comes to getting on in life. Going to really bad public school is different from just going to an average bad public school in terms of the chaos imposes on a child’s education and upbringing. What matters is the home environment rather than the ability to access good schools and families of ordinary means to finance higher education for their teenagers.
Most of the skill gaps that are present at the age of 18 – skill gaps which substantially explain gaps in adult earnings and employment in all groups – are also present at the age of five (Cunha and Heckman 2007). There is much evidence to show that disadvantaged children have lower levels of soft skills (non-cognitive skills): motivation, persistence, self-discipline, the ability to work with others, the ability to defer gratification and plan ahead, etc. (Heckman 2008). Most of the skills that are acquired at school build on these soft skills that are moulded and reinforced within the family.
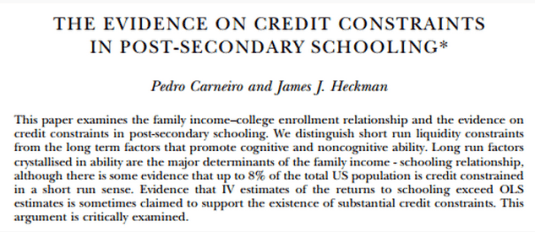
In 2002, with Pedro Carneiro, James Heckman showed that lack of access to credit is not a major constraint on the ability of young Americans to attend college. Short-term factors such as the ability to borrow to fund higher education has been found to be seriously wanting as an explanation for who and who does not go on to higher education.
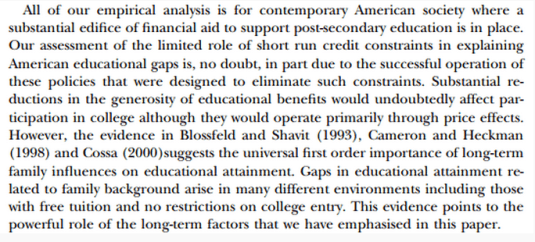
Only a small percentage of young people are in any way constrained from going on to higher education because of the lack of money. This is not surprising in any society with student loans freely available at low or zero rates without any need to post collateral. Heavily subsidised tuition fees and cheap student loans have been around for several generations.

Source: James Heckman.
The biggest problem with the OECD hypothesis linking a lack of skill development within lower income and working class families is it is such an easy problem to solve for the ambitious politician of either the left or the right by throwing money at the problem. Schooling until the age of 16 has been free for a century and universities have been virtually free for at least two generations. Lack of access to a good education does not cut it as the explanation for large disparities in growth rates.

The OECD and more recently the IMF have placed a lot of weight in access to human capital as a driver of inequality because human capital accumulation is hypothesised to be a major driver of economic growth.
The evidence that human capital is a key contributor to higher economic growth is weakening rather than strengthening. If human capital accumulation is not a major driver of productivity growth and productivity disparities, the inequality and growth hypothesis of the OECD and the IMF based on access to finance for human capital accumulation does not get out of the gate. Moreover, as Aghion said:
Economists and others have proposed many channels through which education may affect growth–not merely the private returns to individuals’ greater human capital but also a variety of externalities.
For highly developed countries, the most frequently discussed externality is education investments’ fostering technological innovation, thereby making capital and labour more productive, generating income growth. Despite the enormous interest in the relationship between education and growth, the evidence is fragile at best.
The trend rate of productivity growth did not accelerate over the 20th century despite a massive rise in investments in human capital and R&D because of the rising cost of discovering and adapting new technological knowledge. The number of both R&D workers and highly educated workers increased many-fold over the 20th century in New Zealand and other OECD member countries including the global industrial leaders such as the USA, Japan and major EU member states.
Cross-country differences in total factor productivity are due to differences in the technologies that are actually used by a country and the degree in the efficiency with which these technologies are used. Differences in total factor productivity, rather than differences in the amount of human capital or physical capital per worker explain the majority of cross-country differences in per capita real incomes (Lucas 1990; Caselli 2005; Prescott 1998; Hall and Jones 1999; Jones and Romer 2010).
Differences in the skills of the individual worker or in the total stock of human capital of all workers in a country cannot explain cross national differences in value added per worker at the industry level.
- The USA competes with Japan for productivity leadership in many manufacturing industries.
- The Japanese services sector productivity can be as little as a one-third of that of the USA.
- Japanese labour productivity is almost twice Germany’s in producing automobiles and is better that Germany by a large margin for many other manufactured goods.
- The USA is uniformly more productive in services sector labour productivity. For example, British, French and German telecom workers were 38 to 56 per cent as productive as their American counter-parts.
The USA, Japan, France, the UK and Germany all have relatively well-educated, experienced and tested labour forces. For example, the 1993 McKinsey’s study inquired into the education and skills levels of Japanese and German steel workers. Comparably skilled German steel workers were half as productive as their Japanese counterparts (Prescott and Parente 2000, 2005).
The ability to finance human capital accumulation and go to good schools is a weak theory of inequality. Human capital accumulation itself is a weak theory of growth unless linked to sophisticated theories of the institutions fostering innovation and technology absorption which it now is.
To be fair, I will not point out that this period of rising inequality since 1980s so damned by the OECD and the Twitter Left in the Washington Post today coincided with the return of real wages growth in New Zealand after 20 years of wage stagnation. That would be kicking the Twitter Left when they are down. I was a sneak in a graph instead.
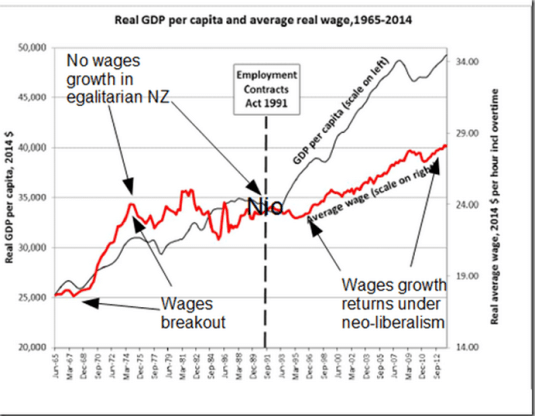
Data source: New Zealand Council of Trade Unions.
I will leave it for your own imagination to think of what happened to female labour force participation, the gender wage gap and female participation in higher education since the late 1980s and the onset of this horrific inequality which was mainly for men.
The failure of the Twitter Left to undertake a gender analysis of any labour force or income statistic they use is a major analytical shortcoming. Hardly any labour force statistics make any sense unless broken down by male and female outcomes.
 Utopia, you are standing in it!
Recent Comments