The mancession
06 Sep 2015 Leave a comment
in business cycles, economic history, global financial crisis (GFC), great recession, job search and matching, labour economics, labour supply, macroeconomics, unemployment Tags: reversing gender gap
More on the alienated proletariat
05 Sep 2015 Leave a comment
in economic history, economics of media and culture, labour economics, labour supply, liberalism, personnel economics Tags: Class war, Withering away of the proletariat
Hours worked per year across the OECD
31 Aug 2015 Leave a comment
in labour economics, labour supply Tags: hours worked

Single motherhood and the feminisation of poverty
31 Aug 2015 Leave a comment
in discrimination, economics of love and marriage, gender, labour economics, labour supply, politics - USA, poverty and inequality, welfare reform Tags: asymmetric marriage premium, child poverty, economics and fertility, engines of liberation, family poverty, marriage and divorce, marriage premium, single mothers, single parents
43.1% of single mothers are living in poverty this #MothersDay statusofwomendata.org http://t.co/OgWcmvLnDZ—
IWPR (@IWPResearch) May 10, 2015
Low numeracy skills across the OECD
30 Aug 2015 Leave a comment
in economics of education, human capital, labour economics, labour supply, occupational choice Tags: literacy and numeracy, PISA, reading and writing

The Chinese demographic crisis is now
26 Aug 2015 Leave a comment
in development economics, economic history, growth disasters, growth miracles, labour economics, labour supply, population economics Tags: ageing society, China, demographic crisis, older workers
China's massive economic advantage over the world is about to disappear read.bi/1MkYx1p http://t.co/Fw9zmMTuVx—
BI Markets (@themoneygame) August 11, 2015
Marginal tax rates of 2-income couples with 2 children in USA, UK, Australia and New Zealand since 2000
23 Aug 2015 Leave a comment
in economic history, economics of love and marriage, labour economics, labour supply, politics - Australia, politics - New Zealand, politics - USA, public economics Tags: Australia taxation and labour supply, British economy, marriage and divorce

Source: OECD StatExtract.
Marginal tax rates of a nuclear family in USA, UK, Australia and New Zealand since 2000
22 Aug 2015 Leave a comment
in economic history, economics of love and marriage, labour economics, labour supply, politics - Australia, politics - New Zealand, politics - USA Tags: Australia, British economy, marriage and divorce, taxation and labour supply

Source: OECD StatExtract.
Marginal tax rate of average earners in USA, UK, Australia and New Zealand since 2000
21 Aug 2015 Leave a comment
in applied price theory, business cycles, economic growth, economic history, labour economics, labour supply, macroeconomics, politics - Australia, politics - New Zealand, politics - USA, public economics Tags: Australia, British economy, productivity shocks, real business cycles, taxation and labour supply
Interesting to notice that in New Zealand and the USA after these increases in marginal tax rates on single taxpayers, their economies slowed down. What appears to have happened is a number of people reached the next income tax marginal tax rate threshold.

Source: OECD StatExtract.
The great divergence in average and marginal tax rates in New Zealand since 2000
20 Aug 2015 1 Comment
in applied price theory, applied welfare economics, human capital, labour supply, politics - New Zealand, public economics Tags: family tax credits, lost decades, taxation and the labour supply
21% would have been a good guess of the average and marginal tax rates of the New Zealand single earner or couple including with children and even a second earner in 2001. New Zealand average and marginal tax rates have been on a wild ride since the year 2000.
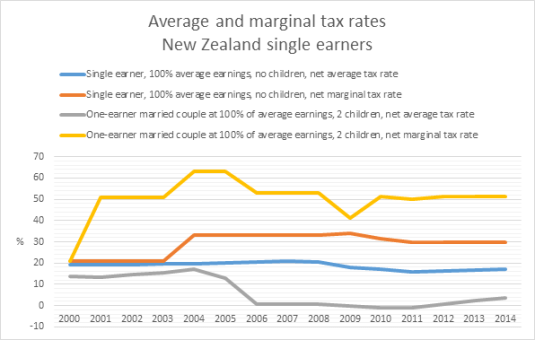
Sources: OECD StatExtract and OECD Taxing Wages.
As the above chart shows, while the average tax rate of a single earner with no children is pretty much unchanged at about 20%, he now faces a marginal tax rate of 30% or more rather than 21% in 2001.
For a married couple with one income, as the above chart shows, their average tax rate has been about zero for a good 10 years now but their net marginal tax rate is a good 50% or more because of abatement rates on family tax credits, which is a skewed incentive situation. A large income effect from the family tax credit encourages the consumption of leisure but a high marginal tax rate discourages working more.
Sources: OECD StatExtract and OECD Taxing Wages.
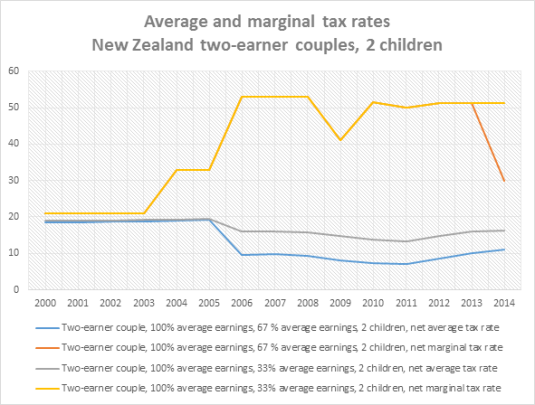
For two earner couples, their average tax rates have fallen because of family tax credits but their marginal tax rates have gone through the roof as the above chart shows. A tax system that discourages quite severely any further work or investment in human capital by average earners may have adverse effects on the long-term trend growth rate of New Zealand.
Some tax cuts for families! Average tax rates on married couple with one income, 2 kids in USA, UK, Australia and New Zealand since 2000
20 Aug 2015 Leave a comment
in economic history, labour economics, labour supply, politics - Australia, politics - New Zealand, politics - USA, public economics Tags: Australia, British economy, taxation and labour supply

Source: OECD StatExtract.
More evidence of mass kidnappings of #occupywallstreet activists
20 Aug 2015 Leave a comment
in applied price theory, human capital, income redistribution, labour economics, labour supply, politics - USA, poverty and inequality, Public Choice, rentseeking, sports economics Tags: expressive voting, Left-wing hypocrisy, Leftover Left, mass kidnappings, Occupy Wall Street, rational ignorance, rational irrationality, superstar wages, superstars, top 0.1%, top 1%
Ratio of Median Salary of Top 25 Highest Paid MLB Player to Avg. Worker Pay Increased from 100:1 to 700:1 Since 1988 http://t.co/5zLktBXS3D—
Mark J. Perry (@Mark_J_Perry) August 18, 2015
Marginal tax rates of New Zealand average households since 2000
19 Aug 2015 Leave a comment
in economic growth, fiscal policy, labour economics, labour supply, macroeconomics, politics - Australia, politics - New Zealand Tags: Australia, lost decades, marriage and divorce, productivity shocks, real business cycles, taxation and labour supply
In 2000 in New Zealand, the marginal tax rates of single earners, married couples and dual income couples were 21%.

Sources: OECD StatExtract.and OECD Taxing Wages.
Net personal marginal income tax rates increased:
- to 51% for one earner couples with two children in 2001 and stayed up above 50% until 2014; and
- to 33% for single earners with no children in 2004 because income growth pushed them into the next tax rate bracket which then dropped down to 30% in 2011.

Sources: OECD StatExtract.and OECD Taxing Wages.
Net personal marginal income tax rates increased:
- to 33% in 2004 for two earner couples with the second earner earning 33% of average earnings and then increased to 53% in 2006 and stayed high thereafter;
- to 33% in 2004 for a two earner couple with the second earner earning 67% of average earnings and then increased further to 53% in 2006 and stayed high until 2014 when their marginal income tax rate dropped to 30%; and

Sources: OECD StatExtract.and OECD Taxing Wages.
These large increases in marginal tax rates on single earners and families coincided with a slowing of the economy in about 2005. The economy started to pick up again when there were tax cuts introduced by the incoming National Party Government. Is that more than a coincidence?

Sources: Computed from OECD StatExtract and The Conference Board. 2015. The Conference Board Total Economy Database™, May 2015, http://www.conference-board.org/data/economydatabase/.
A flat line in the above figure is growth at the trend growth rate of 1.9% of the USA in the 20th century. A rising line is above trend growth for that year while a falling lined is below trend rate in GDP per working age person.
In the lost decades of New Zealand growth between 1974 In 1992, New Zealand lost 34% against trend growth which was never recovered. There was about 13 years of sustained growth at about the trend rate or slightly above that between 1992 and 2005. The entire income gap between Australia and New Zealand open up during these lost decades of growth between 1974 and 1992.

Sources: Computed from OECD StatExtract and The Conference Board. 2015. The Conference Board Total Economy Database™, May 2015, http://www.conference-board.org/data/economydatabase/.
Australia grew pretty much in its trend rate of growth since the 1950s. The so-called resources boom is not visible such as showing up as above trend rate growth.

Recent Comments