Substitution may mean the destruction of certain #jobs but not of employment! https://t.co/j9dxIhVBGT #FutureOfWork pic.twitter.com/132fEg6wgi
— OECD Social (@OECD_Social) January 14, 2016
There is nothing new about the coming of robots
28 Jan 2016 Leave a comment
in economic history, economics of media and culture, entrepreneurship, industrial organisation, labour supply, survivor principle, technological progress Tags: automation, rational irrationality, skill bias technical change, technological unemployment
@garethmorgannz @geoffsimmonz the public choice illogic of the UBI
27 Jan 2016 Leave a comment
in labour economics, labour supply, politics - New Zealand, poverty and inequality, public economics Tags: family tax credit, growth of government, negative income tax, size of government, social insurance, universal basic income, welfare state
Things are pretty grim when your ideas for fixing child poverty by throwing a lot more money at the problem are easily outclassed by the Greens in terms of economic rationale, fiscal sense and political practicality.
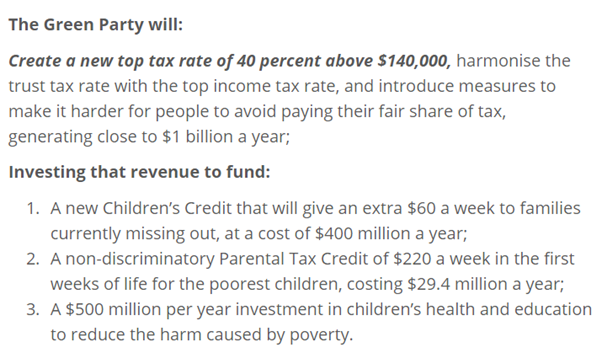
Source: Greens launch billion dollar plan to reduce child poverty | Green Party of Aotearoa New Zealand.
But that is the case for Gareth Morgan’s proposals for a universal basic income for New Zealand. His proposal for a universal basic income funded by comprehensive capital tax make much less sense than those of the Greens for giving the in work family tax credit for those do not work but are on a welfare benefit.
The Greens have a far superior proposal for reducing child poverty and a far better chance of getting it implemented in parliament. Their proposal is simply to introduce a parental tax credit and give the in work tax credit to those currently on the benefit to increase their incomes.
Gareth Morgan’s solution to child poverty is to give billions of dollars to adults not in poverty and leave those who are in poverty worse off under the universal basic income. It is obvious which of these is more likely to attract political support and provoke resistance from taxpayers and political parties willing to court those are opposed to great big new taxes.
One of the economic reforms in the 1980s and 1990s that saved the welfare state was more efficient taxes and more efficient government spending. The targeting of government social spending reduce growth in the overall tax burden and therefore the political resistance it provoked.
Government spending grew in many countries in the 20th century because of demographic shifts, more efficient taxes, more efficient spending, a shift in the political power from those taxed to those subsidised, shifts in political power among taxed groups, and shifts in political power among subsidised groups. Sam Peltzman argues that:
governments grow where groups which share a common interest in that growth and can perceive and articulate that interest become more numerous.
The median voter in all countries was alive to the power of incentives and to not killing the goose that laid the golden egg. After 1980, the taxed, regulated and subsidised groups had an increased incentive to converge on new lower cost modes of redistribution.
More efficient taxes, more efficient spending, more efficient regulation and a more efficient state sector reduced the burden of taxes on the taxed groups. Most subsidised groups benefited as well because their needs were met in ways that provoked less political opposition.
Gary Becker and Casey Mulligan in Deadweight Costs and the Size of Government (NBER Working Paper Number No. 6789) concluded that flatter and broader taxes encourage bigger government. This is because taxpayers offer less resistance to increases in flat tax rates than to more onerous and less efficient forms of taxation. Any decline in the resistance of taxpayers to taxes leads to larger governments since an endless number of groups lobby to divide up the large revenue base.
An inefficient tax system or spending program from the standpoint of optimal tax theory can improve taxpayer welfare this so-called inefficient system creates additional political pressure for suppressing the growth of government. Inefficient taxes do not raise much revenue and therefore do not support a large sized government.
A switch to more efficient taxes through tax reforms allows governments to raise the same amount or larger amount of revenue for the same level of political resistance from taxpayers. This is because less revenue and output is wasted by discouraging labour supply, investment, savings and investment in capital with high marginal rates of tax on narrower tax basis.
The rising deadweight losses of taxes, transfers and regulation all limit the political value of inefficient redistributive policies. Tax and regulatory policies that are found to significantly cut the total wealth available for redistribution by governments are avoided relative to the germane counter-factual, which are other even costlier modes of redistribution.
Long live the Slopegraph. Long live Edward Tufte. tinyurl.com/naeh7rc http://t.co/C8Lgnupxz9—
Amity Shlaes (@AmityShlaes) May 16, 2015
Everyone can gain from converging on more efficient modes redistribution. The tax burden is less than otherwise. Government spending is more than a wise because taxes are raised with less deadweight social costs.
An improvement in the efficiency of either taxes or spending reduces political pressure from taxed and regulated groups for suppressing the growth of government and thereby increases total tax revenue and spending because there is less political opposition. Improvements in the efficiency of taxes, regulation and in spending reduce political pressure from the taxed and regulated groups in society.
The post-1980 reforms of Thatcher, Reagan, Clinton, Hawke and Keating, Lange and Douglas and others saved the modern welfare state. Their moves towards more efficient taxes and better targeted social spending did reduce growth in government spending but also prevented even larger cuts to social spending since 1980 at the behest of the increasingly restive taxpayer.
Social spending growth did temper after 1980 but the level of spending was larger than otherwise because of the extra revenue raised through more efficient taxes – more efficient taxes which provoked less political opposition.
More efficient taxes, more efficient spending, more efficient regulation and a more efficient state sector reduced the burden on the taxed groups while still supporting extensive but more tempered social spending.
Governments everywhere hit a brick wall in terms of their ability to raise further tax revenues. Political parties of the Left and Right recognised this new reality. Gareth Morgan has not when he proposes a great big new tax to fund his universal basic income.
Billions of extra dollars in revenue must be raised and political resistance provoked to his proposed comprehensive capital tax to fund a universal basic income for those who are not poor. Child poverty is not reduced by a universal basic income because single parents and the children receive no more income support from government than before.
Which has more political legs? The Greens’ proposal to raise taxes by $1 billion to fight child poverty or the proposal by Gareth Morgan to raise taxes by 10 times that and have less impact on child poverty?
The current and future governments of New Zealand have enough on their plate to work out how to fund a universal old age pension and health spending without giving away billions of dollars to the non-poor through an universal basic income.
@garethmorgannz @geoffsimmonz the labour supply effects of UBI – updated
26 Jan 2016 Leave a comment
in applied price theory, labour supply, law and economics, politics - New Zealand, poverty and inequality, public economics
One of the many drawbacks of the universal basic income is it will induce the recipients to cut back on their labour supply. There are studies of this labour supply effect through the study of what happens when people win the lottery – either the big one or a small prize.
Winning the lottery is the equivalent of winning an annuity equal to whatever annual income you can get it current low interest rates and share market returns.
A surprisingly number of people on the Left who deny that taxes have significant labour supply effects will nonetheless accept that winning the lottery will induce people to quit work permanently or cut back at least. The most likely reason is they buy lottery tickets too.
A study has just come out on the labour supply effects of winning the Swedish lottery. The sample in this study was really big: several million Swedish lottery winners.
Sweden seems to be like the USA in that both are awash with interesting economic data to the many other countries do not collect. Moreover, they were able to study these Swedish lottery winners over a 5 to 10-year period. Labour supply detail at that level is like going to heaven for an empirical labour economists.
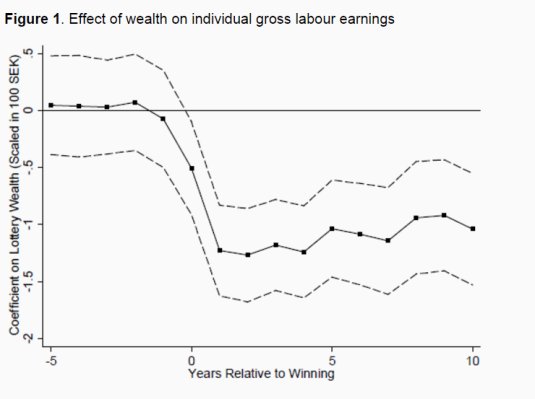
Source: Labour supply responses of lottery winners | VOX, CEPR’s Policy Portal.
The researchers found that in common with a previous study of the labour supply of lottery winners after their win that there were
modest reductions in labour earnings suggesting every dollar of universal basic income would reduce labour earnings by roughly $0.11.
The new research also found productivity losses of $1.40 for every hundred dollars of lottery winnings and that the partners of the lottery winners cut back on their labour suppliers well. No surprise there. Taking all these labour supply effects into account, our researchers concluded that:
every dollar won in a lottery reduces lifetime after-tax labour earnings of winners by $0.10-$0.20.
All in all, the universal basic income will be a negative productivity shock built on a negative productivity shock. First of all, there is the great big new tax to fund the universal basic income. Then the recipients of the basic income will cut back on their labour supply further compounding the massive social costs of the universal basic income.
A universal basic income is a bad idea from start to finish and that is before you consider the many advantages of encouraging people to work for their living. Working for your living is a central expectation of adult life.
UPDATE: what is the magnitude of this labour supply drop from universal basic income? The usual labour supply effect of a recession as recently summarised by Richard Rogerson is as follows:
Consider by way of comparison the labour market fluctuations associated with the business cycle. Going from normal times to a fairly severe recession is usually associated with a drop in total hours worked of about 3 percent.
A universal basic income will push the New Zealand economy into recession off the back of labour supply effect from the windfall increase in incomes alone. That is before you consider the massive productivity shock pushing the economy down further through a massive increase in the taxation of capital, which is the most inefficient form of taxation.
There is plenty of evidence of downward nominal wage flexibility
24 Jan 2016 1 Comment
in applied price theory, business cycles, macroeconomics, unemployment
Elsby, Shin and Solon (2016) have published a paper throwing a spanner in the works for business cycle theories premised on downward wage rigidity:
We devote particular attention to the hypothesis that downward nominal wage rigidity plays an important role in cyclical employment and unemployment fluctuations. We conclude that downward wage rigidity may be less binding and have lesser allocative consequences than is often supposed.
Keynesian macroeconomics is premised on downward wage rigidity. There is mass unemployment during recessions because employers are unwilling or unable to cut wages.
Elsby, Shin and Solon (2016) found that a non-trivial fraction of workers report nominal wage reductions: at least 10% of hourly workers and 20% of non-hourly workers. This fraction of workers whose nominal wage has been cut has been increasing since 1980 as shown in the chart below. The remaining workers either experienced a nominal wage freeze or a nominal wage increase in that year.
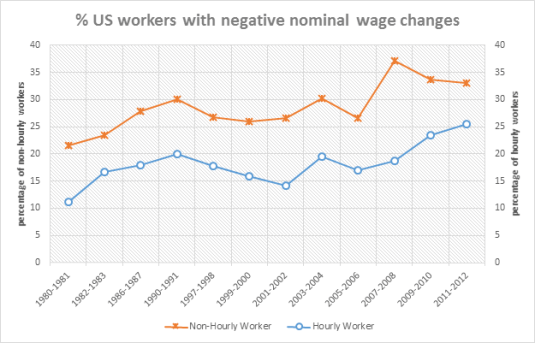
“What can wages and employment tell us about the UK’s productivity puzzle?” by Richard Blundell, Claire Crawford and Wenchao Jin found that in the recent British recession, 12% of employees in the same job as 12 months ago experienced wage freezes and 21% of workers in the same job as 12 months ago experienced wage cuts.
These results from the USA and UK come as no surprise to me because I have been on a collective employment agreement where after a restructuring, my pay was cut. The alternative was to leave and not receive a redundancy payment.
Chris Pissarides(2009), The Unemployment Volatility Puzzle: Is Wage Stickiness the Answer?, Econometrica argued the wage stickiness is not the answer to explaining unemployment since wages in new job matches are highly flexible:
1. wages of job changers are always substantially more procyclical than the wages of job stayers.
2. the wages of job stayers, and even of those who remain in the same job with the same employer are still mildly procyclical.
3. there is more procyclicality in the wages of stayers in Europe than in the United States.
4. The procyclicality of job stayers’ wages is sometimes due to bonuses, and overtime pay but it still reflects a rise in the hourly cost of labor
to the firm in cyclical peaks
I have been on several individual and collective agreements that grandfathered pay and conditions for existing workers and paid recruits less. I have lost count of the number of retirement pension scheme closed to new employees since I first encountered this cost saving practice at my first lecture at University.
My commercial law lecturer was explaining that he was lecturing part-time. His main job dealing with the litigation that might arise out of closing of the University retirement pension scheme. Some top-class academics had to retire earlier than they planned because of this closure to avoid a reduction in their pensions.
Most of my friends in the private sector are on bonus schemes were the great majority of the bonus is based on company profitability. Indeed, I know one company where everyone from the CEO down loses their bonus if there is a fatal workplace accident.
How can downward wage rigidity be a scientific hypothesis if the extensive international evidence of widespread nominal wage cuts wage cuts since the 1980s and 40%+ of the workforce on performance bonuses is not enough to refute it?
The same edition of the Journal of Labour Economics had a paper by Edward Lazear about how workplace effort varies with the business cycle and employment conditions:
…it seems that employers push their employees harder during recessions as they cut back the work force and ask each of the remaining workers to cover the tasks previously performed by the now-laid-off workers.
A number of models of long-term contracting in the labour market suggest that the level of employee effort expected varies with peak loads and general labour market conditions. That is understood from the start and is not is regarded as some form of opportunism by the employer after the contract is signed.
Likewise, employers do not lay off workers as soon as they become unprofitable in a downturn. If they did so, they would write off valuable firm specific human capital that might become profitable soon once the market recovers.
It is much easier to explain mass unemployment during a recessionas a a burst of layoffs at the beginning of the recession followed by the time it takes the unemployed to find suitable new vacancies and for employers to find it profitable to create such vacancies.
Some of these unemployed will simply wait for conditions to improve their existing industrial occupation so as to preserve their specialised human capital. These unemployed can be characterised as waiting unemployment or rest unemployment.
Other jobseekers will search further afield in new industries and occupations. These unemployed either have human capital that more general and mobile across many industries or have decided to scrap their industry specific and occupation specific human capital and try something else. The downturn in their current industry or occupation may be of sufficient duration that they regard waiting is a poor investment.
The economic concept of unemployment was rather primitive until Hutt write his hard to read theory of idle resources in 1939, Stigler’s paper in 1962 and the Phelps book in 1970.
I found Lucas and Prescott’s islands model to be an excellent explanation of unemployment. Lucas and Prescott’s economy is composed of a large number of scattered islands. Each of these islands is a one local labour market.
Workers in each of these islands have no precise knowledge of what wages will prevail in the economy outside of their own local labour market. Workers either remain on their island or leave it for what they expect to be a more alluring job further afield. Some workers are unemployed crossing between the islands, but they are nevertheless engaging in optimizing behaviour because they are looking for a better job than they have now.
Alchian (1969) lists three ways to adjust to unanticipated demand fluctuations:
• output adjustments;
• wage and price adjustments; and
• Inventories and queues (including reservations).
Alchian (1969) suggests that there is no reason for wage and price changes to be used regardless of the relative cost of these other options:
• The cost of output adjustment stems from the fact that marginal costs rise with output;
• The cost of price adjustment arises because uncertain prices and wages induce costly search by buyers and sellers seeking the best offer; and
• The third method of adjustment has holding and queuing costs.
There is a tendency for unpredicted price and wage changes to induce costly additional search. Long-term contracts including implicit contracts arise to share risks and curb opportunism over sunken investments in relationship-specific capital. These factors lead to queues, unemployment, spare capacity, layoffs, shortages, inventories and non-price rationing in conjunction with wage stability.
The most disruptive technology of the last century is in your house
23 Jan 2016 1 Comment
in discrimination, economic history, gender, labour economics Tags: engines of liberation


62 Billionaires alert: technology diffusion could have been so much faster but for their profit-taking
23 Jan 2016 Leave a comment
in economic history, entrepreneurship, poverty and inequality Tags: superstars, The Great Escape, The Great Fact
The long-run evolution of gender gaps
23 Jan 2016 Leave a comment
in discrimination, economic history, gender, labour economics Tags: gender wage gap
#Wages are the #prices of #labor, and what happens when prices rise?
23 Jan 2016 Leave a comment
in labour economics, minimum wage Tags: living wage
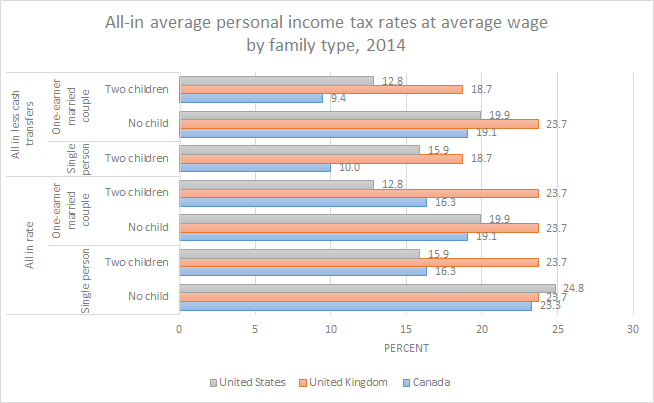
US, UK and Canadian all-in average personal income tax rates at average wage by family type
22 Jan 2016 Leave a comment
in labour economics, labour supply, politics - USA, public economics Tags: British economy, Canada, earned income tax credits, family tax credits, family taxation, taxation and labour supply
@greencatherine @cjsbishop zero US, UK & Swiss gender pay gaps for single women
22 Jan 2016 Leave a comment
in discrimination, economics of love and marriage, gender, human capital, labour economics, occupational choice, politics - New Zealand Tags: asymmetric marriage premium, family wage gap, gender wage gap
If victory is a zero gender wage gap, some countries have achieved it already for single female workers and long ago according to the data charted below is from the Luxembourg Income Study.
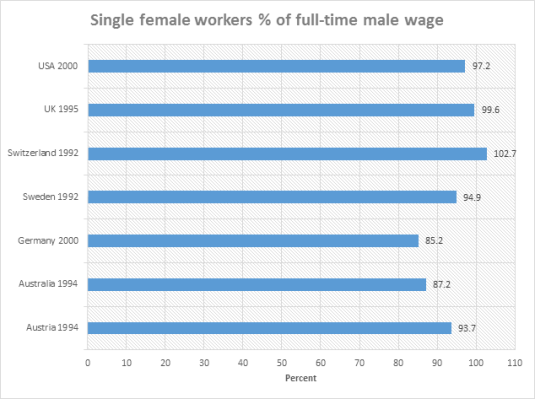
Source: IZA World of Labor – Equal pay legislation and the gender wage gap from the Luxembourg Income Study.
Discrimination cannot explain why the gender wage gap for single female is tiny relative to the family wage gap. As Solomon Polachek explains:
…the wage gap for married workers is between three and 30 times greater compared with single workers.
Employers cannot be to blame for the large difference between the single female worker gender wage gap and the family wage gap.
Aside from explaining why employers only discriminate against married women, you must explain how employers managed to find out which female applicants are married so they can discriminate against them.
Without that vital information on the marital status of female applicants and the presence and number of children as well is their spacing, the vast male chauvinistic conspiracy responsible for the glass ceiling and the sticky floors against promotion does not get off the ground.
How do employers actually pay married women less? Advertising jobs that pay women less has been unlawful for decades. Yet another hurdle to overcome for the vast male chauvinistic conspiracy.
Women move between the large number of jobs as do men accumulating human capital as they go? Somehow employers, including female owned firms, must sabotage the accumulation of human capital by married women as soon as they have children but without paying them lessen in their current jobs or advertising jobs that pay married women less.
The main drivers of the gender wage gap are unknown to employers such as:
- whether the would-be female recruit or employee is married,
- whether their partner is present,
- how many children they have,
- how many of children are under 12, and
- how many years are there between the births of their children.
These are the main drivers of the gender wage gap – all of which are factors totally unknown to employers and of no relevance to them in making a profit.
Most explanations of the gender wage gap centre around human capital. In anticipation of time outside of the workforce for motherhood, women self-selecting to occupations that penalise career interruptions less.
Women invest in human capital that is more general, human capital that is more mobile between jobs and into spells of part-time work. Women anticipate home time after they have children so they invest in human capital that depreciations at a slower rate during career interruptions. Women also invest less overall in new capital because they expect to spend less time in the labour market.
All of these investments are made by women themselves in anticipation of motherboard rather than employers somehow paying them less after they marry and have children.
The solution to closing the family wage gap requires radical biological changes in who has children. There are more radical changes required than this because mothers actually like babies and enjoy spending time with them rather than going to work.
Equally challenging is the required changes in the dating market. There is an average age difference between boyfriends and girlfriends and husbands and wives of 2 to 3 years. As the husband or boyfriend is a few years older, he has usually accumulated more human capital and is more likely to be at a critical career point for promotion.

Because the husband or boyfriend is 2 to 3 years older, it pays off well in terms of the father investing more in market-related human capital and the mother devoting more time to childcare.
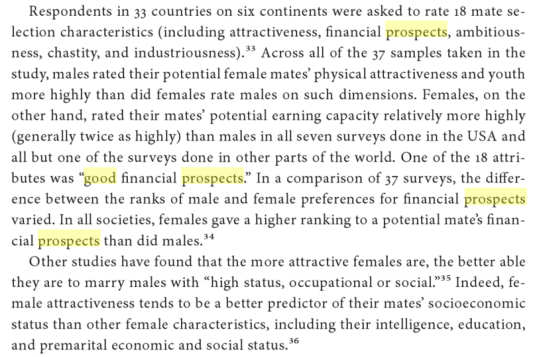
Another major driver of the gender pay gap is the dating market as identified by Richard McKenzie. He pointed out that evolutionary psychology has found that in every culture one of the factors of influencing pairing off in the dating market is that the boyfriend or husband must have good prospects although this preference is weakening over this last century.
One of the reasons for the increase in single parents is that low-paid men are not as inviting prospects as long-term boyfriends or husbands is a few generations ago. There are too few good men.
University educated couples are not called power couples for nothing – their earning power is this stunning compared to going it on your own. The emergence of power couples means that less educated women may prefer to stay single and raise children on their own rather than marry what is left in the marriage pool.
Because of the requirement among women across all cultures that husbands to be must have good prospects, men have an extra incentive to invest in human capital and work harder and longer hours because of the gender specific payoff in the marriage market.
Men will also take more risks than women because risky jobs carry wage premiums. That risk premium is topped up in the mating market terms are marriage prospects because of the higher wages. Women get a wage premium for taking risky jobs but less of a payoff in the mating market for the higher wages. There is an evolutionary psychology explanation for the family wage gap.

All in all, a key requirement for the closing of the family wage gap and what little is left of the gender wage gap is women drop their standards in terms of who they choose as boyfriends and husbands. Not very likely.

Why @garethmorgannz wants his great big new tax @geoffsimmonz
21 Jan 2016 Leave a comment
in economic growth, fiscal policy, labour economics, labour supply, macroeconomics, politics - New Zealand, public economics Tags: Gareth Morgan, optimal tax theory, taxation of capital
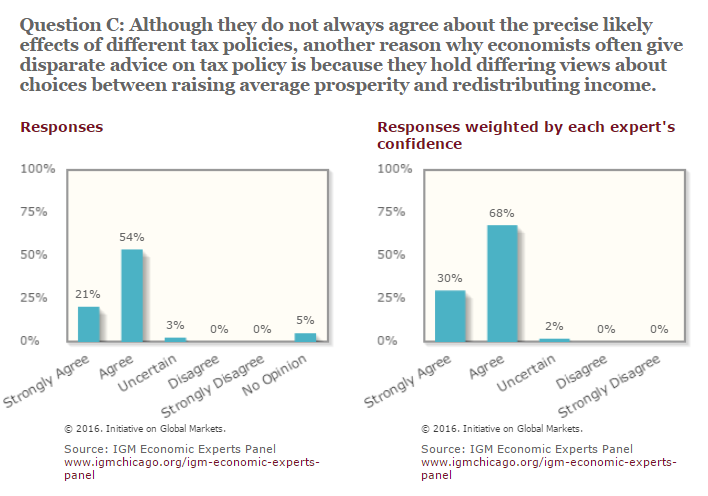
Source: Poll Results | IGM Forum.
The #livingwage in Washington, DC
21 Jan 2016 Leave a comment
in applied price theory, applied welfare economics, labour economics, minimum wage, politics - New Zealand, politics - USA Tags: expressive loading, living wage, rational irrationality
What percentage of mothers with a child aged 0-2 yrs have a paid job
20 Jan 2016 Leave a comment
in gender, labour economics, labour supply Tags: economics of fertility, female labour force dissipation, maternal labour force participation, single mothers
@FairnessNZ shows how everything is getting better in NZ @FIRST_Union
20 Jan 2016 Leave a comment
in applied welfare economics, economic history, labour economics, politics - New Zealand, poverty and inequality Tags: Employment Contracts Act, employment law, Leftover Left, rational ignorance, rational irrationality, top 1%, union power, Withering away of the proletariat
The union movement posted two excellent charts during the last election showing how well things have gone since the 1980s economic reforms and their consolidation in the early 1990s.
The charts show that real wage growth returned in the early 1990s after the passage of the Employment Contracts Act and the consolidation of government finances. This was after two decades of wage stagnation in what the unions regards as the good old days.
Furthermore, as the union chart shows, the average incomes of the top 1% in New Zealand is a pretty stable for several decades. Whatever else is happening New Zealand, you cannot blame it on the top 1% because they are lazy. What increase there was in average top incomes in New Zealand was followed by the return of real wage growth in New Zealand and a long economic boom where the unemployment rate drop below 3.5%
The main bugbear is housing affordability which is a result of the Resource Management Act passed in 1993 as the union chart shows. The unions, the Labour Party and Greens all support the laws that result in this housing unaffordability.
Child poverty is twice 30 years ago? @GarethMorgan @povertymonitor @geoffsimmonz
19 Jan 2016 Leave a comment
in applied welfare economics, economic history, politics - New Zealand, poverty and inequality, technological progress
#moreinclusivenz @povertymonitor Killer graphs & #infographics by NZ Children's Commissioner. Shameful content, NZ http://t.co/mG987C5kh0—
Isabella Cawthorn (@fixiebelle) July 26, 2015
37% of kids in poverty in working homes. 47% of kids in poverty in two-parent homes. #mythbusting #itsnotchoice https://t.co/1V9PLw9r9G—
Child Poverty NZ (@povertymonitor) December 16, 2015


Recent Comments