The Trouble w Boys: U Chicago study: boys fr non-intact homes esp likely to struggle in school nber.org/papers/w17541 http://t.co/31xyA4BVQH—
W Bradford Wilcox (@WilcoxNMP) June 18, 2015
The trouble with boys
31 Aug 2015 1 Comment
in applied welfare economics, labour economics, politics - Australia, politics - New Zealand, politics - USA, welfare reform Tags: economics of the family, lost boys, reversing gender gap, single mothers, single parents
Taken before helicopter parenting
30 Aug 2015 Leave a comment
in economic history, economics of media and culture, health and safety Tags: helicopter parenting
Low numeracy skills across the OECD
30 Aug 2015 Leave a comment
in economics of education, human capital, labour economics, labour supply, occupational choice Tags: literacy and numeracy, PISA, reading and writing

US income distribution
29 Aug 2015 Leave a comment
in applied welfare economics, income redistribution, labour economics, politics - USA, poverty and inequality Tags: top 1%
The incomes of the bottom 99%
28 Aug 2015 Leave a comment
in applied welfare economics, politics - USA, poverty and inequality, Public Choice Tags: top 1%
Did Mass Incarceration Destroy the Black Family?
28 Aug 2015 Leave a comment
in discrimination, economics of crime, economics of love and marriage, labour economics, law and economics, politics - New Zealand, population economics, poverty and inequality, unemployment, urban economics, welfare reform Tags: crime and punishment, criminal deterrence, economics of the family, racial discrimination, single mothers, single parents, teen pregnancies
Did Mass Incarceration Destroy the Black Family? Not exactly. bit.ly/1f8jgXm http://t.co/1q2nKJnU9W—
City Journal (@CityJournal) August 13, 2015
The Chinese demographic crisis is now
26 Aug 2015 Leave a comment
in development economics, economic history, growth disasters, growth miracles, labour economics, labour supply, population economics Tags: ageing society, China, demographic crisis, older workers
China's massive economic advantage over the world is about to disappear read.bi/1MkYx1p http://t.co/Fw9zmMTuVx—
BI Markets (@themoneygame) August 11, 2015
Should backyard swimming pools be banned?
26 Aug 2015 Leave a comment
in applied price theory, economics of crime, economics of regulation, health and safety, law and economics, politics - USA, property rights Tags: gun control, meddlesome preferences, nanny state, risk risk trade-offs
Do the @NZGreens care about the fuel poverty consequences of carbon taxes?
24 Aug 2015 Leave a comment
in energy economics, environmental economics, global warming, politics - Australia, politics - New Zealand, politics - USA, poverty and inequality Tags: carbon tax, climate alarmism, expressive voting, fuel poverty, global warming
Who is harmed the most from higher energy costs? The poor, who spend almost 25% of their disposable income on energy? http://t.co/YOn28COXy8—
Mark J. Perry (@Mark_J_Perry) June 22, 2015
Marginal tax rates of 2-income couples with 2 children in USA, UK, Australia and New Zealand since 2000
23 Aug 2015 Leave a comment
in economic history, economics of love and marriage, labour economics, labour supply, politics - Australia, politics - New Zealand, politics - USA, public economics Tags: Australia taxation and labour supply, British economy, marriage and divorce
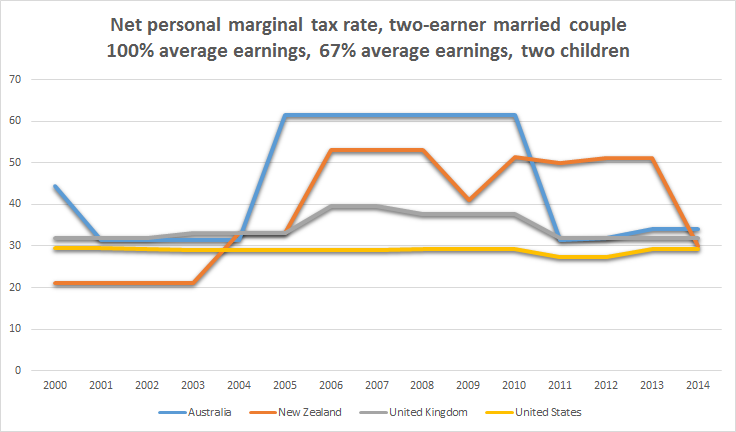
Source: OECD StatExtract.
Who profits from #climatechange alarmism #COP21 and #roadtoparis
23 Aug 2015 Leave a comment
in applied price theory, environmental economics, environmentalism, global warming, labour economics, occupational choice, personnel economics, Public Choice, rentseeking Tags: bribery and corruption, conjecture and refutation, consultants, green hypocrisy, green rent seeking, Left-wing hypocrisy, public intellectuals
https://twitter.com/RogerAPielkeSr/status/627888796562927616/photo/1
A schematic of climate system from nap.edu/openbook.php?r… Changes are much more than changes in CO2 concentrations http://t.co/g8gs44UnN8—
Roger A. Pielke Sr (@RogerAPielkeSr) August 05, 2015
Marginal tax rates of a nuclear family in USA, UK, Australia and New Zealand since 2000
22 Aug 2015 Leave a comment
in economic history, economics of love and marriage, labour economics, labour supply, politics - Australia, politics - New Zealand, politics - USA Tags: Australia, British economy, marriage and divorce, taxation and labour supply
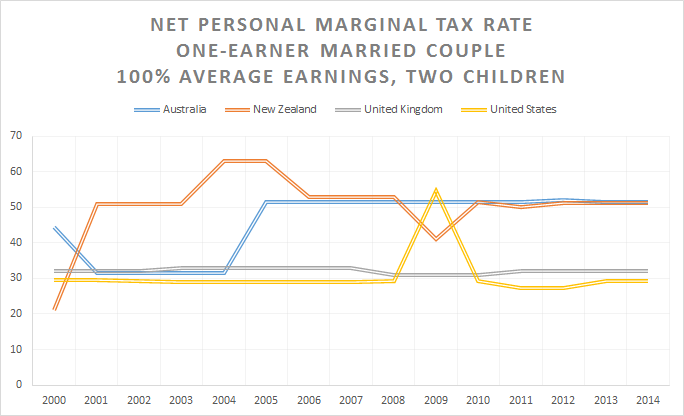
Source: OECD StatExtract.
When do rising incomes increase child poverty?
22 Aug 2015 2 Comments
in economic history, labour economics, politics - New Zealand, poverty and inequality, welfare reform Tags: child poverty, family poverty, Leftover Left, measurement error, New Zealand Greens
Summary of the 222 pages of MSD's Household Incomes report: kids are still missing out BIG time. #itsnotchoice http://t.co/4x7dm1O0Wg—
Child Poverty NZ (@povertymonitor) August 13, 2015
AHC = after deducting housing costs
BHC = before deducting housing costs
‘anchored line’:
- this is the line set at a chosen level in a reference year (now 2007), and held fixed in real terms (CPI adjusted)
- the concept of ‘poverty’ here is – have the incomes of low-income households gone up or down in real terms compared with what they were previously?
‘moving line’:
- this is the fully relative line that moves when the median moves (e.g. if median rises, the poverty line rises and reported poverty rates increase even if low incomes stay the same)
- the concept of ‘poverty’ here is – have the incomes of low-income households moved closer or further away from the median?
Bryan Perry, Household Incomes in New Zealand: trends in indicators of inequality and hardship 1982 to 2014 – Ministry of Social Development, Wellington (August 2015), p. 133.
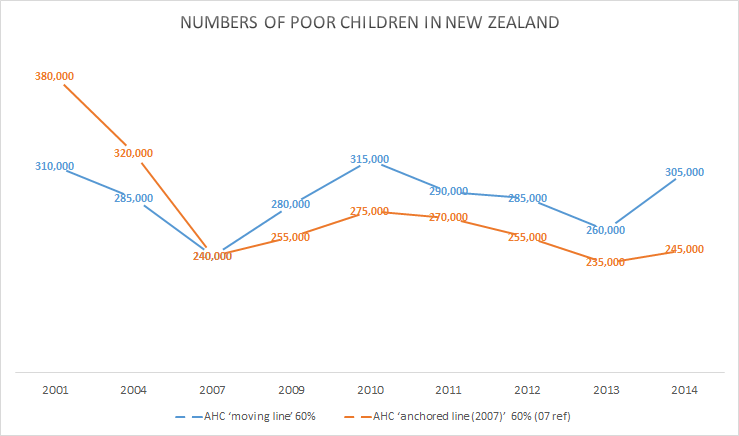
Source: Bryan Perry, Household Incomes in New Zealand: trends in indicators of inequality and hardship 1982 to 2014 – Ministry of Social Development, Wellington (August 2015), p. 133.
Is child poverty in New Zealand 245,000 children or 305,000 children?
260,000 kids in income poverty, 180,000 in material hardship, 10% in severe poverty, 3in5 in poverty for a long time http://t.co/Oy5cWftvwU—
Child Poverty NZ (@povertymonitor) May 21, 2015
If you base your estimate of child poverty on the 60% of median income after housing costs moving line, which is the number of low income households who moved further away from 60% of median income, a median which increased by 5% last year, the figure is 305,000 children after housing costs. 45,000 children are in households that is not as close to the median as last year but are not necessarily any poorer than last year in terms of money coming into the house.
45k more children in #poverty this year than last, that’s 305k Kiwi kids without life's basics. C'mon @johnkeypm! http://t.co/K8zeQpgA79—
UNICEF New Zealand (@UNICEFNZ) August 13, 2015
If you base your estimate on the anchored line, which is the number of low income households whose income has gone up on down compared to what they were on previously,the number of children in poverty has increased from 235,000 to 245,000 after housing costs. About 10,000 children are poorer than last year – poorer enough than last year to be classified as in poverty.

Poverty in America
22 Aug 2015 Leave a comment
in economic history, labour economics, politics - USA, poverty and inequality, welfare reform Tags: 1996 U.S. welfare reforms, child poverty, family poverty
Half as many blacks in the U.S. today are living in poverty as in 1960. buff.ly/1KTT5Sz http://t.co/PKK5REXr0P—
HumanProgress.org (@humanprogress) August 07, 2015
@NZGreens @TransportBlog cars rule in Auckland! Auckland commuting times by transport mode
21 Aug 2015 1 Comment
in job search and matching, labour economics, occupational choice, politics - New Zealand, transport economics, urban economics Tags: Auckland, bicycles, commuting times, compensating differentials, expressive voting, green rent seeking, Inner-city Left, New Zealand Greens, public transport, rational irrationality, search and matching, The fatal conceit, The pretense to knowledge
I am not surprised only 7% of Auckland’s take public transport to work considering it takes much longer than any other form of commuting.
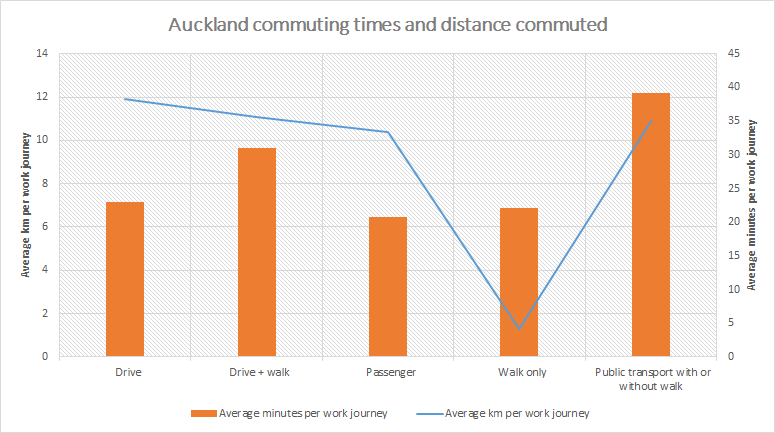
The average commute by public transport is 40 minutes as compared to less than 25 in a car. 74% of Aucklanders drive to work and another 9% are a passenger in a car.
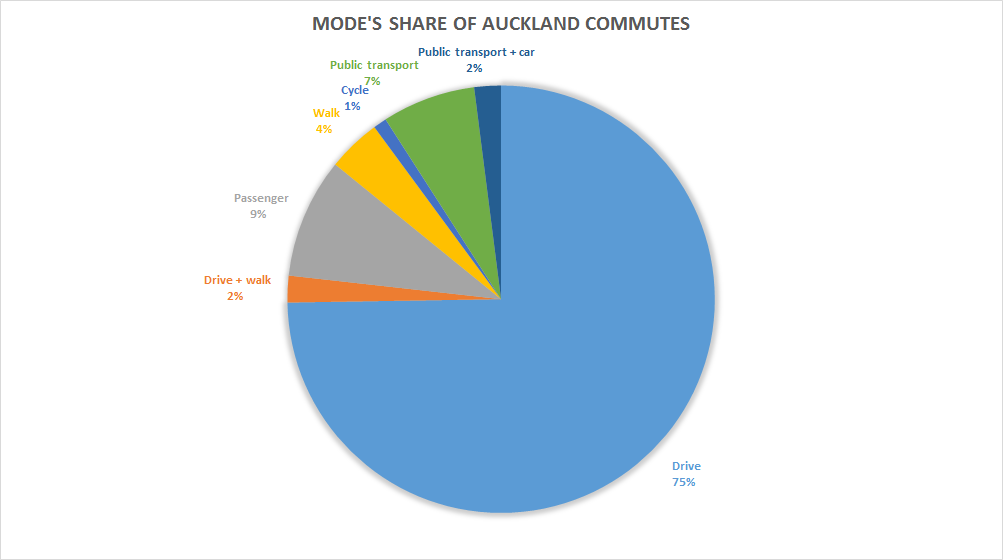
No information was available on those who bike to work because only 1% of Aucklanders bike to work. Only 2% of all New Zealanders take a bike to work. The sample size was therefore too small. Yet another reason to ban bikes at night. Few commute on this mode of transport in Auckland.
The near identical commuting distances irrespective of the mode of transport except walking is further evidence that people are quite discerning in balancing commuting times and job selection as per the theory of compensating differentials. Indeed, average commuting times in Auckland are much the same as the average commuting time in America.

The Auckland transport data showing people commute much the same distance by any mode of transport bar walking also validates Anthony Downs’ theory of triple convergence.

Improving the commuting times in one mode of transport will mean people simply take the mode of peak hour transport that is suddenly become less congested while others who were not going to commute at peak times or start commuting at peak times as Anthony Downs explains:
If that expressway’s capacity were doubled overnight, the next day’s traffic would flow rapidly because the same number of drivers would have twice as much road space.
But soon word would spread that this particular highway was no longer congested. Drivers who had once used that road before and after the peak hour to avoid congestion would shift back into the peak period. Other drivers who had been using alternative routes would shift onto this more convenient expressway. Even some commuters who had been using the subway or trains would start driving on this road during peak periods.
Within a short time, this triple convergence onto the expanded road during peak hours would make the road as congested as it was before its expansion.


Recent Comments