
Source: General government – General government spending – OECD Data and Source: General government – General government revenue – OECD Data.
Celebrating humanity's flourishing through the spread of capitalism and the rule of law
12 Mar 2016 Leave a comment
in budget deficits, economic history, fiscal policy, politics - USA, public economics Tags: growth of government, size of government
Source: General government – General government spending – OECD Data and Source: General government – General government revenue – OECD Data.
11 Mar 2016 Leave a comment
in history of economic thought, macroeconomics, Milton Friedman, monetary economics Tags: monetary rules, rules versus discretion
Peter Lyons teaches Economics at St Peter’s College in Epsom and has written several economics texts.
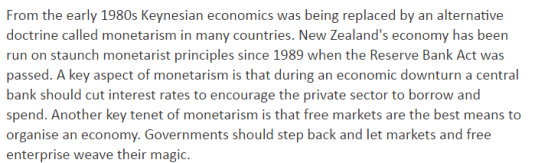
Source: Peter Lyons: Free market doctrine’s bubble about to burst – Economy – NZ Herald News.


Source: Milton Friedman (1984).
10 Mar 2016 Leave a comment
in economic history, job search and matching, labour economics, labour supply, macroeconomics, unemployment

Source: How Sweden’s Unemployment Became More Like Europe’s, Lars Ljungqvist, Thomas J. Sargent 2010.
09 Mar 2016 Leave a comment
in economic growth, economic history, politics - New Zealand, unions
Bill Rosenberg of the Council of Trade Unions is one of many economists who point out that income inequality has not been getting worse and worse in New Zealand since the 1990s. Inequality rose sharply in the late 1980s and early 90s but has remained high but nevertheless stable since then as he says in his 2014 paper of trends in living standards:
This is another symptom of the sharp rise in income inequality between the mid 1980s and mid 1990s, which remains high.
His employer, the Council of Trade Unions when it was denouncing the Employment Contracts Act 1991 as the reason for low wages growth has also drawn attention to the early 1990s as a turning point in the relationship between inequality, union bargaining power and wages growth.
As the Council of Trade Unions showed in the chart it published during the last election campaign, which I snapshoted below and also annotated, from 1970 to 1975 there was rapid real wages growth, well in excess of real growth in per capita GDP. This wages breakout was followed by some ups and downs but essentially wages in 1995 were no higher per hour from what they were in 1975. Real wages were about $24 per hour in real terms in New Zealand for about 20 years – from 1975 to 1995.
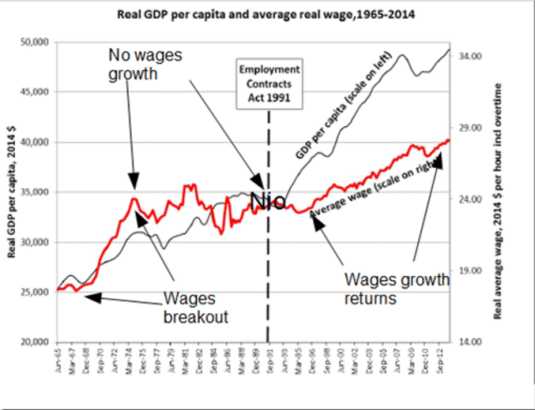
There was no real GDP per capita growth from 1975 until 1979 nor in the five years leading up to the passage of the Employment Contracts Act 1991. The period leading up to 1975 wages breakout wages was the zenith of union membership; nearly 70% of all workers belonging to a union. Less than 20% do now and less than 10% in the private sector.
Source: Income Gap | New Zealand Council of Trade Unions – Te Kauae Kaimahi.
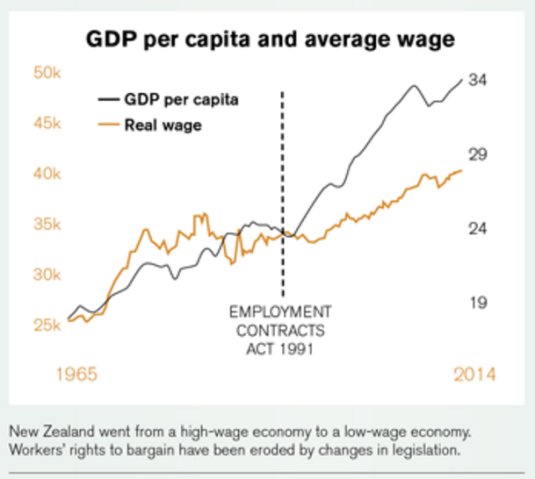
After staying at about $24 per hour for 20 years from 1975 to the early 1990s, following the passage of the Employment Contracts Act in 1991, average wages in New Zealand have increased steadily from $24 an hour to about $28 per hour by 2014 in one of the most deregulated labour markets in the world.
As Rosenberg, who is chief economist at the Council of Trade Unions, and the Council of Trade Unions itself pointed out, there were major changes in the New Zealand economy in terms of inequality of incomes and union bargaining power in the late 80s and early 1990s.
These changes referred to by the unions as an erosion of workers bargaining power, brought an end to wage stagnation. Steady real wages growth returned after two lost decades: next to no growth in either GDP per capita or incomes of workers.
06 Mar 2016 Leave a comment
in applied price theory, economic growth, fiscal policy, macroeconomics, politics - USA, public economics Tags: 2016 presidential election, taxation and entrepreneurship, taxation and investment, taxation and labour supply
[/embed]https://www.facebook.com/UnbiasedAmerica/photos/pb.123061011213236.-2207520000.1457089554./449398021912865/?type=3&theater[/embed]
05 Mar 2016 Leave a comment
in economics of love and marriage, fiscal policy, gender, labour economics, labour supply, law and economics, politics - Australia, politics - New Zealand, politics - USA, public economics Tags: Australia, British economy, Canada, Denmark, effective marginal tax rates, family tax benefits, family tax credits, France, Germany, in-work tax credits, Italy, poverty traps, rational irrationality, social insurance, Sweden, taxation and labour supply
Some countries including New Zealand and Australia do not give ordinary families much of an incentive to earn more. Effective marginal tax rates on low income families is one of the few times that the Left discovers supply-side economics.

Source: Taxing Wages 2015 – OECD 2015.
05 Mar 2016 Leave a comment
in fiscal policy, politics - Australia, politics - New Zealand, politics - USA, public economics Tags: Australia, British economy, Canada, Denmark, family taxation, France, Germany, Italy, social insurance, Sweden, taxation and labour supply
Those sensitive and caring northern European welfare states do tax families rather heavily even after accounting for family cash benefits.

Source: Taxing Wages 2015 – OECD 2015.
04 Mar 2016 Leave a comment
in fiscal policy, politics - Australia, politics - New Zealand, politics - USA, public economics Tags: Australia, British economy, Canada, Denmark, France, Germany, Italy, social insurance, Social Security, Sweden, taxation and labour supply
Those much admired northern European welfare states tax families and individuals much more than do the Anglo-Saxon welfare states.

Source: Taxing Wages 2015 – OECD 2015.
04 Mar 2016 Leave a comment
in fiscal policy, politics - Australia, politics - New Zealand, politics - USA, public economics Tags: Australia, British economy, Canada, Denmark, Germany, Italy, social insurance, Social Security, Sweden, taxation and labour supply

Source: Taxing Wages 2015 – OECD 2015.
03 Mar 2016 Leave a comment
in fiscal policy, public economics Tags: Australia, British economy, Canada, Denmark, Germany, Italy, social insurance, Social Security, Sweden, taxation and labour supply
03 Mar 2016 Leave a comment
in business cycles, Euro crisis, global financial crisis (GFC), macroeconomics
28 Feb 2016 Leave a comment
in economic history, fiscal policy, macroeconomics, politics - USA, public economics Tags: British economy, Canada, growth of government, Margaret Thatcher, size of government, Thatchernomics, Tony Blair
Both the British and Canadian economies experienced major winding backs in the size of government. Only the UK, under neoliberal pawn and closet Thatcherite Tony Blair, was that undone. He is now despised by many Labour Party members including its current leader for this record.

Data extracted on 23 Feb 2016 07:45 UTC (GMT) from OECD.Stat.
28 Feb 2016 Leave a comment
in applied price theory, fiscal policy, labour economics, labour supply, politics - Australia, politics - New Zealand, politics - USA, poverty and inequality, public economics, welfare reform Tags: poverty traps, single mothers, single parents, social insurance, taxation and labour supply, welfare state
24 Feb 2016 Leave a comment
in economic history, macroeconomics, public economics
Notice that the welfare states in Scandinavia were recent creations subsequent to post-war prosperity.
Data extracted on 23 Feb 2016 07:45 UTC (GMT) from OECD.Stat.
24 Feb 2016 Leave a comment
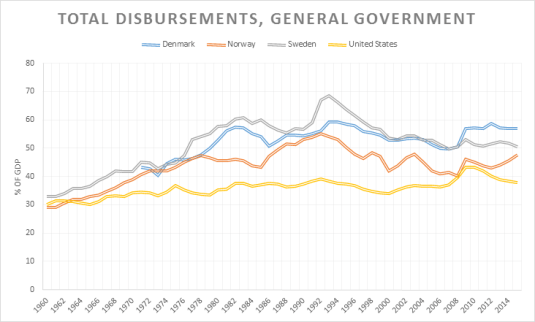
in economic growth, economic history, Euro crisis, fiscal policy, macroeconomics, public economics Tags: Greece, growth of government, Italy, Portugal, size of government, Spain
I do not think any of these countries have governments who can really handle managing half of national income on a regular basis. The Italian, and I assume Greek GDPs at least are topped up quite considerably to take account of their underground economies. The top up for Italy is 20%.

Data extracted on 23 Feb 2016 07:45 UTC (GMT) from OECD.Stat.
Celebrating humanity's flourishing through the spread of capitalism and the rule of law
A History of the Alt-Right
Econ Prof at George Mason University, Economic Historian, Québécois
Celebrating humanity's flourishing through the spread of capitalism and the rule of law
Scholarly commentary on law, economics, and more
Beatrice Cherrier's blog
Celebrating humanity's flourishing through the spread of capitalism and the rule of law
Celebrating humanity's flourishing through the spread of capitalism and the rule of law
Celebrating humanity's flourishing through the spread of capitalism and the rule of law
Why Evolution is True is a blog written by Jerry Coyne, centered on evolution and biology but also dealing with diverse topics like politics, culture, and cats.
Celebrating humanity's flourishing through the spread of capitalism and the rule of law
A rural perspective with a blue tint by Ele Ludemann
DPF's Kiwiblog - Fomenting Happy Mischief since 2003
Celebrating humanity's flourishing through the spread of capitalism and the rule of law
The world's most viewed site on global warming and climate change
Tim Harding's writings on rationality, informal logic and skepticism
A window into Doc Freiberger's library
Let's examine hard decisions!
Commentary on monetary policy in the spirit of R. G. Hawtrey
Thoughts on public policy and the media
Celebrating humanity's flourishing through the spread of capitalism and the rule of law
Politics and the economy
A blog (primarily) on Canadian and Commonwealth political history and institutions
Reading between the lines, and underneath the hype.
Economics, and such stuff as dreams are made on
"The British constitution has always been puzzling, and always will be." --Queen Elizabeth II
Celebrating humanity's flourishing through the spread of capitalism and the rule of law
Celebrating humanity's flourishing through the spread of capitalism and the rule of law
WORLD WAR II, MUSIC, HISTORY, HOLOCAUST
Undisciplined scholar, recovering academic
Celebrating humanity's flourishing through the spread of capitalism and the rule of law
Res ipsa loquitur - The thing itself speaks
In Hume’s spirit, I will attempt to serve as an ambassador from my world of economics, and help in “finding topics of conversation fit for the entertainment of rational creatures.”
Researching the House of Commons, 1832-1868
Articles and research from the History of Parliament Trust
Reflections on books and art
Posts on the History of Law, Crime, and Justice
Celebrating humanity's flourishing through the spread of capitalism and the rule of law
Exploring the Monarchs of Europe
Cutting edge science you can dice with
Small Steps Toward A Much Better World
“We do not believe any group of men adequate enough or wise enough to operate without scrutiny or without criticism. We know that the only way to avoid error is to detect it, that the only way to detect it is to be free to inquire. We know that in secrecy error undetected will flourish and subvert”. - J Robert Oppenheimer.
The truth about the great wind power fraud - we're not here to debate the wind industry, we're here to destroy it.
Celebrating humanity's flourishing through the spread of capitalism and the rule of law
Celebrating humanity's flourishing through the spread of capitalism and the rule of law


Recent Comments