Hayek on Milton Friedman and Monetary Policy
25 Jun 2016 Leave a comment
in business cycles, economics, F.A. Hayek, macroeconomics, Milton Friedman, monetarism, monetary economics
@NZGreens @jamespeshaw forgot how much NZ’s deposit insurance recently cost taxpayers
22 Jun 2016 Leave a comment
in applied price theory, monetary economics, politics - New Zealand
The Greens co-leader James Shaw has today called for New Zealand to re-introduce deposit insurance saying that
“It would be a small levy placed on the banks, which would go into an insurance fund. It’s been operating successfully in many, many other countries.” But Mr Shaw said the Government and Reserve Bank keep putting off the change, saying customers can choose the bank they believe is most stable. “Consumers are not well educated about the stability of banks, so what that means is they tend to flow to the really big Australian-owned banks.”
Deposit insurance has a long history of promoting banking instability and irresponsible lending. It has not operated successfully in other countries nor in New Zealand. The Green Party announcement made no mention of New Zealand’s recent experience with deposit insurance
At the height of the global financial crisis and in the final days of the 2008 general election, New Zealand not only extended a deposit guarantee to its banks it also did so to finance companies. As the Auditor-General recorded in her recent report
On Sunday 12 October 2008, at the peak of the global financial crisis, the Government decided that it needed to implement a form of retail deposit guarantee scheme to avoid a flight of funds from New Zealand institutions to those in Australia. It needed to do this urgently: The Crown Retail Deposit Guarantee Scheme (the Scheme) was designed and announced that same day.
The deposit guarantee was extended to finance companies. Money flooded into previously high risk investments as investors had nothing to lose and everything to gain from the higher returns.
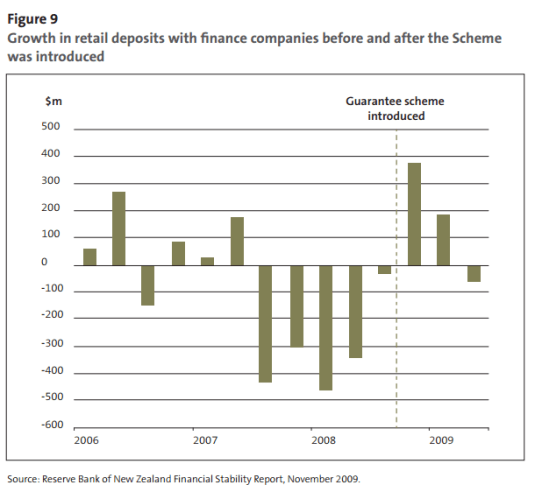
As the Auditor-General noted in a 2015 recent report reviewing the scheme
From the outset, the advice from officials recognised that the decision to include finance companies in the Scheme carried significant risk. Once deposits with these companies were guaranteed, depositors could safely move investments to where they would get the highest return, irrespective of the risk of company failure.
The finance companies also had less reason to minimise risk in their investment activity. The Crown was carrying much of this risk. During 2009, the Treasury watched some of that behaviour eventuate. Deposits with finance companies under the Scheme grew, in some instances significantly. We saw one example where a finance company’s deposits grew from $800,000 to $8.3 million after its deposits were guaranteed. At South Canterbury Finance Limited, the deposits grew by 25% after the guarantee was put in place.
The flood of deposits into finance company after the deposit guarantee somewhat undermines the low opinion the Greens have of depositors as investors sensitive to risk
On blunting incentives, otherwise known as ‘moral hazard’, Bill English can’t seriously expect everyday savers to analyse the loan books of banks to assess their credit risk when they open their accounts, let alone do this on a six-monthly basis.
At its height, the bank and finance company guarantees totalled over $133 billion. Ninety-six institutions were covered by the scheme – 60 non-bank deposit takers, 12 banks and 24 collective investment schemes. All guarantees had ended by December 2011.
To put context on the risk that the taxpayer, this $133 billion underwritten by the taxpayer return for little or no insurance fee was nearly twice the amount the Government spends in a year, or about 2/3rd of GDP.
If a financial institution in the Scheme failed, taxpayers would repay all of the money that eligible people had deposited or invested, up to a cap of $1 million each.
Nine finance companies out of the 30 accepted into the scheme failed. This resulted in payments by the taxpayer to the investors of $2 billion. Expected recoveries are currently estimated at about $0.9 billion after the completion of the various receiverships of these institutions according to the recent report on the scheme by the Auditor-General.
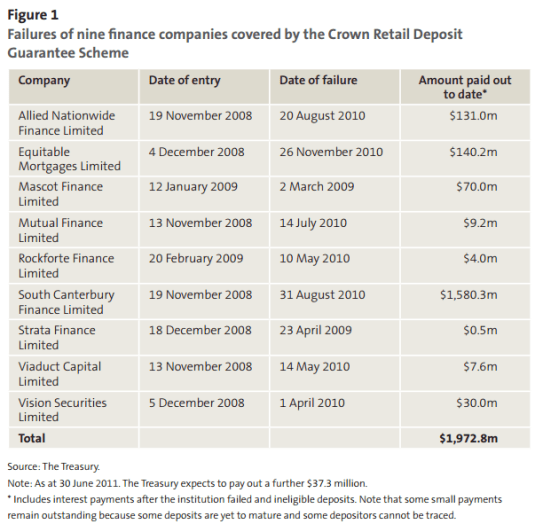
The deposit guarantee was extended to the finance companies despite 28 such companies failing between 2006 and 2008. This included some larger finance companies such as Bridgecorp Finance (New Zealand) Limited, Provincial Finance Limited, and Hanover Finance Limited.
FDR was initially opposed to deposit insurance in the USA in 1933 because it would encourage greater risk taking by banks. Sam Peltzman in the mid-1960s found that U.S. banks in the 1930s halved their capital ratios after the introduction of federal deposit insurance.
If you want to make banks safer, increase their capital ratios and require them to have more subordinated debt in their capital requirements.
Any form of deposit insurance requires extensive regulation of insured bank portfolios to prevent excessive risk-taking. The Kareken and Wallace model of deposit insurance which is based on moral hazard, predicts that if a government sets up deposit insurance and doesn’t regulate bank portfolios to prevent them from taking too much risk, the government is setting the stage for a financial crisis. The Kareken-Wallace model makes you very cautious about lender-of-last-resort facilities and very sensitive to the risk-taking activities of banks.
Kareken and Wallace called for much higher capital reserves for banks and more regulation to avoid future crises. It is much easier to require banks to put up more capital than to not take risks with the monies invested in them by depositors.
Hayek Lecture 2016: Price Stability and Financial Stability without Central Banks
19 Jun 2016 Leave a comment
in applied welfare economics, Austrian economics, comparative institutional analysis, macroeconomics, monetary economics Tags: free banking
@Noahpinion says 20% losing their jobs is a small price to pay in #fightfor15
14 Jun 2016 Leave a comment
in applied price theory, applied welfare economics, labour economics, minimum wage, Robert E. Lucas
https://twitter.com/EconBizFin/status/626687442834300928
Noah Smith is a type of friend that should make poor Americans prefer their republican enemies. At least they are not fanatics. Fanatics never give up. Evil people have other things to do with their dastardly days.
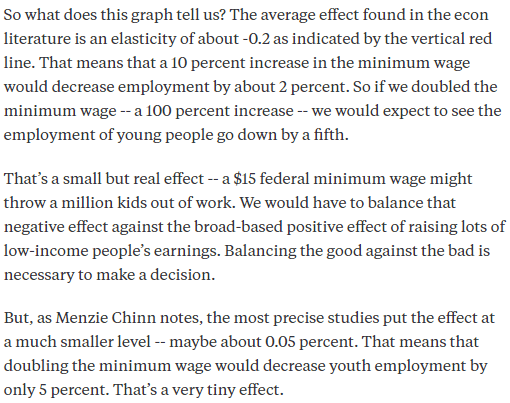
Source: A Higher Minimum Wage Won’t Lead to Armageddon – Bloomberg View.
Describing 1/5th of young people losing their jobs after a doubling of the federal minimum wage to $15 per hour as a small but real effect is a type of callousness that not even Donald Trump could stoop. What is Even Noah Smith admits that large minimum wage increases experiment with the fortunes of young people
We don’t really know what happens when you raise the minimum wage to $15 — but soon, we will know. We will be able to see whether employment rates fall in L.A., Seattle, and San Francisco.
We will be able to see whether people who can’t get work migrate from these cities to cities with lower minimum wages. We will be able to see if employment growth suddenly slows after the enactment of the policy. In other words, federalism will do its job, by allowing cities to act as policy laboratories for the rest of the country.
These one million young people who may well lose their jobs under a $15 minimum wage are real living people starting out their work in lives in a country with a rather inadequate unemployment benefits especially for the long-term unemployed.
Noah Smith wants to throw them onto the scrapheap through a large increase in the minimum wage because he is too cheap to support a large increase in the earned income tax credit.
If doubling the minimum wage to throw 20% of the workforce out of a job passes the brutal utilitarian calculus of bleeding-heart progressives, why not double everybody’s wages? Show the strength of your conviction about these Kruger–Card minimum wage results which repeal the laws of supply and demand.
https://twitter.com/AlvaroLaParra/status/738776906988822528
The leading reason for empirical research and economic history is to warns us not to repeat the mistakes of the past and not try experiments that are obvious folly. People and the economy should not be used as lab rats as Lucas explains in his short speech “What Economists Do”
I want to understand the connection between the money supply and economic depressions.
One way to demonstrate that I understand this connection–I think the only really convincing way–would be for me to engineer a depression in the United States by manipulating the U.S. money supply.
I think I know how to do this, though I’m not absolutely sure, but a real virtue of the democratic system is that we do not look kindly on people who want to use our lives as a laboratory. So I will try to make my depression somewhere else.
Tom Sargent on Macroeconomic Theory and the Crisis
12 Jun 2016 Leave a comment
in business cycles, currency unions, economics, Euro crisis, fiscal policy, global financial crisis (GFC), great recession, macroeconomics, monetary economics Tags: Tom Sargent
A Life Cycle Model of Trans-Atlantic Employment Experiences | Tom Sargent
11 Jun 2016 Leave a comment
in labour economics, macroeconomics Tags: Tom Sargent
US tax rates before and after government transfers
11 Jun 2016 Leave a comment
in fiscal policy, politics - USA, public economics

why no protests against #UBI bureaucratic job losses but #TPPANoWay protests aplenty about jobs?
08 Jun 2016 Leave a comment
in fiscal policy, labour economics, politics - Australia, politics - New Zealand, politics - USA, poverty and inequality, public economics Tags: expressive voting, growth of government, rational rationality, size of government, social insurance, universal basic income

The universal basic income is a rare bird for the left. It is the only time the usual suspects on the left are happy to cut government bureaucracy.

Furthermore, the left makes no inquiries as to how these redundant bureaucrats who administered the welfare state will find jobs. The market is left to work its magic for once. How convenient.

When a tariff cut is proposed, a trade deal signed, or job reduction in a bureaucracy suggested perhaps as the result of a privatisation, left-wing activists chain themselves to factory gates or government offices in solidarity. The social upheaval from the job losses among existing workers and their dim prospects of reemployment are paramount in their minds.

Why in the case of a universal basic income is the left so relaxed about job losses. Indeed, it celebrates as an advantage of a universal basic income that “Most of the bureaucracy of the welfare system [is] swept away” .

The universal basic income is the only time the left welcomes a reduction in bureaucracy and the role in the state. This switch from welfare payments to a universal basic income does not make those on the benefit any better off. Normally they are worse off under a universal basic income.
None of the the less well groups which of the concern of the left gain from a universal basic income. Despite this, they sell the jobs of their comrades in the public sector down the river.

I cannot believe the explanation is job losses are OK as long as they are the result of left-wing policies. Unless the labour market is liberalised, its ability to find new jobs for workers, for example, made redundant in the public sector after the introduction of a universal basic income is not any under greater than under a right-wing policy that costs jobs.
#GeorgeOrwell summarises the traditional @uklabour @nzlabour voter – sounds Blairite
07 Jun 2016 Leave a comment
in economic growth, labour economics, Marxist economics, politics - New Zealand
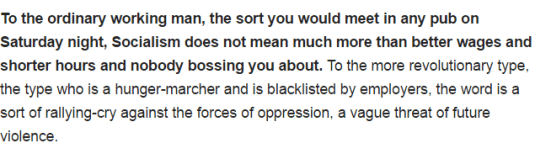
Source: The Road to Wigan Pier – Wikiquote.
#MiltonFriedman v. @berniesanders
05 Jun 2016 Leave a comment
in applied price theory, applied welfare economics, comparative institutional analysis, constitutional political economy, development economics, economic history, economics, economics of regulation, entrepreneurship, growth disasters, growth miracles, income redistribution, industrial organisation, labour economics, macroeconomics, Milton Friedman, minimum wage, occupational choice, politics - USA, Public Choice, public economics Tags: 2016 presidential election, Leftover Left
Yes, the World is Getting Better. Here’s Why.
05 Jun 2016 Leave a comment
in applied welfare economics, development economics, economic growth, economic history Tags: pessimism bias, The Great Enrichment
General government net financial liabilities as % Portuguese, Italian, Greek, Spanish and Irish GDPs
03 Jun 2016 Leave a comment
in budget deficits, business cycles, economic growth, economic history, Euro crisis, financial economics, fiscal policy, global financial crisis (GFC), macroeconomics Tags: Greece, Ireland, Italy, Portugal, public debt management, sovereign debt crises, sovereign defaults, Spain
I had borrowed a lot of money from scratch after 2007. Greece borrowed a lot of money of its own accord from 2010. Italy always owed a lot of money. Spanish do not know all that much money considering their dire financial circumstances.
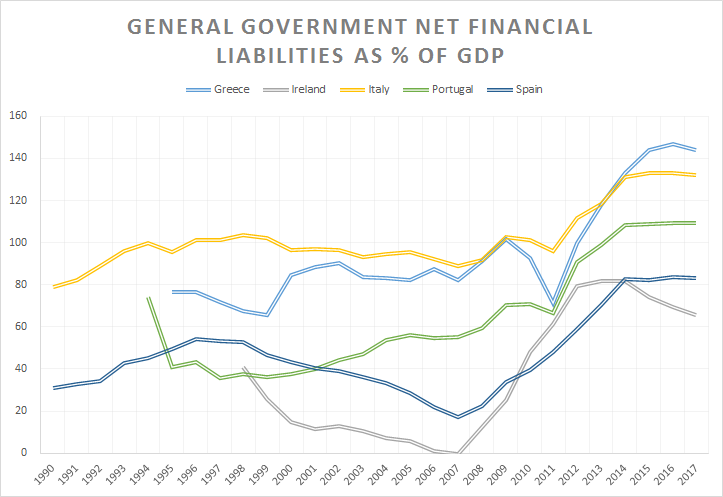
Source: OECD Economic Outlook June 2016 Data extracted on 01 Jun 2016 12:57 UTC (GMT) from OECD.Stat
Equilibrium unemployment rate: USA, UK, France, Germany, Canada & Australia, 1985-2017
02 Jun 2016 Leave a comment
in business cycles, economic growth, economic history, global financial crisis (GFC), great recession, labour economics, labour supply, unemployment Tags: British economy, Canada, equilibrium unemployment rate, France, Germany, natural unemployment rate
I do admire the way in which the USA has been able to have a steadily falling equilibrium unemployment rate since 1984 through thick and thin. The Great Recession had no impact on the US equilibrium unemployment rate. Not only has the largest member been able to do this, the OECD host country (red squares) has had a pretty steady natural unemployment rate too all things considered.
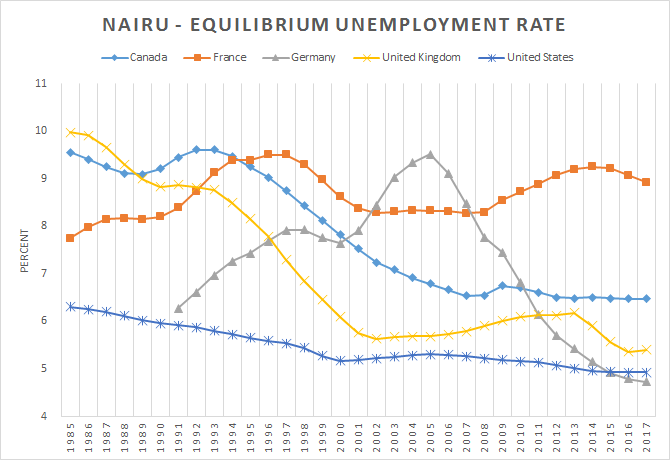
Source: OECD Economic Outlook June 2016 Data extracted on 01 Jun 2016 12:40 UTC (GMT) from OECD.Stat
Gap in GDP per Australian, Canadian, French, German, Japanese, New Zealander and British hour worked with the USA
28 May 2016 Leave a comment
in economic growth, economic history, labour economics, labour supply, macroeconomics, politics - Australia, politics - New Zealand, politics - USA, public economics Tags: Australia, British economy, Canada, Eurosclerosis, France, Germany, Japan, labour productivity, measurement error, taxation and labour supply
This data tells more of a story than I expected. Firstly, New Zealand has not been catching up with the USA. Japan stopped catching up with the USA in 1990. Canada has been drifting away from the USA for a good 30 years now in labour productivity.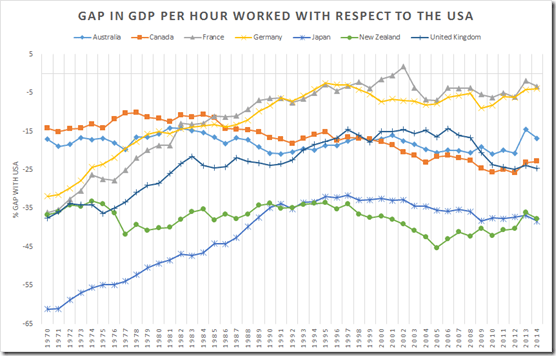
Data extracted on 28 May 2016 05:15 UTC (GMT) from OECD.Stat from OECD Compendium of Productivity Indicators 2016 – en – OECD.
Australia has not been catching up with the USA much at all since 1970. It has maintained a pretty consistent gap with New Zealand despite all the talk of a resource boom in the Australia; you cannot spot it in this date are here.
Germany and France caught up pretty much with the USA by 1990. Oddly, Eurosclerosis applied from then on terms of growth in income per capita.
European labour productivity data is hard to assess because their high taxes lead to a smaller services sector where the services can be do-it-yourself. This pumps up European labour productivity because of smaller sectors with low productivity growth.


Recent Comments