June jobless rate for people 25+ with
B.A. or more 2.5%
High school diploma 5.4%
No H.S. 8.2%
on.wsj.com/1LG1B6z http://t.co/luUUuw9h1V—
Sudeep Reddy (@Reddy) July 02, 2015
Unemployment rates by education in the USA
21 Jul 2015 Leave a comment
in business cycles, economics of education, global financial crisis (GFC), great recession, human capital, job search and matching, labour economics, labour supply, macroeconomics, unemployment Tags: education premium, labour market demographics
Trends in labour market freedom in the UK, USA, Germany and France – Index of Economic Freedom rankings
21 Jul 2015 Leave a comment
in economic history, economics of regulation, global financial crisis (GFC), job search and matching, labour economics, labour supply, law and economics, minimum wage, politics - USA, unions Tags: British economy, employment law, employment regulation, Eurosclerosis, France, Germany, Index of Economic Freedom
The writers of the Index of Economic Freedom at the Heritage foundation really loves the USA and didn’t think much of the Conservative Party – Liberal Democratic Party coalition government because labour market freedom actually fell in the UK during their administration. Bring back Tony Blair, all is forgiven. The information on their website throws no insight into why this reduction in labour market freedom in Britain happened.
Figure 1: Index of Economic Freedom, Argentina, Brazil, Chile and Venezuela, 95 – 2015 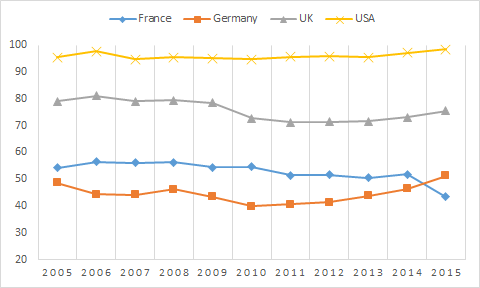
Source: Index of Economic Freedom 2015.
Fortunately for Germany, labour market freedom increased over the course of the global financial crisis and its aftermath. This helps explains low unemployment in Germany during that period. Nothing much happened in France in regard to labour market freedom.
What is Free Banking and Why Should I Care?
21 Jul 2015 Leave a comment
in industrial organisation, law and economics, macroeconomics, monetary economics, property rights Tags: free banking
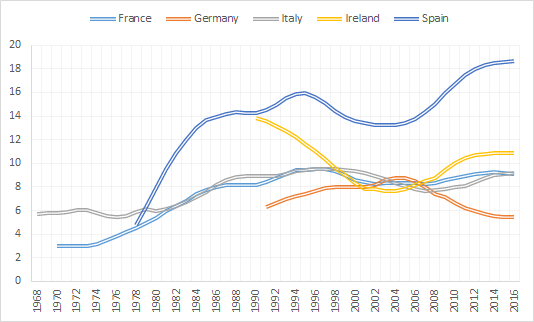
French, German, Italian, Irish and Spanish equilibrium unemployment rates, 1968 – 2016
19 Jul 2015 Leave a comment
in business cycles, economic growth, economic history, fiscal policy, job search and matching, labour economics, macroeconomics, unemployment Tags: Celtic Tiger, equilibrium unemployment rate, Eurosclerosis, Germany, Ireland, Italy, natural unemployment rate, Rance, Spain
Figure 1 shows large contrasts in time path of equilibrium unemployment rates. For example, French and Italian equilibrium unemployment rates haven’t changed much since about 1986.
Figure 1: equilibrium unemployment rates, France, Germany, Italy, Ireland and Spain, 1968 – 2016
Source: OECD Economic Outlook June 2015 via OECD StatExtract..
Figure 1 also shows some fortuitous ups and downs in the German equilibrium unemployment rate. This estimate was available only from after German unification.
The equilibrium German unemployment rate rose from 6% to above 8% on the eve of the global financial crisis. Fortunately for Germany, major labour market reforms brought the equilibrium unemployment rate down as Germany moved into the global financial crisis.
The Spanish equilibrium unemployment rate had been terrible since about 1980, started to fall in the 1990s, then skyrocketed even before the onset of the global financial crisis – see figure 1.
There have been ups and downs in the Irish equilibrium unemployment rate – see figure 1. It was as high as 14% at the end of the Irish great depression of the 1970s and 1980s. The equilibrium Irish unemployment rate was 8% at the heyday of the Celtic tiger then slowly rose in the lead up to the global financial crisis.
Greece debt crisis in 90 seconds
18 Jul 2015 Leave a comment
in economic growth, Euro crisis, fiscal policy, global financial crisis (GFC), great recession, international economics, law and economics Tags: Greece, sovereign defaults
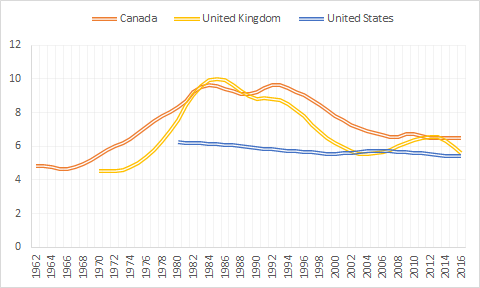
Equilibrium unemployment rates in Canada, USA and UK, 1962 – 2016
18 Jul 2015 Leave a comment
in business cycles, job search and matching, labour economics, labour supply, macroeconomics, unemployment Tags: British economy, Canada, equilibrium unemployment rate, natural unemployment rate
Figure 1 suggests a lot more structural change in the Canadian and British labour market in the 1970s and 1980s.
Figure 1: equilibrium unemployment rates, Canada, USA and UK, 1962 – 2016
Source: OECD Economic Outlook June 2015 via OECD StatExtract.
Nothing much at all seems to have happened to the equilibrium unemployment rate in the USA since the OECD first started calculating it. I doubt that so that will be subject of a future blog. Namely, the large changes in natural unemployment rates in the post-war period, largely to demographic changes such as the baby boom.
A lot of countries borrowed a lot of money recently
18 Jul 2015 Leave a comment
in budget deficits, fiscal policy, global financial crisis (GFC), great recession, macroeconomics Tags: Greece, Italy, Japan, sovereign debt, sovereign default, Spain
Greece is unlikely to be the last sovereign debt restructuring of this cycle wsj.com/articles/greec… via @greg_ip http://t.co/YnvOuDurDL—
Nick Timiraos (@NickTimiraos) July 16, 2015
Maggie Thatcher on the Greek crisis
17 Jul 2015 Leave a comment
in applied welfare economics, budget deficits, comparative institutional analysis, constitutional political economy, currency unions, economic growth, economic history, economics of regulation, Euro crisis, fiscal policy, income redistribution, macroeconomics, Marxist economics, Public Choice, rentseeking Tags: Greece, growth of government, Margaret Thatcher, size of government
How to argue for inequality and neoliberalism when arguing dead set against it
17 Jul 2015 Leave a comment
in economic growth, economic history, human capital, income redistribution, labour economics, labour supply, politics - New Zealand, poverty and inequality, Public Choice, rentseeking Tags: Leftover Left, neoliberalism, top 1%
On 12 August last, Closer Together New Zealand posted a chart showing average hourly wages had been stagnant for 20 years and then started growing again in 1993. Closer Together New Zealand then rounded up the usual suspects of the Left over Left.
Later that month in a comment on that post, a chart was posted showing that inequality had been increasing quite rapidly in the late 1980s and early 1990s in New Zealand. There were a range of economic reforms Closer Together New Zealand didn’t like in the late 1980s and early 1990s.
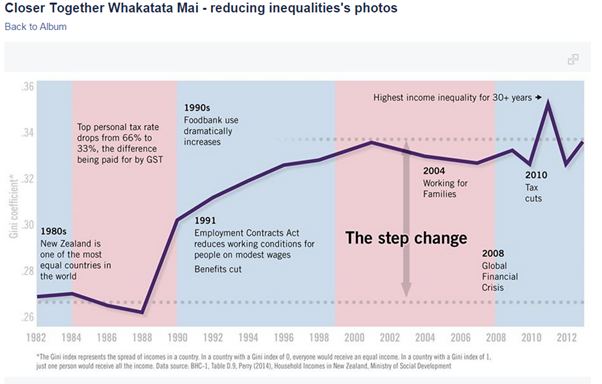
Closer Together New Zealand did not notice their second chart showed there had been a large increase in inequality, and their first chart showed that this was followed by the return of regular average hourly wages after 20 years of stagnation.
I am not so vulgar as to suggest correlation is causation, but it is amusing to watch that one day a chart is posted showing a resumption of wages growth after 20 years of wage stagnation and the next day a chart is posted showing that the major economic developments in the preceding years were a large increase in inequality and substantial economic liberalisation.
To add to my amusement, a companion site Inequality A New Zealand Conversation posted a chart showing the top 1% had not had much at all in income growth for the last 20 years while most everyone else had. This spike in the incomes of the top 1% prior to about 1994 was followed by the resumption in average wages growth after 1994.
What group has by far the lowest jobless rate?
17 Jul 2015 Leave a comment
in economics of education, human capital, job search and matching, labour economics, labour supply, occupational choice, unemployment Tags: College premium, compensating differentials, graduate premium, labour demographics
What group has by far the lowest jobless rate? College grads on.wsj.com/1Mtk8l9 http://t.co/27ft9qYjvz—
WSJ Central Banks (@WSJCentralBanks) June 05, 2015
If government “programmes have been doing very little to help children out of poverty”, what halved child poverty in the last 20 years? Economic growth?
16 Jul 2015 Leave a comment
in economic growth, labour economics, labour supply, minimum wage, politics - New Zealand, poverty and inequality, unemployment, welfare reform Tags: child poverty, family poverty, family tax credits, in-work tax credits, social insurance, welfare reform, welfare state

RNZ: Govt advised in 2013 "social mobility" approach won't materially address child poverty. rnz.to/1RwVWoj http://t.co/nfd2gY0qcH—
Alastair Thompson (@althecat) July 14, 2015
Figure 1: child poverty (%) in New Zealand (before and after housing costs), 1982 – 2013
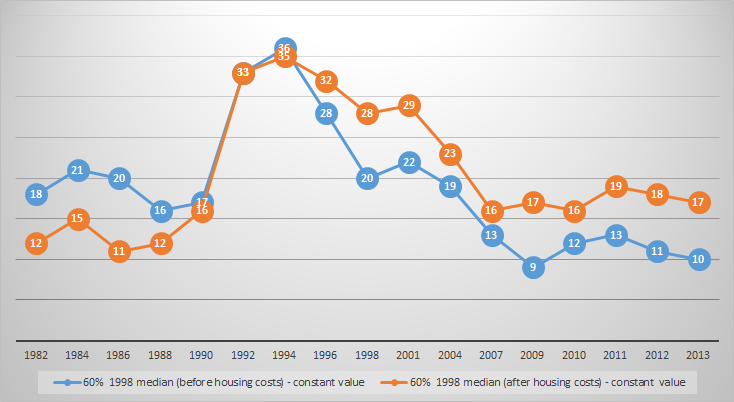
Source: Bryan Perry, Household incomes in New Zealand: Trends in indicators of inequality and hardship 1982 to 2013. Ministry of Social Development (July 2014), Tables F.6 and F.7.
Unemployment rates of immigrants and natives in OECD member countries
16 Jul 2015 Leave a comment
in job search and matching, labour economics, labour supply, unemployment Tags: economics of immigration, unemployment rates
John Cochrane on a big hole in the Greek bailout (and media analysis of the bailout)
15 Jul 2015 Leave a comment
in currency unions, Euro crisis, global financial crisis (GFC), great recession, macroeconomics, monetary economics Tags: bank runs, banking panics, Greece, John Cochrane, lender of last resort, sovereign bailouts, sovereign default

An average of 41% of Greek bank assets are non-performing, with loan repayments 90 days overdue or more (Barclays). http://t.co/HfXV8uapkj—
Mike Bird (@Birdyword) July 13, 2015
There were large cross-country differences in long-term unemployment duration both before and after the GFC
15 Jul 2015 Leave a comment
in Euro crisis, global financial crisis (GFC), great recession, job search and matching, labour economics, labour supply, macroeconomics, unemployment, welfare reform Tags: equilibrium unemployment rate, Eurosclerosis, natural unemployment rate, unemployment duration
77% more long-term unemployed people than before the crisis – We need them back in work! bit.ly/1JTTzYm #Jobs http://t.co/EFRGclFVms—
OECD Social (@OECD_Social) July 10, 2015
Hysteresis in practice, Delong-Summers Variety @delong @LHSummers http://t.co/urqxQBi6NE—
Roger E. A. Farmer (@farmerrf) July 23, 2015


Recent Comments