
HT: http://www.bloomberg.com/news/articles/2015-03-16/the-entire-global-economy-in-two-big-slides
Celebrating humanity's flourishing through the spread of capitalism and the rule of law
19 Mar 2015 Leave a comment
in business cycles, economic growth, Euro crisis, politics - Australia, politics - New Zealand, politics - USA Tags: global economic integration
19 Mar 2015 Leave a comment
in budget deficits, business cycles, economic growth, fiscal policy, inflation targeting, macroeconomics, Milton Friedman, monetarism, monetary economics Tags: fiscal policy, monetary policy, Paul Samuelson, rules versus discretion, stabilisation policy
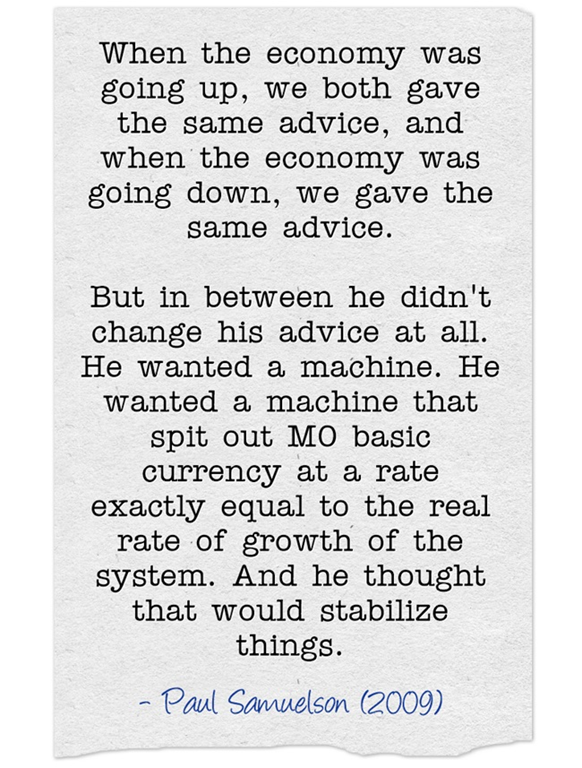
via Samuelson vs. Friedman, David Henderson | EconLog | Library of Economics and Liberty and An Interview With Paul Samuelson, Part One — The Atlantic.
17 Mar 2015 Leave a comment
in applied welfare economics, economic growth, economic history, labour economics, poverty and inequality, unions
Today in the Dominion Post, Bill Rosenberg, a trade union self-described economist, argued that the workers are not getting their fair share of productivity gains in New Zealand over the last 35 years:
I calculate that wages in the 60 per cent of the economy studied by the commission would have been 12 per cent higher on average by March 2011, if they had kept up with productivity since 1978.
He then rounded up the usual Twitter Left suspects:
The commission’s study is important in that it finds that a large part of the fall in the labour share of income in the 1990s was due to high unemployment created by the radical restructuring of the economy that began in the 1980s and the Employment Contracts Act passed in 1991. Australia underwent similar restructuring during the period, but its labour income share fell only slightly. Its labour market is underpinned with an award system and other protections.
12%! 12% is at all that the class struggle is about over a 35 year period in terms of wage losses and labour surplus extract by the greedy bosses?
Figure 1: Real equivalised median household income (before housing costs) by ethnicity, 1988 to 2013 ($2013)

Source: Bryan Perry, Household incomes in New Zealand: Trends in indicators of inequality and hardship 1982 to 2013. Ministry of Social Development (July 2014).
As shown in figure 1, between 1994 and 2010, real equivalised median New Zealand household income rose by 47%; for Māori, this rise was 68%; for Pasifika, the rise in real equivalised median household income was 77%. Obviously these losses from the change in shares of GDP are dwarfed by the general increases in living standards over the last 20 years.
As is common with every member of the Left over Left that I run into these days, such as Bill Rosenberg, their analysis has no gender analysis.
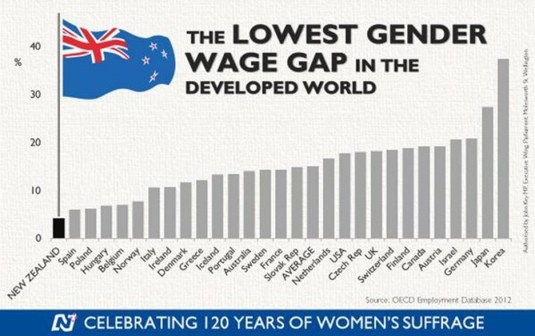
The Left over Left invariably fail to mention that New Zealand has the smallest gender wage gap of all the industrialised countries.
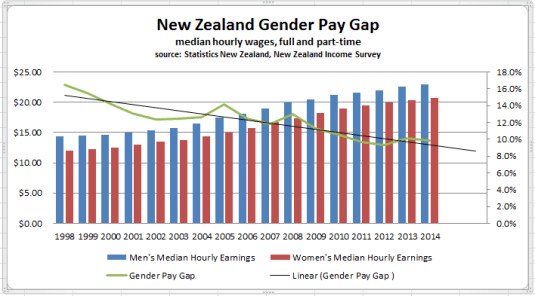
Over the last more than two decades in New Zealand, there has been sustained income growth spread across all of New Zealand society contrary to hopes and dreams of the Left over Left. Perry (2014) reviews the poverty and inequality data in New Zealand every year for the Ministry of Social Development. He concluded that:
Overall, there is no evidence of any sustained rise or fall in inequality in the last two decades. The level of household disposable income inequality in New Zealand is a little above the OECD median. The share of total income received by the top 1% of individuals is at the low end of the OECD rankings.
As for Rosenberg’s hypothesis that it’s all the fault of the Employment Contracts Act, that doesn’t stand up. Figure 2 shows that union membership has been in a long slow decline in New Zealand since the mid-1970s. This is been pretty much the pattern all round the world.
Figure 2: Union density, New Zealand, Australia, the UK and USA 1970-2013

Source: OECD Stats Extract
The much hated Employment Contracts Act 1991, much hated by the Left over Left, doesn’t really show up in the union density figures in figure 2. There is no sudden break in trend obvious in figure 2 in the early 1990s when the Employment Contract Act was passed.
Indeed, the passage of the Employment Contracts Act 1991 was followed by a 15 year economic boom in employment and economic growth, as shown in figure 3. This was after the lost decades of 1974 to 1992 when there was next to no growth in real GDP per New Zealander aged 15 to 64. The good old days when the Lost Decades for New Zealand.
Figure 3: Real GDP per New Zealander and Australian aged 15-64, converted to 2013 price level with updated 2005 EKS purchasing power parities, 1956-2013
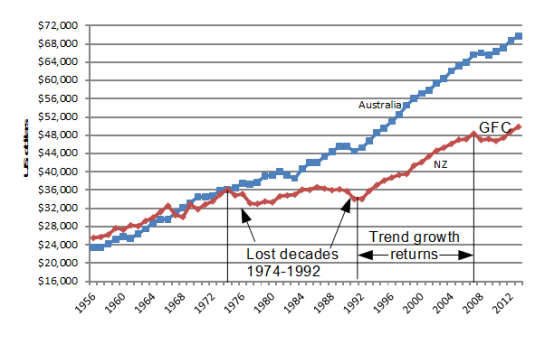
Source: Computed from OECD Stat Extract and The Conference Board, Total Database, January 2014.
Things are so grim for the class struggle in New Zealand that the leader of the Labour Party has had to redefine the working class because it is withering away so rapidly because so many workers are joining the middle-class:
Andrew Little is looking to update Labour's definition of the 'working class': stuff.co.nz/national/polit… http://t.co/AQ9mJL7CQf—
NZ Stuff Politics (@NZStuffPolitics) November 30, 2014
16 Mar 2015 Leave a comment
in business cycles, great depression, macroeconomics, Milton Friedman, monetarism, monetary economics Tags: lags on monetary policy, monetary policy

.
15 Mar 2015 Leave a comment
in currency unions, Euro crisis, inflation targeting, macroeconomics
When members of a monetary union are experiencing different macroeconomic conditions, a single policy rate is unlikely to fit circumstances in all countries. Currently, the ECB’s target rate seems to be in line with a Taylor rule recommendation for the euro area as a whole. However, economic differences between peripheral and core euro-area countries are sharp. The core countries are recovering, while the peripheral countries still have large unemployment gaps. Thus, the ECB target rate is not in line with Taylor rule recommendations for the peripheral countries.
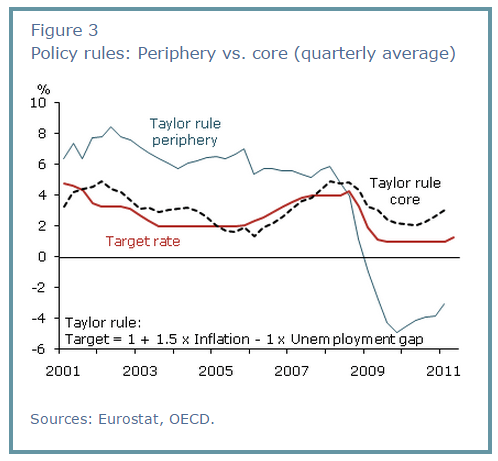

via Federal Reserve Bank San Francisco | Monetary Policy When One Size Does Not Fit All.
14 Mar 2015 Leave a comment
in business cycles, economic growth, macroeconomics, Milton Friedman
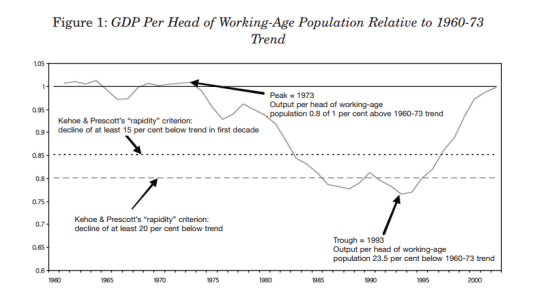
Finn Kydland has a simple explanation for the so-called Celtic Tiger. It was a recovery from a deep depression in the 1970s and 1980s in the Irish economy.
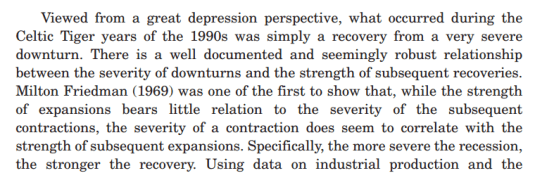
HT: “Ireland’s Great Depression,” Finn Kydland, Alan Ahearne and Mark A. Wynne, The Economic and Social Review 37(2), Summer/Autumn 2006, 215-243. (pdf)
13 Mar 2015 Leave a comment
in business cycles, economics of regulation, Euro crisis, job search and matching, labour economics, law and economics, macroeconomics, unemployment Tags: employment protection laws, Euroland, Eurosclerosis, labour market regulation

77% more long-term unemployed people than before the crisis – We need them back in work! bit.ly/1JTTzYm #Jobs http://t.co/EFRGclFVms—
OECD Social (@OECD_Social) July 10, 2015

HT: IMF
11 Mar 2015 Leave a comment
in business cycles, great recession, human capital, job search and matching, labour economics, labour supply, occupational choice, politics - USA, unemployment Tags: labour demographics
10 Mar 2015 Leave a comment
in applied welfare economics, economic growth, economic history, labour economics, liberalism, poverty and inequality, Rawls and Nozick Tags: class struggle, immiseration of the proletariat, Leftover Left, top 1%
How is the immiseration of the proletariat going to occur any time soon, and with it, the workers will rise up because they have nothing to lose but their chains, if the Australian top 1% doesn’t lift its game.
There is a serious lack of greed and expropriation of labour surplus by the top 1% in Australia. Their share of income has been falling for many decades and only increased in the last few years and then only slightly.
The top 1% is supposed to be grinding the working class down, and causing crisis after financial crisis but there’s hardly any of evidence of that in Australian income inequality data.
06 Mar 2015 1 Comment
in business cycles, macroeconomics Tags: conjecture and refutation, forecasting errors, Karl Popper, methodology of economics, Noah Smith, philosophy and social sciences, prophecy
Noah Smith is ranting today about how economists cannot forecast the timing of recession. He doesn’t use the most obvious argument.

That argument is if you are any good at picking the timing of the next recession, you wouldn’t go around talking and telling other people and publishing in the paper for all the world to hear.
You would keep quiet and trade in your own account, signing futures contracts and share options to take maximum advantage of seeing further than others. Show me the money, as Murray Rothbard explained:
Many studies, formal and informal, have been made of the record of forecasting by economists, and it has been consistently abysmal.
Forecasters often complain that they can do well enough as long as current trends continue; what they have difficulty in doing is catching changes in trend. But of course there is no trick in extrapolating current trends into the near future.
You don’t need sophisticated computer models for that; you can do it better and far more cheaply by using a ruler.
The real trick is precisely to forecast when and how trends will change, and forecasters have been notoriously bad at that. No economist forecast the depth of the 1981–82 depression, and none predicted the strength of the 1983 boom.
The next time you are swayed by the jargon or seeming expertise of the economic forecaster, ask yourself this question: If he can really predict the future so well, why is he wasting his time putting out newsletters or doing consulting when he himself could be making trillions of dollars in the stock and commodity markets?
Karl Popper argued that the job of the economist and other social scientists is not to be a prophet but to make conditional predictions such as if circumstances A apply, B will ensue. To do any more is to fall for the age-old allure of the prophet and his prophecies.
06 Mar 2015 Leave a comment
in job search and matching, labour economics, labour supply, politics - New Zealand Tags: zero hours contracts
Firstly, those on zero hours contracts are overwhelmingly younger people and more often women. Both groups value flexible working hours more than others. That’s why they make up the majority of workers on zero hours contracts.
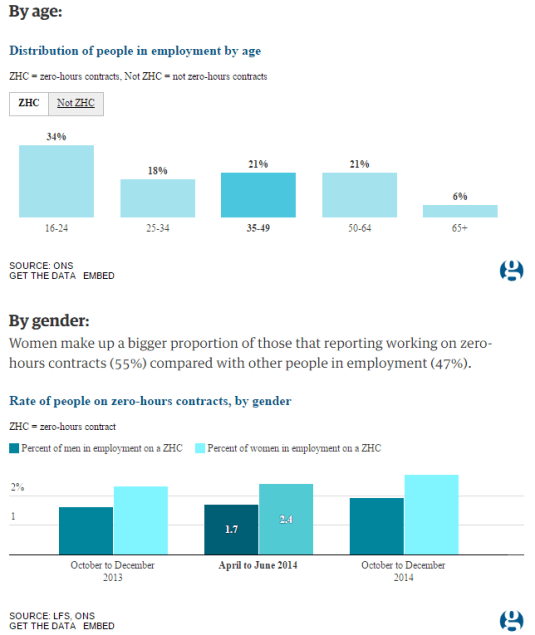
Also not surprisingly, people on zero hours contracts also tend to be more often in full-time education. Another group that values flexibility in hours. Furthermore, many of those on zero hours contracts have only been in the current job for less than 12 months. Again, suggesting they come from groups that change jobs frequently, which means they can easily quit and find another job if they don’t like a zero-hours contract.
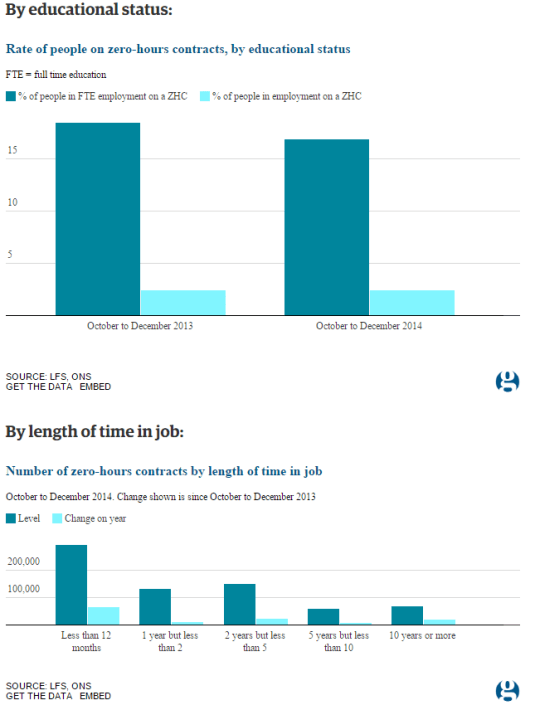
Via Zero-hours contracts in four charts | News | The Guardian
Celebrating humanity's flourishing through the spread of capitalism and the rule of law
Celebrating humanity's flourishing through the spread of capitalism and the rule of law
Celebrating humanity's flourishing through the spread of capitalism and the rule of law
Celebrating humanity's flourishing through the spread of capitalism and the rule of law
Celebrating humanity's flourishing through the spread of capitalism and the rule of law
A History of the Alt-Right
Econ Prof at George Mason University, Economic Historian, Québécois
Celebrating humanity's flourishing through the spread of capitalism and the rule of law
Scholarly commentary on law, economics, and more
Beatrice Cherrier's blog
Celebrating humanity's flourishing through the spread of capitalism and the rule of law
Celebrating humanity's flourishing through the spread of capitalism and the rule of law
Celebrating humanity's flourishing through the spread of capitalism and the rule of law
Why Evolution is True is a blog written by Jerry Coyne, centered on evolution and biology but also dealing with diverse topics like politics, culture, and cats.
Celebrating humanity's flourishing through the spread of capitalism and the rule of law
A rural perspective with a blue tint by Ele Ludemann
DPF's Kiwiblog - Fomenting Happy Mischief since 2003
Celebrating humanity's flourishing through the spread of capitalism and the rule of law
The world's most viewed site on global warming and climate change
Tim Harding's writings on rationality, informal logic and skepticism
A window into Doc Freiberger's library
Let's examine hard decisions!
Commentary on monetary policy in the spirit of R. G. Hawtrey
Thoughts on public policy and the media
Celebrating humanity's flourishing through the spread of capitalism and the rule of law
Politics and the economy
A blog (primarily) on Canadian and Commonwealth political history and institutions
Reading between the lines, and underneath the hype.
Economics, and such stuff as dreams are made on
"The British constitution has always been puzzling, and always will be." --Queen Elizabeth II
Celebrating humanity's flourishing through the spread of capitalism and the rule of law
Celebrating humanity's flourishing through the spread of capitalism and the rule of law
WORLD WAR II, MUSIC, HISTORY, HOLOCAUST
Undisciplined scholar, recovering academic
Celebrating humanity's flourishing through the spread of capitalism and the rule of law
Res ipsa loquitur - The thing itself speaks
In Hume’s spirit, I will attempt to serve as an ambassador from my world of economics, and help in “finding topics of conversation fit for the entertainment of rational creatures.”
Researching the House of Commons, 1832-1868
Articles and research from the History of Parliament Trust
Reflections on books and art
Posts on the History of Law, Crime, and Justice
Celebrating humanity's flourishing through the spread of capitalism and the rule of law
Exploring the Monarchs of Europe
Cutting edge science you can dice with
Small Steps Toward A Much Better World
“We do not believe any group of men adequate enough or wise enough to operate without scrutiny or without criticism. We know that the only way to avoid error is to detect it, that the only way to detect it is to be free to inquire. We know that in secrecy error undetected will flourish and subvert”. - J Robert Oppenheimer.


Recent Comments