Not so long ago, any Green MP who suggested sipping camomile tea or some other herbal concoction to ward off the horrific Ebola virus would surely have been deemed by his or her colleagues to be guilty – but only of being eccentric.
There used to be a lot of it about. Who can forget the senior party official who marked the opening session of one Green Party conference by lighting a large candle in recognition of any spirits that might have been present or invoke any that delegates wished to be present. (Sadly, the candle had to be extinguished soon after this mind-boggling seance. It fell foul of more earthly and more mundane forces – namely health and safety regulations.)
On their website, Van der Zee now urges supporters of homeopathy to sign the Change.org petition started in Australia, calling on WHO “to test and distribute homeopathy as quickly as possible to contain the outbreaks”.
Among the signatories is Steffan Browning, a Green Party MP in New Zealand.
He was publicly dismissed by the prime minister John Key as “barking mad”.
“Let’s be honest, this is a serious global issue, and if he really thinks that’s the answer I’d love to see the medical research,” said Key.
Browning admitted “it was probably a bit unwise” to sign the petition, which he also shared on his Facebook page encouraging other people to sign it. He said he had signed it “pretty late at night”, although he hoped WHO would keep an open mind on potential treatment options, since there was currently no cure.
New Zealand’s health minister, Jonathan Coleman, however, said treating Ebola patients with homeopathic remedies was “a wacko idea”, adding: “I don’t know what he’s thinking, it’s very, very dangerous. I think he really needs to engage his brain, it’s a really and stupid dangerous idea.”
NZ Green MP Steffan Browning says giving his support to a call for the World Health Organisation to deploy homeopathic remedies to combat the Ebola epidemic in West Africa.
Mr Browning this week signed a petition started by Australian Fran Sheffield which calls on the World Health Organisation (WHO) to
End the suffering of the Ebola crisis. Test and distribute homeopathy as quickly as possible to contain the outbreaks.
Asked whether he thought homeopathy could cure Ebola, Mr Browning said:
It’s not for me to go down that track at all.
The World Health Organisation, world health authorities are doing that.
They will be considering I hope absolutely every possible options to this very concerning disease.
Green Party co-leader Russel Norman said the petition did not reflect the position of the party, and agreed it was unwise of Browning to have signed it.
To be clear, we don't believe homeopathy has any part to play in combating Ebola outbreaks. We support only evidence-based measures.
Green party health spokesman Kevin Hague said he was "disappointed" Browning had signed the petition.
Browning is also on the record has been anti-GMOs, and is the green party spokesmen on genetic modification as well as the range of science-based portfolios such as agriculture and biosecurity.
To listen to most pundits, evolution, stem cells, and climate change are the only scientific issues worth mentioning—and the only people who are anti-science are on the right of politics.
Those on the left have numerous fallacies of their own. Aversion to clean energy programs, basic biological research, and even life-saving vaccines come naturally to many progressives. These are positions supported by little more than junk-science and paranoid thinking.
I wonder who will pay for this? Caregiver wages are funded out of a fixed budget allocated by the government.
A higher wage will change the type of worker that the caregiving sector will seek to recruit, as happened after increases in the teenage went minimum wage.
When the teenage minimum wage went up in New Zealand, employment of 17 and 18-year-olds fell, while the employment of 18 to 19-year-olds increased because the latter were more mature and reliable than the younger contemporaries.
“The Court of Appeal’s decision declining the employers’ appeal in the Kristine Bartlett case is a huge victory for women workers” said Pay Equity Coalition Challenge spokesperson Angela McLeod.
“The Courts’ decision that equal pay may be determined across industries in female-dominated occupations revitalises the Equal Pay Act 1972 and will be a major factor in closing New Zealand’s stubborn 14 percent gender pay gap”.
The judgement by the Court of Appeal upholding the Employment Court decision again validates the work of caregivers and that they are underpaid, she said.
“We commend the Service and Food Workers Union Nga Ringa Tota in taking this case and exposing the underpayment and undervaluation of aged care workers. And the decision is a victory for all the women’s organisations who have never given up fighting for equal pay,”…
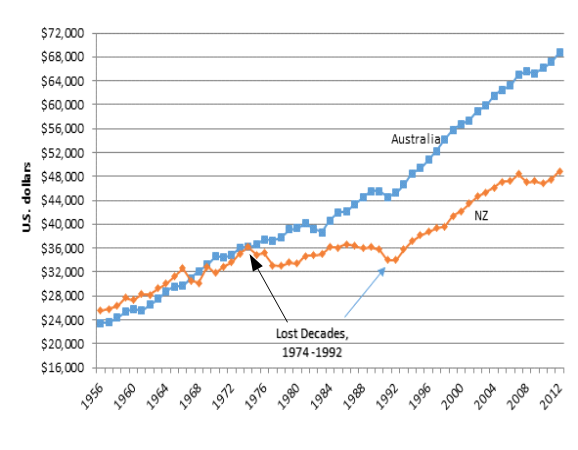
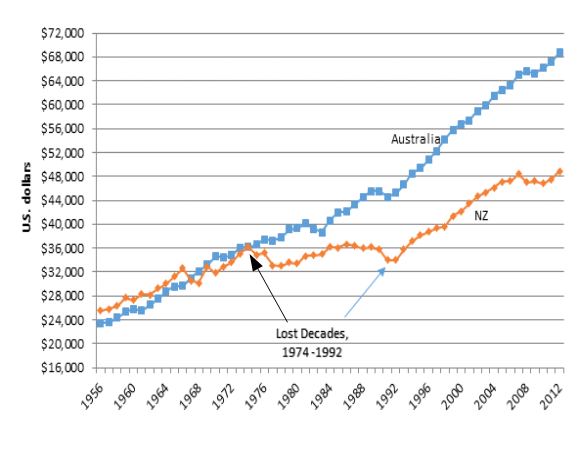
Figure 2 shows that this rapid rise in inequality coincided with the resumption of economic growth after two lost decades: next to no increase in real GDP per working age New Zealander from 1974 to 1992.
Figure 2: Real GDP per New Zealander and Australian aged 15-64, converted to 2013 price level with updated 2005 EKS purchasing power parities, 1956-2012
Income inequality in New Zealand is at a similar level to Australia, Canada, Italy and Japan (Ginis of 32-33) and a little lower than the UK (34). Countries such as Denmark, Norway, Finland and Belgium have lower than average inequality (Ginis of 25-26). The US and Israel have higher scores of 39.
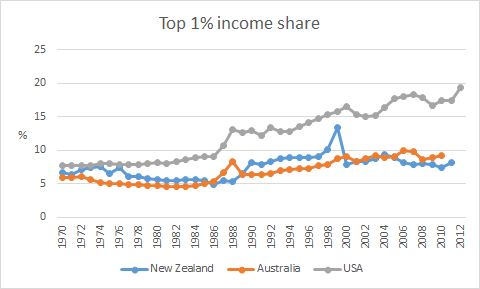
The top 1% in New Zealand received around 8% of all taxable income in 2010 and 2011 (before tax), similar to Norway, Finland and Australia, lower than Ireland and Switzerland (11%) and much lower than the UK and Canada (13%) and the US (18%).
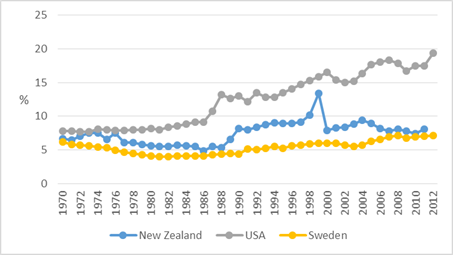
The trend for the New Zealand share has been steady at around 8-9% since the mid 1990s, with perhaps a slight fall in the last few years. Many OECD countries saw small rises in the period, and in the USA the top 1% share continued to rise strongly, from 13% to 19%.
Perry (2014) concluded that:
Overall, there is no evidence of any sustained rise or fall in inequality in the last two decades. The level of household disposable income inequality in New Zealand is a little above the OECD median. The share of total income received by the top 1% of individuals is at the low end of the OECD rankings.
This remark by Parry that there is no evidence of any sustained rise or fall in inequality in New Zealand in the last 20 years is very much at odds with the claim of Closer Together New Zealand that income inequality inequality increased rapidly in the late 1980s and 1990s.
The increase in inequality in New Zealand was in the late 1980s and early 1990s. In the early 1990s, a long economic boom started that lasted until the global financial crisis.
Figure 3 : Income Inequality in New Zealand as Assessed by the Gini Coefficient
Source: Perry 2014 derived from Statistics NZ Household Economic Survey (HES) 1982–2012.
Figure 4: Income Inequality in New Zealand as Assessed by the P80/P20 Ratio
Source: Perry 2014 derived from Statistics NZ Household Economic Survey (HES) 1982–2012.
Figures 3 and 4 both show that after housing costs inequality in New Zealand is higher, but has been pretty stable for 20 years as measured by the Gini coefficient and by the P80/P20 ratio. (When individuals are ranked by equivalised household income and then divided into 100 equal groups, each group is called a percentile. If the ranking starts with the lowest income, then the income at the top of the 20th percentile is denoted P20; the income at the top of the 80th percentile is called P80. The ratio of the value at the top of the 80th percentile to the value at the top of the 20th percentile is called the P80/20 ratio and is often used as a measure of income inequality).
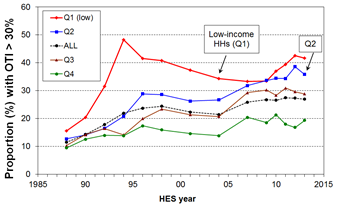
Figure 5: Proportion of HHs with housing cost outgoings to income of greater than 30%, by income quintile
Source: Perry (2014); OTI = outgoings to income
Figure 5 shows that
for the bottom quintile (Q1), the proportion with high outgoings to income (OTI) steadily reduced from 48% in 1994 to 34% in 2004, as unemployment fell, employment and income rose, and income-related rental policies were introduced in 2000 for those in HNZC houses. From HES 2009 to HES 2013 the proportion rose strongly from 33% to 42%, the highest it has been in the last 25 years except for the peak of 48% in 1994.
For households with incomes in the second quintile (Q2) there was a strong rise from the 1980s through to the mid 1990s, followed by a relatively flat trend to 2004. Since 2004, the proportion with high OTIs has risen strongly from 27% to 36%.
For the third quintile (Q3) the proportion with high OTIs settled at around 30% for 2007 to 2013, up from 21% in 2004 and 10% in 1988.
Rising housing costs in New Zealand have one explanation, which is restrictions on the supply of land under the Resource Management Act.
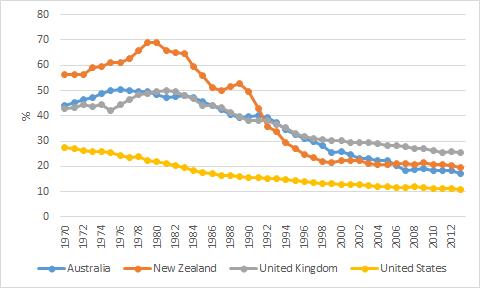
The Encyclopaedia of New Zealand says that the rate of union membership dropped sharply to under 20% when the Employment Contracts Act was passed in 1991 using the chart below.
Figure 1: Percentage of union members
The OECD union density data, which allows international comparisons back to 1970, tells a different story. OECD data on union membership in New Zealand started in 1970.
Figure 2: Union density,New Zealand, Australia, the UK and USA 1970-2013
Note: Trade union density corresponds to the ratio of wage and salary earners that are trade union members, divided by the total number of wage and salary earners (OECD Labour Force Statistics).
Figure 2 above shows that union membership has been in a long slow decline in New Zealand since the mid-1970s. This is been pretty much the pattern all round the world.
The much hated Employment Contracts Act 1991, much hated by the Left over Left, doesn’t really show up in the union density figures in figure 2. There is no sudden break in trend obvious in figure 2.
The longer time series in union membership in figure 1 compiled by the Encyclopaedia of New Zealand has long gaps between the data observations. Because of this, the sharp decline in union membership from the late 1970s, which it actually show up in its start-up , is not sufficiently distinguished from subsequent events because of the long gaps between observations reported in the figure 1.
If anything, union membership stopped declining in New Zealand in the late 1990s. Stabilising at about 20% of wage and salary earners.
Union membership continued to decline slowly in Australia, the UK and the USA subsequent to 1998. Union membership stabilised in New Zealand by contrast. Perhaps the Employment Contracts act should be able to claim credit for that?
The NZ top 1% share has been steady at 8-9% since the mid-1990s. The top 1%’s share rose strongly in the USA in recent decades, from 13% in the mid-1980s to 19% in 2012.
Figure 1: Top 1% income shares, USA, New Zealand and Sweden, 1970-2012
The top 1% in New Zealand is so lazy that Sweden is overtaking it – See figure 1.
The Occupy crowd blame everything from the global financial crisis to a bad environment on growing inequality and the top 1%. Such an argument has no foundation in fact in New Zealand.
Income inequality as measured by the Gini coefficient has not risen much in New Zealand for 20 years – See figure 2. How can the poor be getting getting poorer, ground under by the yoke of capitalism, if the rich are not getting richer. The occupy movement should apply for unemployment benefits and seek career guidance.
Figure 2: Gini coefficient New Zealand 1980-2015
Source: Bryan Perry, Household incomes in New Zealand: Trends in indicators of inequality and hardship 1982 to 2013. Ministry of Social Development (July 2014).
The last major increase in income inequality in New Zealand was in the late 1980s and early 1990s and that was followed by a long economic boom – See figure 3 .
Figure 3: Real GDP per New Zealander and Australian aged 15-64, converted to 2013 price level with updated 2005 EKS purchasing power parities, 1956-2012
This long boom was after two decades of next to no economic growth in the 1970s and 1980s in New Zealand – see figure 3 . This depression between 1974 and 1992 was New Zealand’s lost decades.
Figure 4 shows that both the lost decades of economic growth in New Zealand and the emergence of the trans-Tasman income gap the seemed to somewhat coincide with the top 1% of earners in Australia increasing their share of income from 6% to 10% of total incomes while the New Zealand top 1% sat on their hands. They are such lazy devils.
Figure 4: Top 1% income shares, USA, New Zealand and Australia, 1970-2012
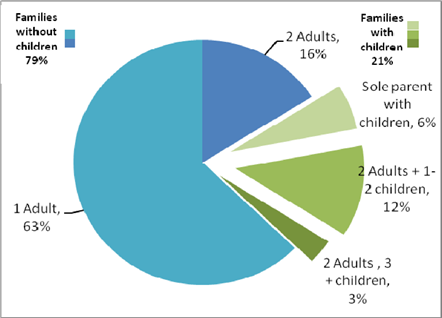
Distribution of families earning below the Living Wage
Source: Taxwell
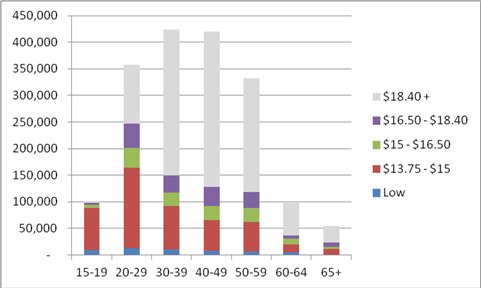
The wage rates of people of different ages
Source: Taxwell
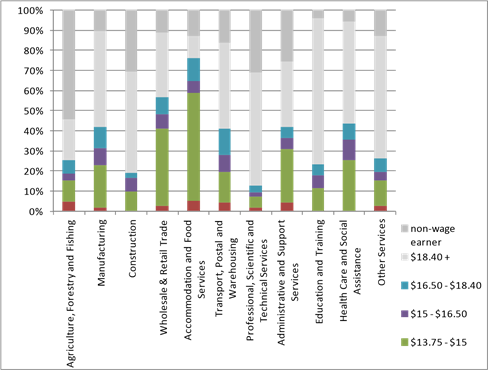
The distribution of wages by industry
Non-wage earners is mainly self employed. Source: Taxwell
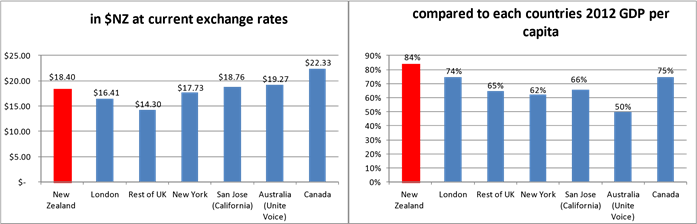
NZ’s proposed Living Wage compared to other Living Wage proposals
Source: Living Wage campaign websites, and exchange rates as at 20 September 2013
The Living Wage proposal is an ineffective way to help families with low incomes, because:
Many low income earners are people below the age of 30 who are single or part of a childless couple;
The extra earnings by parents would result in reduced tax credits or benefit payments (as they abate with higher income).
If adopted as a minimum wage, New Zealand would be out of line with other countries, and it is likely to reduce employment, particularly of younger people trying to enter the labour market.
The overall impact on poverty levels is likely to be small, but it would represent a change of focus from supporting families with children towards supporting young, single people.
The Taxpayers’ Union today launched my report, Monopoly Money, which examines the cost and case for New Zealand’s extensive corporate welfare programmes.
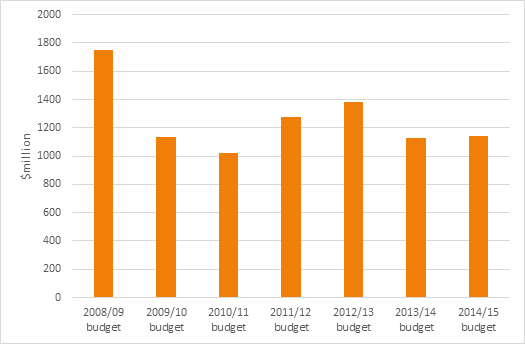
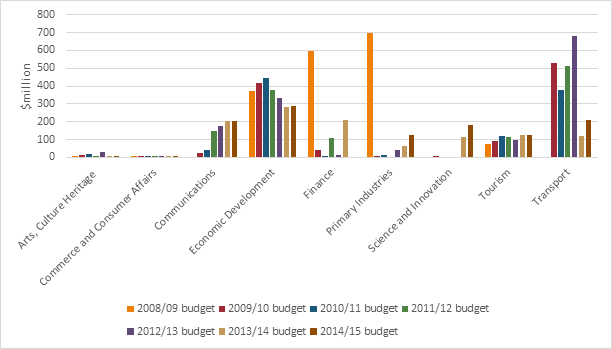
Figure 1: Corporate welfare, Budgets 2008/09 to 2014/15
My report, which examines the cost of corporate welfare examines government spending since the 2007/2008 budget, shows:
Since National took office, corporate welfare has cost taxpayers $1-1.4 billion ($600 – $800 per household) per year
If corporate welfare was abolished, enough money would be saved to reduce the corporate tax rate from 28% to 22.5%
If applied to personal income tax rates, the saving would allow the 30% and 33% income tax rates to be lowered to 29%
Figure 2: Corporate welfare, Budgets 2008/09 to 2014/15 by Vote
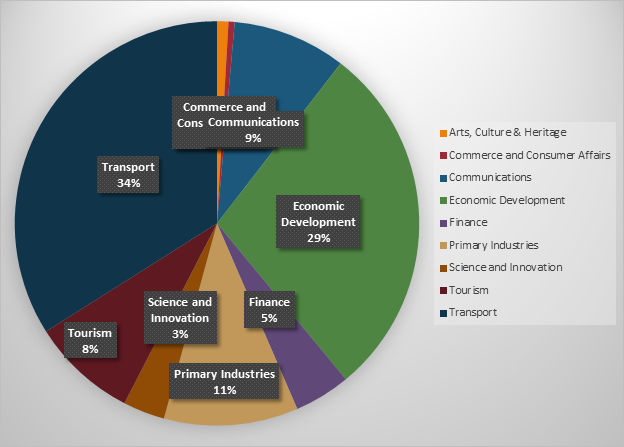
Figure 3: Distribution of total corporate welfare across votes, 2008/09 to 2014/15
Can hearts and minds be bought? A metaphorical question posed to ask whether government spending can aid counterinsurgency. In their paper, Berman et al. seek to answer this basic question using current literature, recent data and a model of counterinsurgency.
They chose Iraq for their research because it is presently significant, there is a large amount of data and most importantly, because it is characterised by insurgency and not by ‘conventional warfare’. It is this characteristic, argued by Berman et al. that will be seen more often in future conflicts that is so crucial to understand. Another important facet to note is that current ‘US Army counterinsurgency doctrine’ is not based on any social scientific theory; thereby making the need to understand insurgency more vital to aid spending.
By using current data, Berman et al. find on the whole that the correlation between reconstruction spending and violence across Iraqi districts…
Two millionaires, one on the left and one on the right, set up parties to get into Parliament in the recent New Zealand election. The millionaire of the left failed abysmally. The millionaire on the right made progress towards getting into Parliament in the 2017 election.
Each spent vast sums of money by New Zealand standards on their party:
Kim.com gave $4.5 million to his Internet – Mana party; and
Colin Craig gave about $1.5 million to his Conservative party with another millionaire giving $750,000 to the Conservative party.
By way of context, the maximum that a political party can spend on campaign expenses in the three months prior to the election is $1.1 million, plus $25,000 per electorate seat It is contesting. None of this is spent on radio and television advertising because this is allocated for free by the electoral commission based on previous election performance.
One of the major rationales for election finance regulation is to stop the rich buying elections by flooding the airways and billboards with their call to arms and buying politicians short of campaign donations:
Conventional wisdom holds that money plays a central and nefarious role in American politics.
Underlying this belief are two fundamental assumptions:
(1) elective offices are effectively sold to the highest bidder, and
(2) campaign contributions are the functional equivalent of bribes.
Campaign finance regulations are thus an attempt to hinder the operation of this political marketplace.
John Milyo
New Zealand is a good example of how difficult it is to buy votes if you’re underlying message does not work. This is a key point to remember.
The millionaire of the left, Kim.com, gave money to a far left party in New Zealand, recycled a couple of middle-aged lefties, ran a hard left campaign, and won all of 2000 extra party votes over last time out of electorate of about 2 million.
He came unstuck because his sitting electorate MP lost 3000 votes and lost his seat. If he had kept his seat, his party would have been also entitled to a List MP seat because his party won 1.3% of the party vote. Under the New Zealand system of mixed member proportional representation, if you win a seat in Parliament, you’re entitled to list seats to ensure that your representation in Parliament is equal to your party vote.
The millionaire of the right, Colin Craig, ran a socially conservative, economic nationalist campaign and won 4% of the vote. A party needs 5% of the party vote to get into Parliament if your party does not win an electorate seat.
Both of these parties that did not get into Parliament outspent the winning national party which won 60 of the 121 seats in Parliament.
The failure of Kim.com and Colin Craig to buy their way Parliament should be no surprise. Most systematic studies find no effect of marginal campaign spending on the electoral success of candidates.
Levitt noted that previous studies of congressional spending have found a large positive effect of challenger spending, but little evidence for effects of incumbent spending. Those studies did not adequately control for inherent differences in vote-getting ability across candidates.
His paper examined elections in which the same two candidates face one another on more than one occasion; differencing eliminates the influence of any fixed candidate or district attributes.
His estimates of the effects of challenger spending are an order of magnitude below those of previous studies. Campaign spending has an extremely small impact on election outcomes, regardless of who does the spending.
Jeff Milyo also found that a more systematic analysis of the electoral fortunes of wealthy candidates found no significant association between electoral or fund-raising success and personal wealth. For example, see Jeffrey Milyo and Timothy Groseclose, “The Electoral Effects of Incumbent Wealth,” Journal of Law and Economics 42 (1999): 699–722.
A range of rich candidates have attempted to buy Senate seats and gubernatorial posts with little success if they were themselves unappealing candidates.
The best explanation to date for the minor effect of campaign spending on electoral success is competent candidates are adept at both convincing contributors to give money and convincing voters to give their vote.
The finding that campaign spending and electoral success are highly correlated exaggerates the importance of money to a candidate’s chances of winning.
Campaign donors give more money to the expected winners because they want to be on the winning side. What lobbyist doesn’t want to be that the best new friend of the incoming minister?
Legislators tend to act in accordance with the interests of donors, but this is not because of a quid pro quo. Instead, donors tend to give to like-minded candidates. See Steven Levitt, “Who are PACs Trying to Influence with Contributions: Politicians or Voters?” Economics and Politics 10, no. 1 (1998): 19–36.
It is a much surer thing to give donations to a party that already agrees with you, rather than persuade someone to change their minds with campaign donations. That is a much less certain bet.
Studies of legislative behaviour indicate that the most important determinants of an incumbent’s voting record are constituent interests, party, and personal ideology. These three factors explain nearly all of the variation in incumbents’ voting records. See Steven Levitt, “How Do Senators Vote? Disentangling the Role of Party Affiliation, Voter Preferences and Senator Ideology,” American Economic Review 86 (1996): 425–441.
As an aside, the hard left campaign was instructive in another regard. The hard left honestly believes that there is a large number of people out willing to vote hard left if only their message was properly funded and got a hearing. These would be hard left voters are currently parking their vote elsewhere, such as with the right wing parties, apparently.
A massively funded hard left campaign in New Zealand won 1.2% of the party vote. In the 2011 election, the same hard left party, when woefully underfunded, won 1.1% of the party vote. Getting the message out appears to have absolutely no effect on the party vote of the hard left. The median voter theory rules.
The Conservative party was much more successful because the Christian parties in New Zealand usually get about 4% of the vote, except when they’re fighting with each other over who was following the Word of God better, which is rather common.
Furthermore, about 10-15% of the New Zealand election is both socially conservative and economically nationalist. They used to be called working-class Tories. Much of this vote currently votes for the New Zealand First Party– a one-man party – and its leader will be 72 at the next election.
Why Evolution is True is a blog written by Jerry Coyne, centered on evolution and biology but also dealing with diverse topics like politics, culture, and cats.
In Hume’s spirit, I will attempt to serve as an ambassador from my world of economics, and help in “finding topics of conversation fit for the entertainment of rational creatures.”





![clip_image002[7]](https://utopiayouarestandinginit.com/wp-content/uploads/2014/10/clip_image00271.png "clip_image002[7]")







Recent Comments