
Top incomes and the decline of unions in Canada, France and Italy
03 Nov 2015 Leave a comment
in applied price theory, applied welfare economics, economic history, entrepreneurship, industrial organisation, labour economics, labour supply, Milton Friedman, poverty and inequality, Public Choice, rentseeking, unions Tags: Canada, entrepreneurial alertness, France, Italy, top 1%, union power, union wage premium
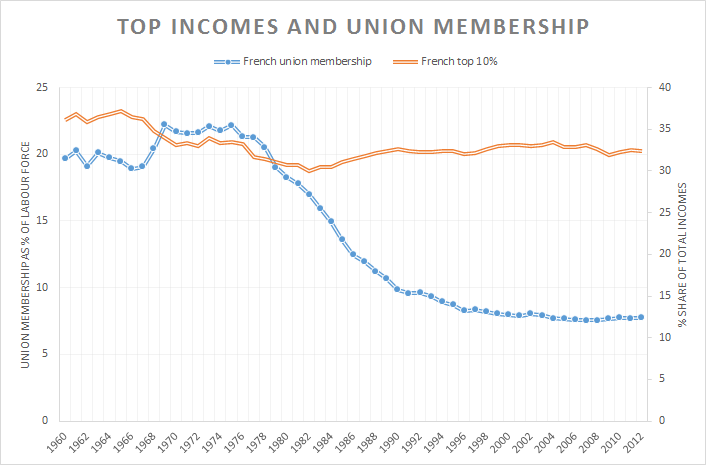
The French ruling class is as lazy as their transnational co-conspirators down under. French union membership is in serious decline albeit from a low base. An opportunity lost for the French ruling class. It has not lifted a finger to extract additional labour surplus from the downtrodden French proletariat now stripped of their only line of collective defence against capitalist exploitation.
Source: OECD Stat and Top Incomes Database.
The top 10% and top 1% in France are no better off than two generations ago despite the decline of French unions. The French Left must be most disappointed. No kicking in the rotten door of the permanent revolution anytime soon after the immiserised French proletariat rises up because it has nothing to lose but its chains. The 21st century version of the Marxist call to the barricades would be a proletariat stirred to revolution with nothing to lose but their suburban home, motorcar, IPad and air points

Source: OECD Stat and Top Incomes Database.
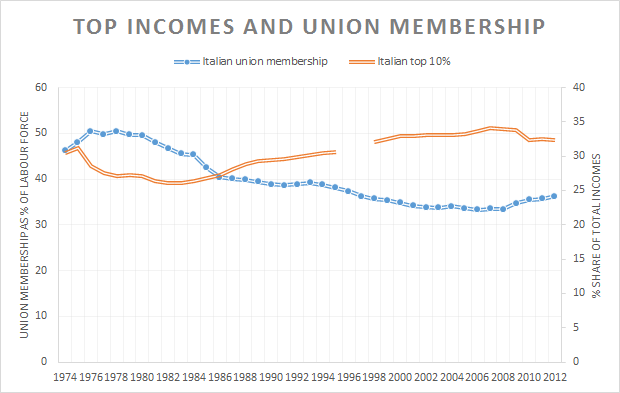
The Italian ruling class has had little success in bringing Italian unions down. The top 10% in Italy is earning no more now than back when the Red Brigades were gunning for them.
Source: OECD Stat and Top Incomes Database.
The top 1% in Italy is doing a little bit better than when the Red Brigade was gunning for them, but not much more. Unions don’t figure in explaining that small rise in Italian top 1% incomes over the last 40 years. Italian unions are pretty much a strong as they were 40 years ago in membership. Italian employment protection laws are pretty much as strong as they used to be too.

Source: OECD Stat and Top Incomes Database.
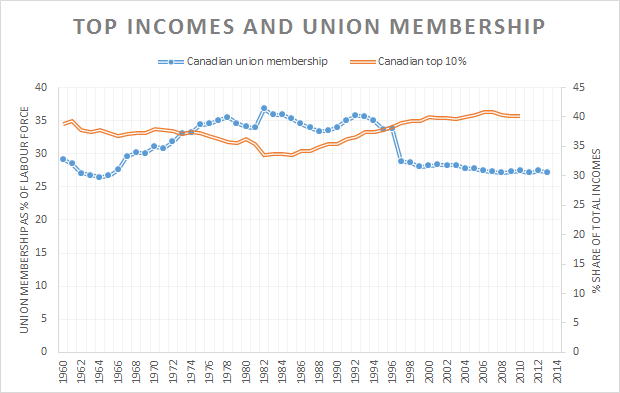
The Canadian ruling classes even more incompetent than their transnational co-conspirators over in Italy. There appears to have been next to no decline in union membership in Canada. The Canadian top 10% is not earning any more than back in the 60s.
Source: OECD Stat and Top Incomes Database.
The Canadian top 1% is doing a little bit better than 25 years ago also but not off the back of unions which are almost as strong as in the past. The Canadian Left will have to look for a different hypothesis than the ravages of the top 1%.

Source: OECD Stat and Top Incomes Database.
All in all, the Economic Policy Institute simply got lucky with a spurious correlation between top incomes and union membership in the USA.
Tertiary educational attainment by age and gender, USA, UK, Canada and Australia, 2013
25 Oct 2015 Leave a comment
in discrimination, economics of education, gender, human capital, labour economics, occupational choice, politics - Australia, politics - USA Tags: Australia, British economy, Canada, reversing gender gap
There are marked differences in progress in tertiary educational attainment between countries and across the generations. For example, while a few more American women have tertiary degrees as compared to their mothers, there’s been no change for American men for a generation.

Source: Indicators of Gender Equality in Education – OECD.
Canada is firing ahead in both tertiary educational attainment and reversing the gender gap in education for good. Two thirds of prime age Canadian women have a tertiary degree as compared to half of their mothers.
The number of British women with tertiary degrees is also much higher than their mothers. British men are trying their best to keep up.
Tertiary education premium by gender in the English-speaking countries, 2012
19 Oct 2015 1 Comment
in discrimination, economics of education, gender, human capital, labour economics, occupational choice, politics - Australia, politics - New Zealand, politics - USA Tags: Australia, British economy, Canada, College premium, education premium, gender wage gap, Ireland, New Zealand, reversing gender gap
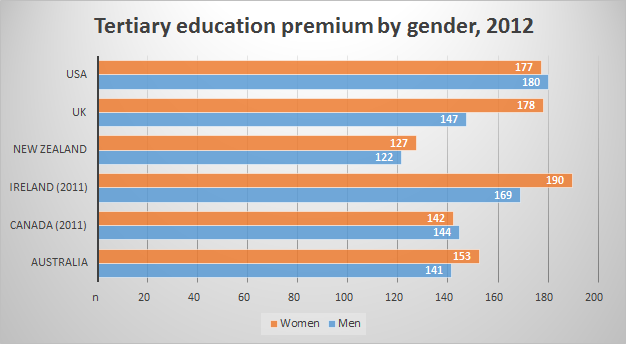
There are large differences in the education premium between English speaking countries and also by gender. The tertiary premium in New Zealand is pretty poor compared to the USA, UK or Ireland and is still mediocre when compared to Australia and Canada.
Source: Education at a Glance 2014.
Most of Canada lives near the border
15 Oct 2015 Leave a comment
in population economics Tags: Canada, economics of borders, NAFTA
Half of Canada lives south of the red line, or 45.7 degrees north.
(via bit.ly/1MRF9cG) http://t.co/QTzV5cquj1—
Max Roser (@MaxCRoser) September 27, 2015
Why 41% of Americans wanted a fence on their northern border
01 Oct 2015 Leave a comment
in economics of crime, economics of media and culture, law and economics, politics - USA Tags: Canada, economics of immigration, Justin Bieber
@justinbieber #MUGSHOT http://t.co/ZuYwmdipIy—
Miami Beach Police (@MiamiBeachPD) January 23, 2014
Canadian life expectancies by age and gender since 1990
23 Aug 2015 Leave a comment
in economic history, health economics, population economics Tags: Canada, life expectancies, The Great Escape

Source: Life Expectancy by Age in selected Country from 1990 to 2013 | Health Intelligence.

Source: Life Expectancy by Age in selected Country from 1990 to 2013 | Health Intelligence.
Over-qualification rates in jobs in the USA, UK and Canada
19 Aug 2015 2 Comments
in economics of bureaucracy, economics of education, human capital, job search and matching, labour economics, labour supply, occupational choice, politics - USA, Public Choice Tags: British economy, Canada, compensating differentials, job shopping, offsetting behaviour, on-the-job training, search and matching, The fatal conceit, The pretense to knowledge
In the UK, foreign-born are much more likely to be over qualified than native born highly educated not in education with less difference between men and women. More men than women are overqualified for their jobs in the UK. Over qualification is less of a problem in the UK than in the USA and Canada.
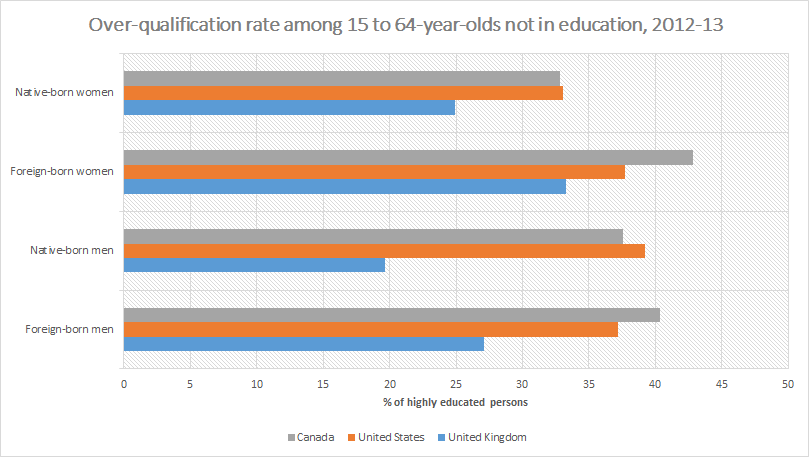
Source: OECD (2015) Indicators of Immigrant Integration 2015: Settling In.
In the USA and Canada, there are few differences between native and foreign born men in over-qualification rates. Foreign-born women tend to be more over-qualified than native born women in the USA and more so in Canada. Many more workers are overqualified for their jobs in the USA and Canada as compared to the UK.
There are large differences in the percentage of people with tertiary degrees and the education premium between these three countries that are outside the scope of this blog post. These trends may explain differences in the degree of educational mismatch.
It goes without saying that the concept of over-qualification and over-education based mismatch in the labour market is ambiguous, if not misleading and a false construct.
To begin with, under human capital theories of labour market and job matching, what appears to be over-schooling substitutes for other components of human capital, such as training, experience and innate ability. Not surprisingly, over-schooling is more prominent among younger workers because they substitute schooling for on-the-job training. A younger worker of greater ability may start in a job below his ability level because he or she expects a higher probability to be promoted because of greater natural abilities. Sicherman and Galor (1990) found that:
overeducated workers are more likely to move to a higher-level occupation than workers with the required level of schooling
Investment in education is a form of signalling. Workers invest so much education that they appear to be overqualified in the eyes of officious bureaucrats. The reason for this apparent overinvestment is signalling superior quality as a candidate. Signalling seems to be an efficient way of sorting and sifting among candidates of different ability. The fact that signalling survives in market competition suggests that alternative measure ways of measuring candidate quality that a more reliable net of costs are yet to be discovered.
A thoroughly disheartening chart if you're a graduate in the UK i100.io/mpDbJAl http://t.co/mv9izA0mbc—
i100 (@thei100) August 20, 2015
Highly educated workers, like any other worker, must search for suitable job matches. Not surprisingly, the first 5 to 10 years in the workforce are spent in half a dozen jobs as people seek out the most suitable match in terms of occupation, industry and employer. Some of these job seekers who are highly educated will take less suitable jobs while they search on-the-job for better matches. Nothing is free or instantly available in life including a good job match.
A more obvious reason for over qualification is some people like attending university and other forms of education for the sheer pleasure of it.
Anyone who encounters the words over-qualified and over-educated should immediately recall concepts such as the pretence to knowledge, the fatal conceit, and bureaucratic busybodies. As Edwin Leuven and Hessel Oosterbeek said recently:
The over-education/mismatch literature has for too long led a separate life of modern labour economics and the economics of education.
We conclude that the conceptional measurement of over-education has not been resolved, omitted variable bias and measurement error are too serious to be ignored, and that substantive economic questions have not been rigorously addressed.
The Canadians are coming! The Canadians are buying up our land! What has @NZGreens to say about that?
17 Aug 2015 Leave a comment
in economics of regulation, entrepreneurship, financial economics, politics - New Zealand Tags: Australia, Canada, China, FDI, Japan, Left-wing hypocrisy, left-wing popularism, New Zealand Greens, right-wing popularism
Canada was the largest source of foreign investment during the period, as its pension fund bought 18 properties in a portfolio from AMP and increased its stake in Kaingaroa Forest.
Average duration of unemployment, USA, Canada and Australia, 1968 – 2014
08 Aug 2015 Leave a comment
in business cycles, economic history, global financial crisis (GFC), great recession, job search and matching, labour economics, labour supply, macroeconomics, unemployment Tags: Australia, Canada, unemployment rates
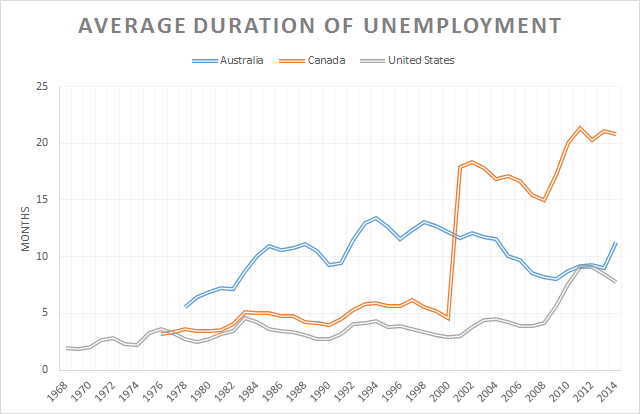
Source: OECD StatExtract.
I have no information as to why there is a sudden surge in the Canadian unemployment duration rate in 2001.
Tax rates on labour income across the OECD area
02 Aug 2015 Leave a comment
in labour economics, labour supply, politics - Australia, politics - New Zealand, politics - USA, public economics Tags: Australia, British economy, Canada, France, Germany, taxation and labour supply
How high is the US #tax burden on labor? Here's an OECD comparison tax.foundation/1KojUv9 by @samcjordan_ @kpomerleau http://t.co/fSAT8ut52z—
Tax Foundation (@taxfoundation) July 24, 2015
Hourly minimum wages before and after taxes, USA, UK, Canada, Australia, New Zealand and Japan
26 Jul 2015 Leave a comment
in labour economics, minimum wage, politics - Australia, politics - New Zealand, politics - USA, population economics, public economics Tags: Australia, British economy, Canada, Japan, social insurance, Social Security taxes, taxation and labour supply
Figure 1: Hourly minimum wage before and after taxes, 2013, US dollars at purchasing power parities, single-person household
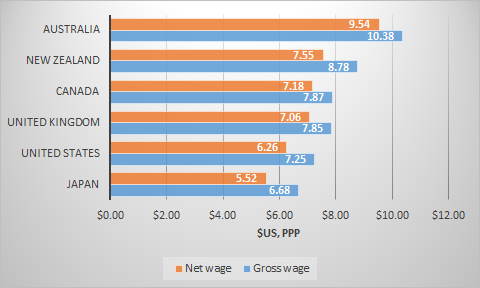
Source: OECD Focus on Minimum Wages after the crisis (2015).
Equilibrium unemployment rates in Canada, USA and UK, 1962 – 2016
18 Jul 2015 Leave a comment
in business cycles, job search and matching, labour economics, labour supply, macroeconomics, unemployment Tags: British economy, Canada, equilibrium unemployment rate, natural unemployment rate
Figure 1 suggests a lot more structural change in the Canadian and British labour market in the 1970s and 1980s.
Figure 1: equilibrium unemployment rates, Canada, USA and UK, 1962 – 2016
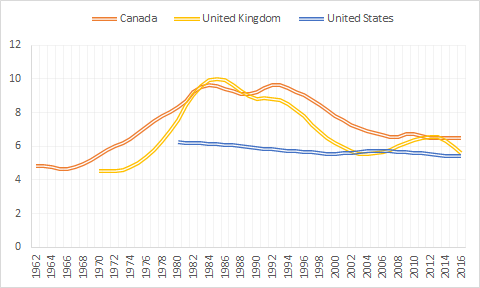
Source: OECD Economic Outlook June 2015 via OECD StatExtract.
Nothing much at all seems to have happened to the equilibrium unemployment rate in the USA since the OECD first started calculating it. I doubt that so that will be subject of a future blog. Namely, the large changes in natural unemployment rates in the post-war period, largely to demographic changes such as the baby boom.
NAFTA v. the Common Market: trading across the French, German, Italian, British, Canadian and US borders – World Bank Doing Business rankings compared
17 Jul 2015 Leave a comment
in economics of regulation, industrial organisation, international economics, politics - USA Tags: border costs, British economy, Canada, Common market, Common markets, customs unions, EU, France, free trade areas, Germany, Italy, NAFTA, trade costs
Figure 1: World Bank Doing Business rankings and sub rankings for trading across the French, German, Italian, British, Canadian and US borders, 2014
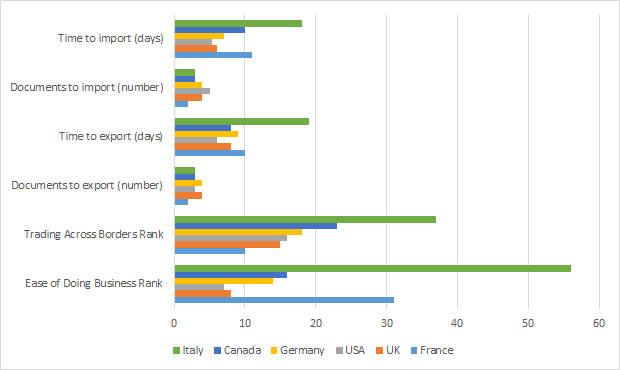
Source: World Bank Doing Business database; note: cost of importing and exporting not included.
Figure 2: World Bank Doing Business rankings – cost of importing and exporting across the French, German, Italian, British, Canadian and US borders, 2014
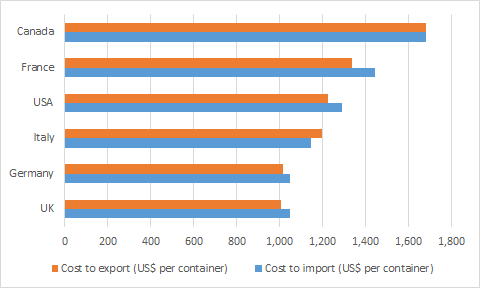
Source: World Bank Doing Business database; note: cost of importing and exporting not included.


Recent Comments