14 Jul 2015
by Jim Rose
in international economics, labour supply, minimum wage, politics - Australia, politics - New Zealand, politics - USA, poverty and inequality, welfare reform
Tags: Australia, British economy, Canada, low pay, New Zealand, social insurance, welfare state, working poor
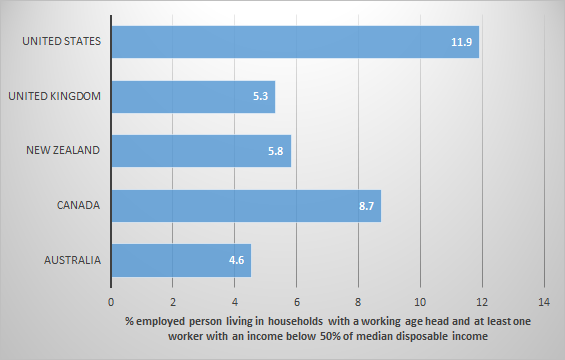
Figure 1: working poor – proportion of employed persons with income below the poverty line (50% of median disposable income) living in households with a working age head and at least one worker in USA, UK, Canada, Australia and New Zealand, 2013
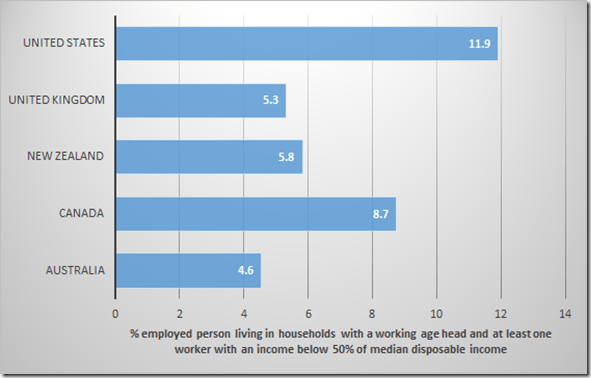
Source: In It Together – Why Less Inequality Benefits All – © OECD 2015, OECD Income Distribution Database (IDD), www.oecd.org/social/income-distribution-database.htm, Table 1.A1.1. Key indicators on the distribution of household disposable income and poverty, 2007, 2011 and 2013 or most recent year.
12 Jul 2015
by Jim Rose
in discrimination, economics of love and marriage, gender, labour economics, labour supply, law and economics, occupational choice, politics - USA, poverty and inequality
Tags: asymmetric marriage premium, British economy, Canada, gender wage gap, marriage and divorce, motherhood penalty
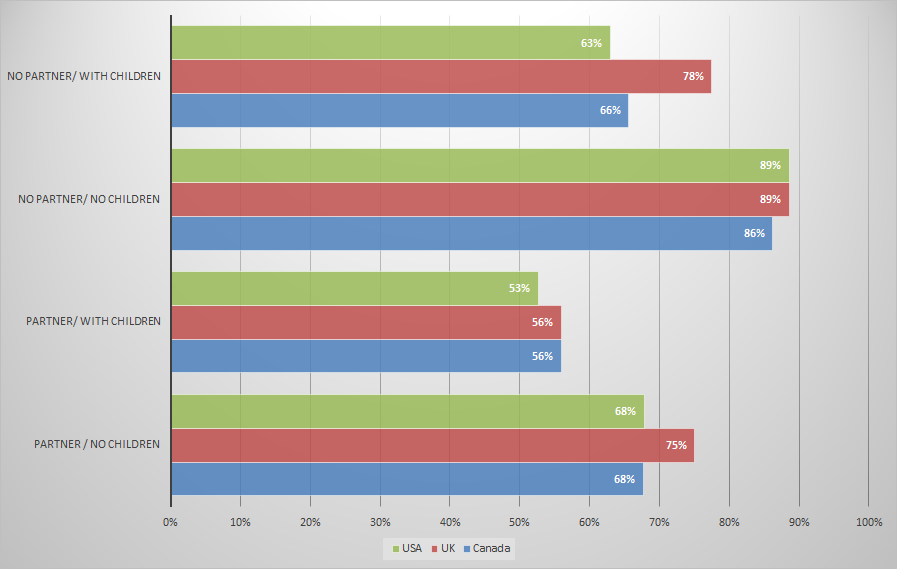
Figure 1: Female/male earnings ratio by partner status and motherhood, 2004 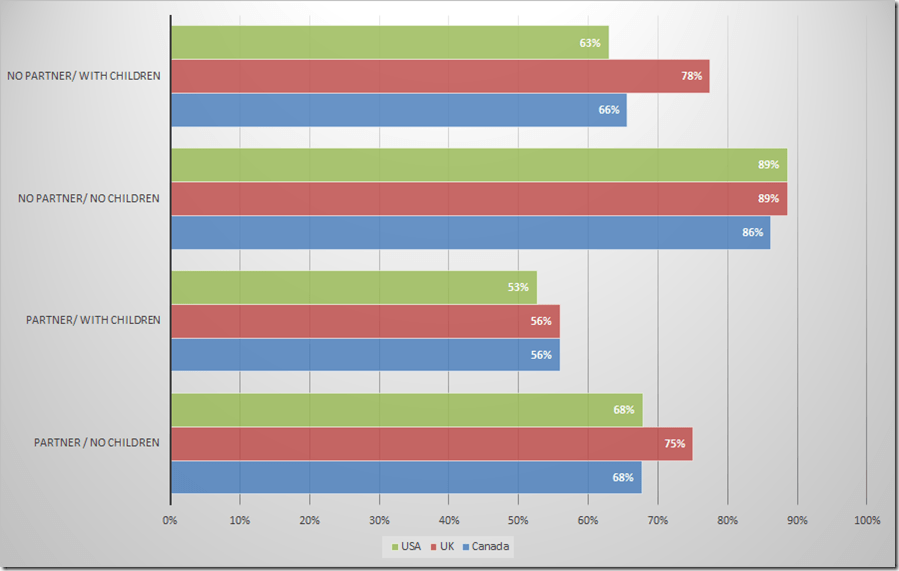 Source: LIS Cross-National Data Center in Luxembourg – Wave VI; individuals with positive earnings only. .
11 Jul 2015
by Jim Rose
in economics of love and marriage, labour economics, labour supply, law and economics, politics - Australia, politics - USA, poverty and inequality, welfare reform
Tags: Australia, British economy, Canada, child poverty, family poverty, marriage and divorce, single mothers, single parents
Figure 1: poverty rates by age of youngest child, 2004
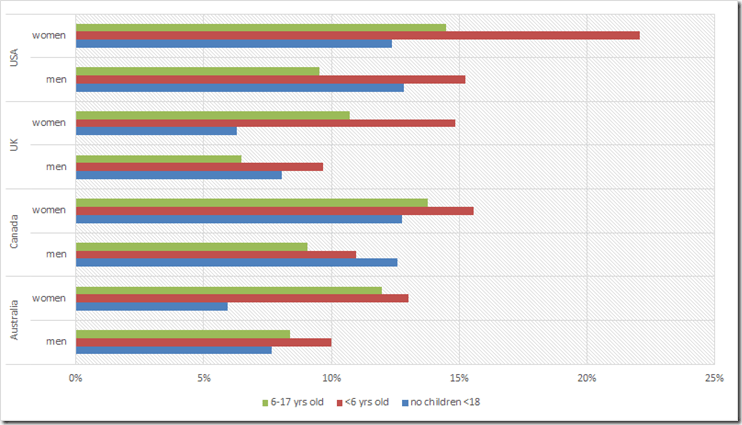
Source: LIS Cross-National Data Center in Luxembourg.
10 Jul 2015
by Jim Rose
in applied welfare economics, economics of bureaucracy, economics of regulation, law and economics, politics - USA, property rights, Public Choice
Tags: Canada, doing business, rule of law, World Bank
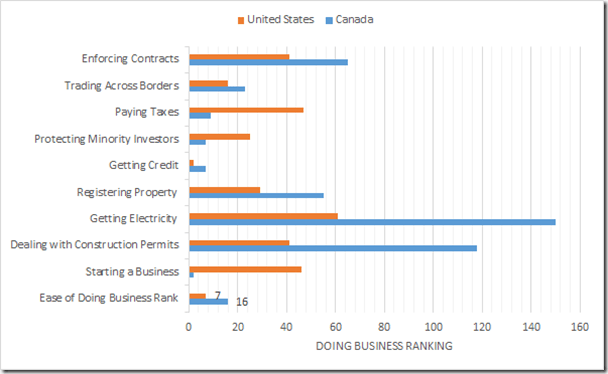
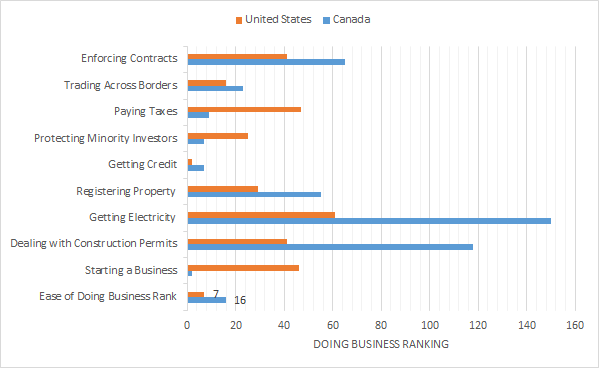
Figure 1: Doing Business in the USA, Canada, World Bank rankings, 2014
Source: Doing Business – Measuring Business Regulations – World Bank Group.
It’s easier to do business in the USA and Canada because of the difficulties with construction permits and getting electricity and few more problems with enforcing contracts and registering property. It is easy to open a business in Canada.
02 Jul 2015
by Jim Rose
in discrimination, economics of education, gender, human capital, labour economics
Tags: Australia, British economy, Canada, Japan, lost boys, reversing gender gap
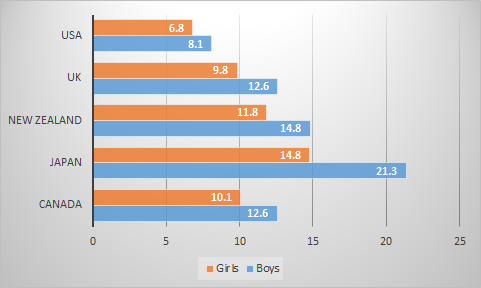
Why are Japanese 15-year-old girls as good at science as teenagers anywhere else in the world?
Figure 1: Percentage achieving the proficiency level 5 or higher in sciences by gender, USA, UK, Japan, Canada, Australia, New Zealand, 2012
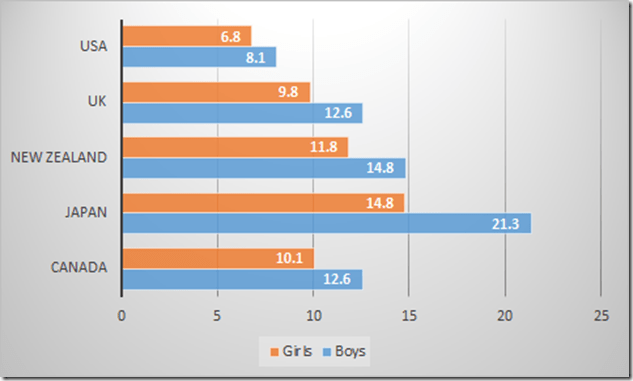
Source: OECD StatExtract.
01 Jul 2015
by Jim Rose
in economics of education, gender, human capital, labour economics
Tags: Australia, British economy, Canada, Japan, lost boys, reversing gender gap
Figure 1: Percentage achieving the proficiency level 5 or higher in mathematics by gender, USA, UK, Japan, Canada, Australia, New Zealand, 2012
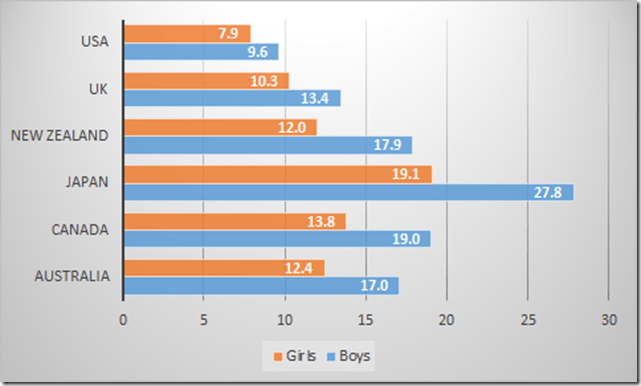
Source: OECD StatExtract.
30 Jun 2015
by Jim Rose
in discrimination, economics of education, gender, human capital, labour economics
Tags: Australia, British economy, Canada, Japan, lost boys, reversing gender gap
Figure 1: percentage achieving the proficiency level 5 or higher in reading by gender, USA, UK, Japan, Canada, Australia, New Zealand, 2012
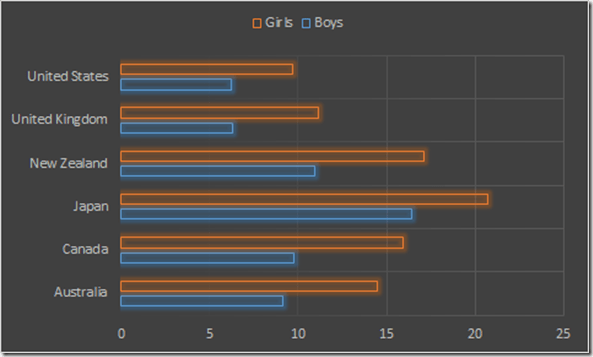
Source: OECD StatExtract.
28 Jun 2015
by Jim Rose
in labour economics, politics - USA, poverty and inequality, welfare reform
Tags: British economy, Canada, top 1%
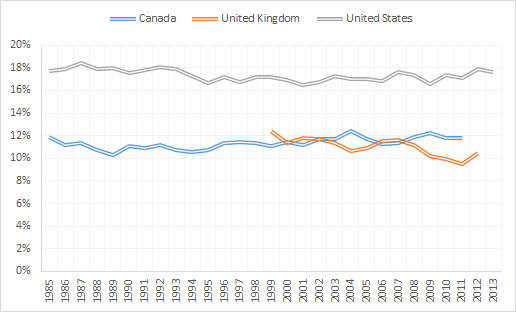
Despite 30 years of the ravages of neoliberalism, Reagan, Thatcher, and Blair, the whole lot, poverty has not gone up or down much at all.
Figure 1: relative poverty rate (% of persons living with less than 50% of equivalised disposable income), USA, UK and Canada

Source: In It Together – Why Less Inequality Benefits All – © OECD 2015
26 Jun 2015
by Jim Rose
in economic history, entrepreneurship, human capital, labour economics, labour supply, Marxist economics, occupational choice, politics - Australia, politics - USA, poverty and inequality
Tags: Australia, British economy, Canada, Leftover Left, top 0.1%, top 1%
Figure 1: top 0.1% share of gross income, Australia, UK, USA and Canada since 1946

Source: Chartbook of Economic Inequality.
The top 0.1% in Australia is earning not much more than it did in 1946. For most of the post-war period, the Australian top 0.1% earned less than what it earned in 1946. The only spike in the earnings of the Australian top 0.1% occurred after the top tax rate of 66% was reduced to 49% in 1986.
There were major cuts in the top tax rates in Australia,the USA and UK in the early 1980s. Figure 1 shows that these top tax rate cuts were matched with a spike in the earnings of the top 0.1% subsequent to those large tax cuts.
24 Jun 2015
by Jim Rose
in economics of education, human capital, labour economics, labour supply, occupational choice, politics - Australia, politics - New Zealand, politics - USA
Tags: Australia, British economy, Canada, College premium, educational attainment, graduate premium
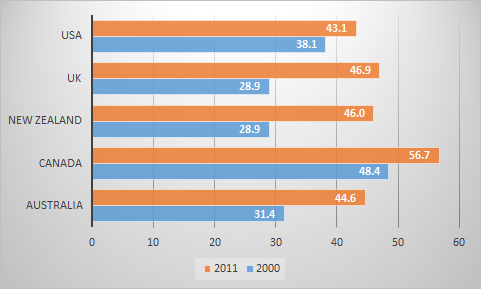
Figure 1: tertiary educational attainment of adults aged 25 to 34 in Australia, New Zealand, USA, UK and Canada, 2000 and 2011
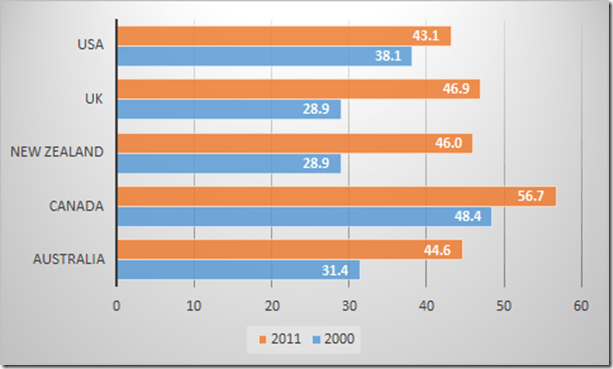
Source: OECD Factbook.
22 Jun 2015
by Jim Rose
in labour economics, politics - Australia, politics - New Zealand, politics - USA, population economics, poverty and inequality, welfare reform
Tags: Australia, British economy, Canada, child poverty, economics of the family, family poverty, Ireland, single mothers, single parents
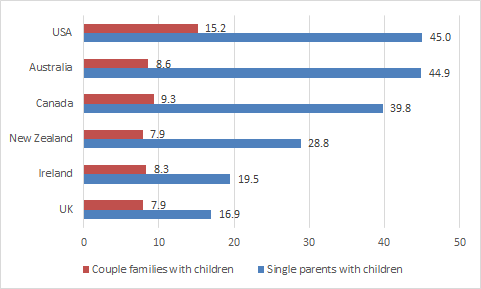
Figure 1: Child poverty rates by family type, Anglo-Saxon countries, 2010
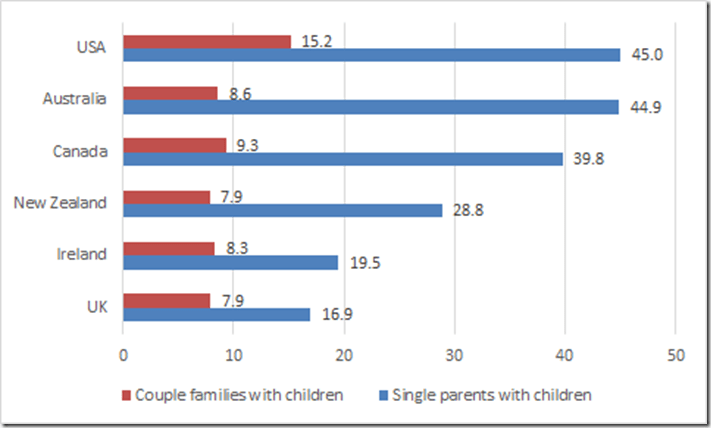
Source: OECD Family Database; Poverty thresholds are set at 50% of the median income of the entire population.
21 Jun 2015
by Jim Rose
in applied welfare economics, economic history, Gary Becker, politics - Australia, politics - New Zealand, politics - USA, population economics, technological progress
Tags: Australia, British economy, Canada, life expectancy, lost decades, New Zealand, The Great Enrichment
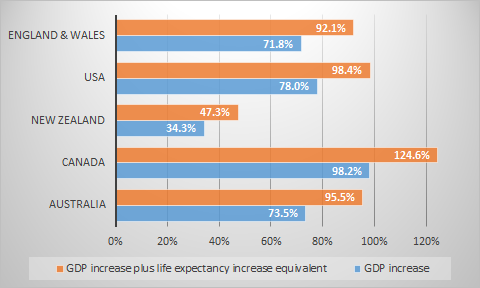
Figure 1: increase in real GDP and increase in real GDP plus life expectancy GDP increase equivalent, Australia, New Zealand, Canada, USA and England & Wales, 1965 to 1995
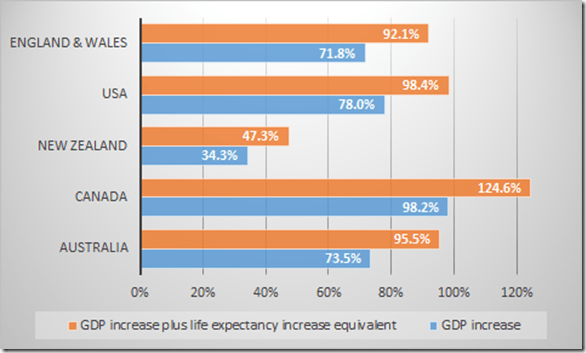
Source: Becker, Gary S., Tomas J. Philipson, and Rodrigo R. Soares. The Quantity and Quality of Life and the Evolution of World Inequality, NBER Working Paper No. 9765 (June 2003).
GDP per capita is usually used to proxy for the quality of life of individuals living in different countries. Becker and his co-authors computed a "full" growth rate that incorporates the gains in health and life expectancy.
Figure 1 shows that New Zealand was way behind the other countries in improvements in the quantity and quality of life between 1965 and 1995. This brings new meaning to the two decades of lost growth between 1973 and 1995. Canada should refer to 1965 to 1995 as its golden era.
21 Jun 2015
by Jim Rose
in economics of love and marriage, labour economics, labour supply, law and economics, politics - Australia, politics - New Zealand, politics - USA, population economics, poverty and inequality, welfare reform
Tags: Australia, British economy, Canada, child poverty, economics of families, family poverty, Ireland, labour force participation, single parents
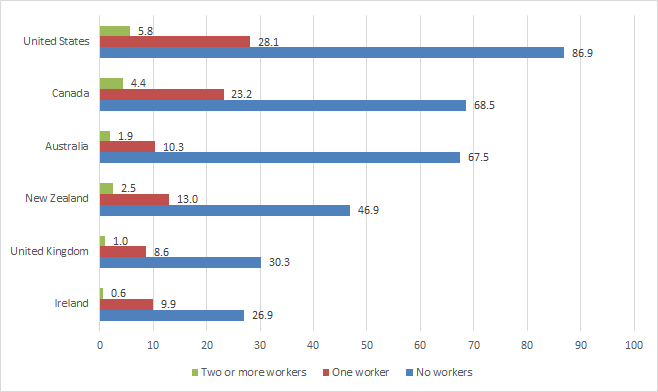
Figure 1: child poverty rates in couple families by employment status, Anglo-Saxon countries, 2010
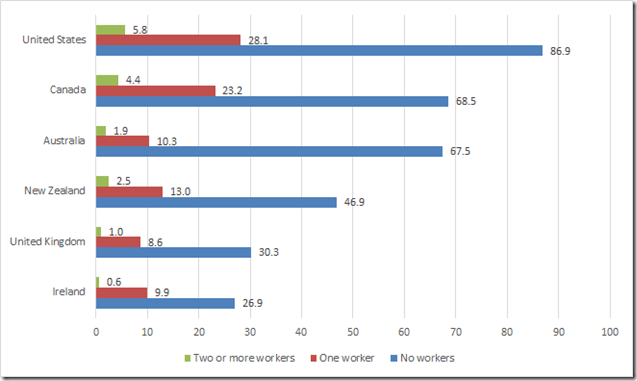
Source: OECD Family Database; Poverty thresholds are set at 50% of the median income of the entire population.
20 Jun 2015
by Jim Rose
in labour economics, politics - Australia, politics - New Zealand, politics - USA, poverty and inequality, welfare reform
Tags: Australia, British economy, Canada, child poverty, economics of the family, family poverty, female labour force participation rates, Ireland, maternal labour supply, single mothers, single parents
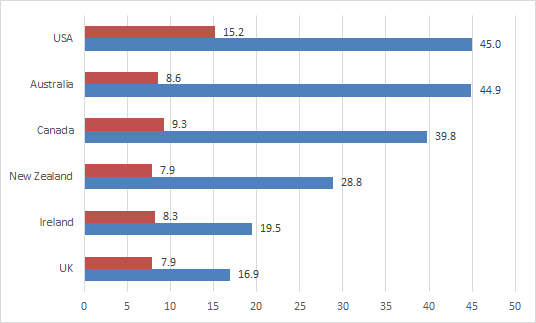
Figure 1: Child poverty rate by employment status of single parent, Anglo-Saxon countries, 2010
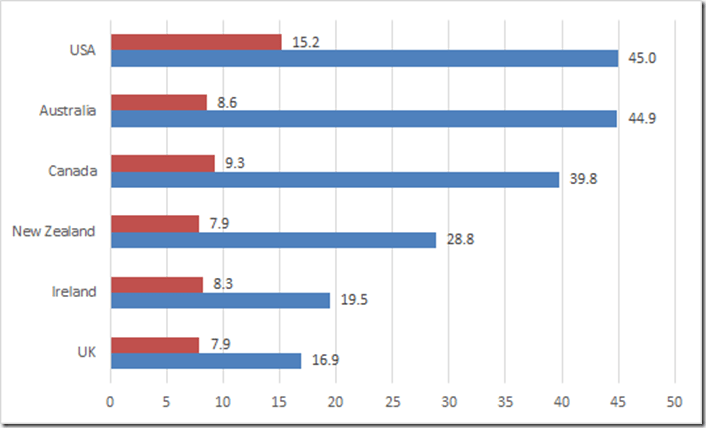
Source: OECD Family Database; Poverty thresholds are set at 50% of the median income of the entire population.
Previous Older Entries Next Newer Entries






Recent Comments