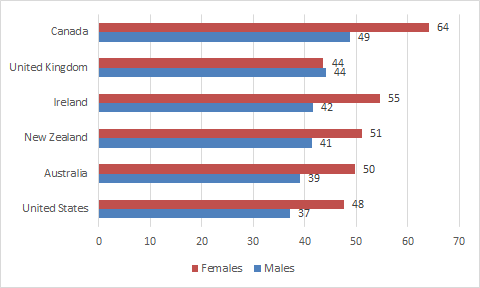
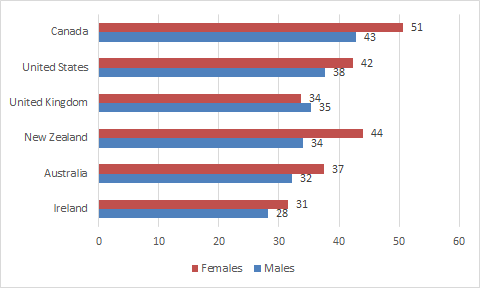
What are the Anglo-Saxon gender wage gaps for the bottom, median and top deciles?

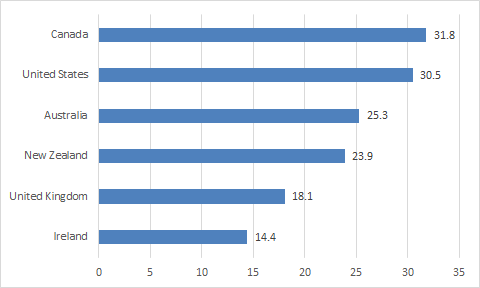
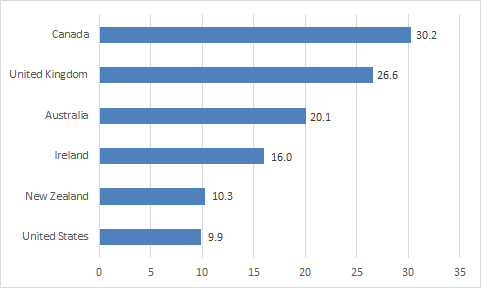
If there is an inherent inequality of bargaining power between workers and employers, as we are so frequently lectured by those in the self appointed know, why is the gender wage gap so small at the bottom of the earnings distribution?

Figure 1: % Gender gap in full-time earnings at the bottom decile of earnings distribution, 2012

image

Source: OECD family database

Figure 2: % Gender gap in full-time earnings at the median decile of earnings distribution, 2012

image

Source: OECD family database

Figure 3: % Gender gap in full-time earnings at the top decile of earnings distribution, 2012

image

Source: OECD family database

The gender gaps are unadjusted, and are calculated as the difference between the earnings of men and women for their respective earnings percentile.

What are the Anglo-Saxon gender wage gaps?

Figure 1: % gender gap in median earnings of full-time employees, 2012

image

Source: OECD family database

Which Anglo-Saxon country has the highest after-tax minimum wage?

Figure 1: Minimum wage after income tax and social security contributions, US$ PPP, Anglo-Saxon countries, 2013

image

Source: OECD Focus on Minimum Wages after the crisis 2015

How much of the top 0.1% are now working rich in the USA, 1916–2013, and Canada, 1946–2007

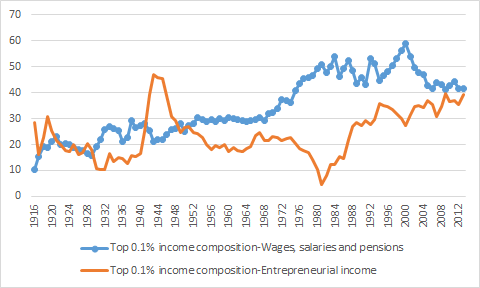
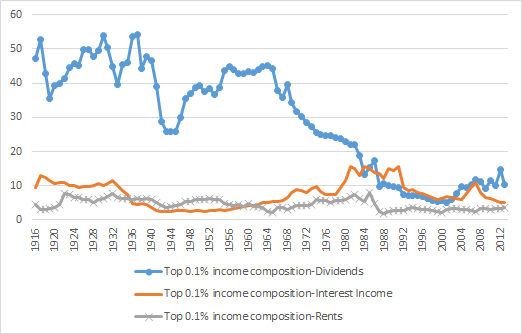
Piketty and Saez (2003) concluded that a substantial fraction of the rise in top incomes was due to surging top wage incomes. They concluded that top executives (the ‘working rich’) replaced top capital owners (the ‘rentiers’) at the top of the income hierarchy.

That conclusion still holds for both the USA and Canada. The largest portion of the top 0.1% in both countries have become those earning wages. The top 0.1% are top wage earners who work for their livings founding, building or directing businesses.

Figure 1: percentage of top 0.1% with wages, salaries, pensions or entrepreneurial incomes, USA, 1916 – 2013

image

Source: Alvaredo, Facundo, Anthony B. Atkinson, Thomas Piketty and Emmanuel Saez, The World Top Incomes Database.

Figure 2: percentage of top 0.1% with incomes from interest, dividends and rents, USA, 1916 – 2013

image

Source: Alvaredo, Facundo, Anthony B. Atkinson, Thomas Piketty and Emmanuel Saez, The World Top Incomes Database.

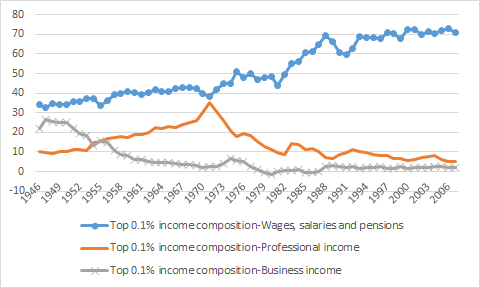
Figure 3: percentage of top 0.1% with wage salary and pension incomes, business incomes  and professional incomes,  Canada, 1946 – 2007

image

source : Alvaredo, Facundo, Anthony B. Atkinson, Thomas Piketty and Emmanuel Saez, The World Top Incomes Database.

Figure 4: percentage of top 0.1% with dividend, interest or investment incomes,  Canada, 1946 – 2007

image

Source: Alvaredo, Facundo, Anthony B. Atkinson, Thomas Piketty and Emmanuel Saez, The World Top Incomes Database.

Is Canada diverging from Australia in labour productivity to become like New Zealand?

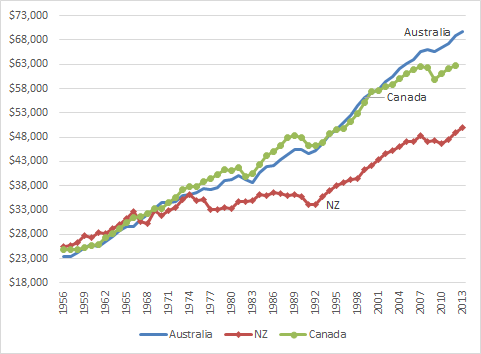
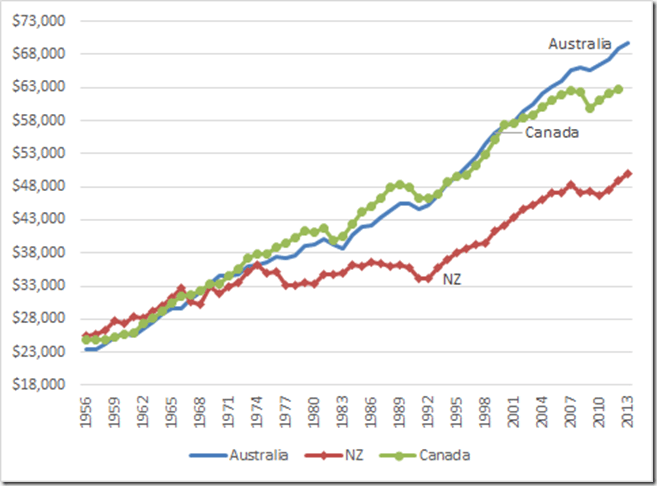
Figure 1 shows that Canada has been diverging from Australia in real GDP per working age person since the mid-1990s particularly since the global financial crisis.

Figure 1: Real GDP per New Zealander, Canadian and Australian aged 15-64, converted to 2013 price level with updated 2005 EKS purchasing power parities, 1956-2013
image

Source: Computed from OECD StatExtract and The Conference Board, Total Database, January 2014, http://www.conference-board.org/economics

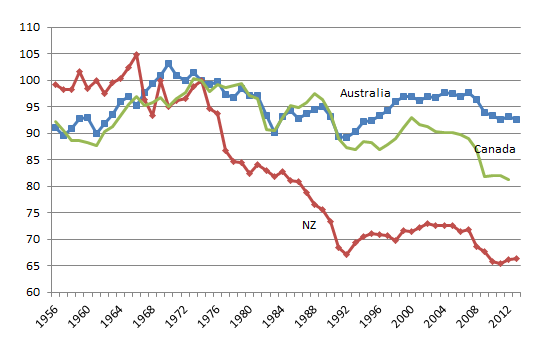
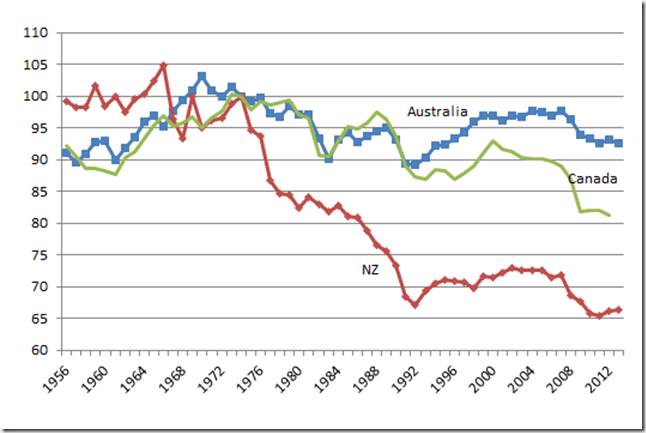
In common with New Zealand, Figure 2 shows that Canadian productivity has been in a pretty much along declines is about 1974, rarely catching up with any lost ground. Figure 1 shows that Canada used to be richer than Australia but is now poorer than Australia. Figure 2 is real GDP growth data detrended by the growth rate of the USA in the 20th century. A flat line in figure 2 is annual real GDP growth at 1.9%; a rising line is growth above 1.9%; a falling line is annual growth below 1.9% a year.

Figure 2: Real GDP per New Zealander, Canadian and Australian aged 15-64, converted to 2013 price level with updated 2005 EKS purchasing power parities, 1.9 per cent detrended, 1956-2013
image

Source: Computed from OECD StatExtract and The Conference Board, Total Database, January 2014, http://www.conference-board.org/economics

Figure 2 shows that Canadian productivity has been below trend for perhaps 30 years. There has been the  occasional recovery but followed by a further decline. If Canadian labour productivity had grown at the same rate as the USA since 1974, labour productivity in Canada is something like 18% better.

Australia, as shown in figure 2, has neither caught up nor falling behind the USA in labour productivity for the entire post-war period since 1956. Canada has been falling behind its neighbour most markedly since the mid-1970s.

  • Canada fell 10 percentage points further behind the USA in relative labour productivity between the mid-1970s and the mid-1990s.
  • Canada stopped falling further behind the USA after 1995 to 2005 but, in common with New Zealand, Canadian labour productivity did not rebound to recover the prior lost ground.

The proximate causes of the Canadian productivity gap with the USA have a familiar echo to New Zealand ears. Relative to the USA, Rao et al. (2006) and Sharp (2003) attributed the gap to less capital per worker, an innovation gap as shown by lower R&D expenditure, a smaller and less dynamic high technology sector, less developed human capital at the top end of the labour market, and more limited scale and scope economies.

These factors have been put forward, at one time or another, as the proximate causes of the New Zealand productivity gap with the USA. Identifying the barriers to higher Canadian productivity may offer fresh insights into removing similar productivity barriers in New Zealand.

Canada, New Zealand and Australia should be catching-up with the USA in productivity per capita because copying the global leader is cheaper than innovation. Canada, New Zealand and Australia all have the basics to do this: a market economy, the rule of law and openness to foreign technology and international trade.

Instead of asking why New Zealand is not catching-up with Australian productivity, further study of the lack of productivity catch-up of Australia and Canada with the USA may uncover subtle barriers to productivity growth with similarities in New Zealand.

The productivity decline in Canada is of interest in New Zealand because Canada certainly cannot blame remoteness because it borders the USA. Canada cannot blame lack of size because it is noticeably larger than Australia and certainly New Zealand.
Tax revenue as a percentage of GDP for the European offshoots (USA, Canada, Australia and New Zealand), 1965–2013

The tax take is noticeably higher in Canada and New Zealand and has been for a long time.

Figure 1: US, Canadian, Australian and New Zealand tax revenues as a percentage of GDP, 1965–2013

image

Source: OECD StatExtract.

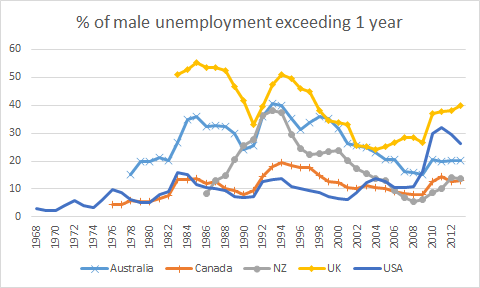
Long-term unemployment by sex, Australia, Canada, New Zealand, UK and USA, 1968 – 2013

image

Source: OECD StatExtract

image

Source: OECD StatExtract

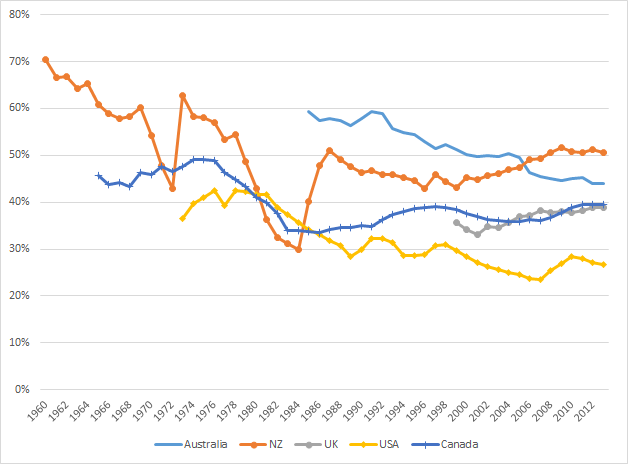
Trade union density, Australia, Canada, New Zealand, UK and USA, 1960–2012

image

Source: OECD StatExtract

Minimum wage relative to average wage of full-time worker, UK, USA, Canada, New Zealand and Australia, 1960–2012

Figure 1: minimum wage relative to median wage in full-time worker, UK, USA, Canada, New Zealand and Australia, 1960 – 2012

image

Source: OECD StatExtract

Figure 2: minimum wage relative to mean wage in full-time worker, UK, USA, Canada, New Zealand and Australia, 1960 – 2012

image

Source: OECD StatExtract

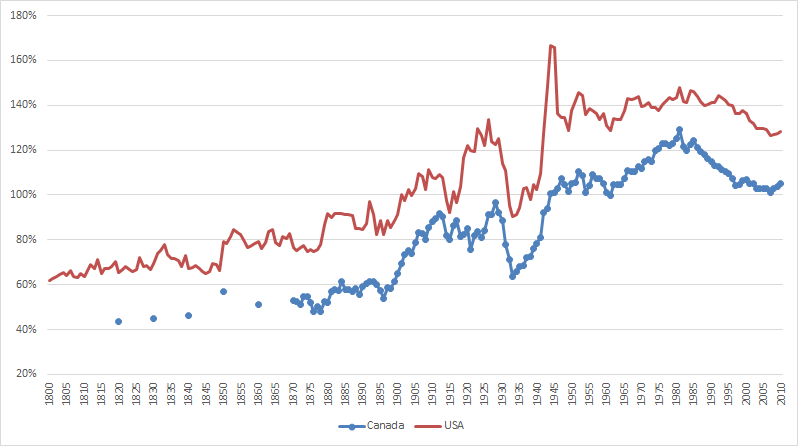
US and Canadian real GDP per capita as a percentage of British GDP per capita, 1800–2010

Figure 1: US and Canadian real GDP per capita are as percentage of British GDP per capita (1990 Int. GK$PPP), 1800 – 2010

image

Source: The Maddison-Project, http://www.ggdc.net/maddison/maddison-project/home.htm 2013 version.

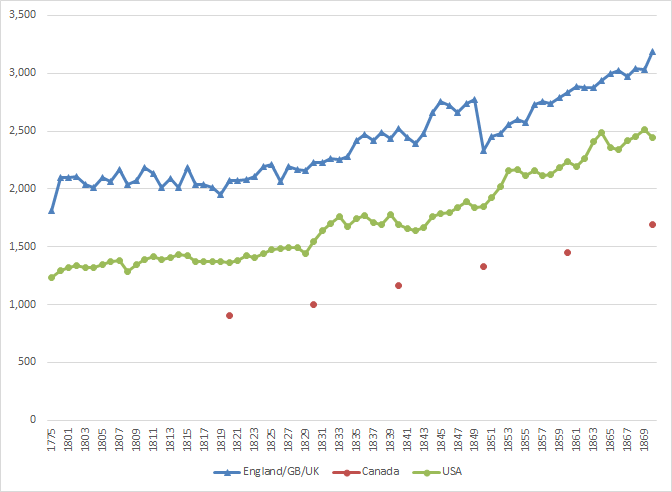
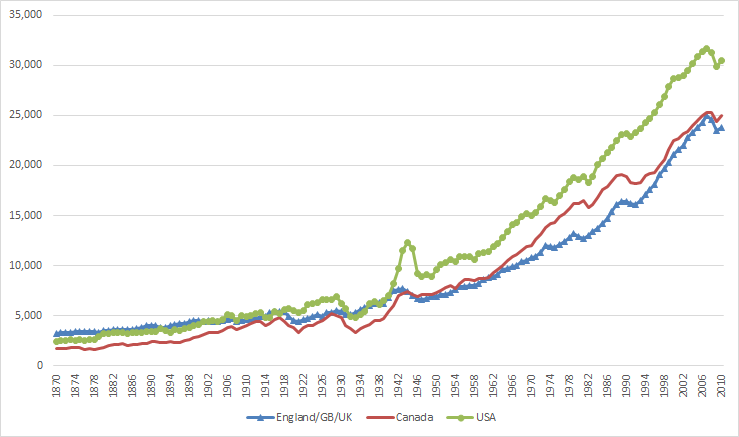
Colonial upstarts! British, American and Canadian real GDP per capita, 1775–2010

The USA only overtook Britain in per capita GDP per capita in purchasing power parity terms early in the 20th century. Canada overtook the mother country in the post-war period.

Figure 1:  British, American and Canadian GDP per capita (1990 Int. GK$PPP), 1775 – 2010

image

Source: The Maddison-Project, http://www.ggdc.net/maddison/maddison-project/home.htm 2013 version.

Figure 2:  British, American  and Canadian GDP per capita (1990 Int. GK$PPP), 1775 – 1870

image

Source: The Maddison-Project, http://www.ggdc.net/maddison/maddison-project/home.htm 2013 version.

Figure 3:  British, American and Canadian GDP per capita (1990 Int. GK$PPP), 1870 – 2010

image

Source: The Maddison-Project, http://www.ggdc.net/maddison/maddison-project/home.htm 2013 version.

A volatile depressed neighbour? Real American and Canadian GDP growth detrended, 1955-2013 – updated

Figure 1: Real GDP per American and Canadian aged 15-64, converted to 2013 price level with updated 2005 EKS purchasing power parities, 1955-2013

image

Source: Computed from OECD Stat Extract and The Conference Board, Total Database, January 2014, http://www.conference-board.org/economics

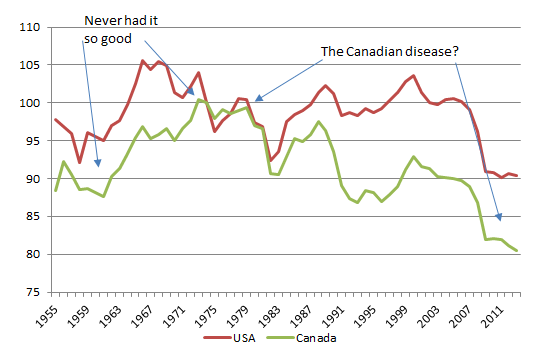
Figure 2: Real GDP per American and Canadian aged 15-64, converted to 2013 price level with updated 2005 EKS purchasing power parities, 1.9 per cent detrended, 1955-2013

image

Source: Computed from OECD Stat Extract and The Conference Board, Total Database, January 2014, http://www.conference-board.org/economics

A rising line in figure 2 is above trend rate growth; a flat line is trend growth of 1.9%; and a falling line is below trend growth.

Canada has a volatile ride in the post-war period after economic success up until 1975. Despite ups and downs the Canadian economy has been in a long-term decline since 1975. Growth as  rarely being at trend and was often below, sometimes sharply below trend.

None of these depressed periods in the Canadian economy were long enough to count as a great depression. Instead there was just a long-term decline.

Canada is next door to the USA and a member of the North American Free Trade Area (NAFTA) and its antecedents so its cannot blame distance nor small size for its decline in economic performance as some do in New Zealand.
Relative to the USA, Rao et al. (2006) and Sharp (2003) attributed the gap between the USA and Canada to less capital per Canadian worker, an innovation gap as shown by lower R&D expenditure in Canada, a smaller and less dynamic high technology sector in Canada, less developed human capital at the top end of the Canadian labour market, and more limited scale and scope economies in Canada.

These factors have been put forward, at one time or another, as the proximate causes of the New Zealand productivity gap with the USA. Identifying the barriers to higher Canadian productivity may offer fresh insights into removing similar productivity barriers in New Zealand.
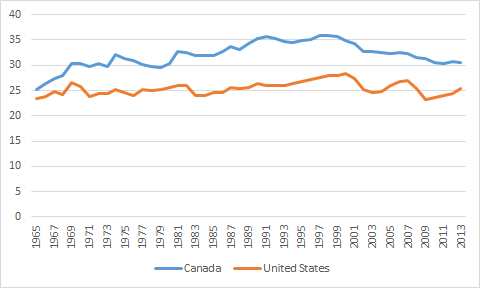
Figure 3 suggests that the increase in tax revenues as a percentage of GDP from 30% to 35% at the same time as the Canadian economic boom came to an end and its economic decline began is worthy of further scrutiny. The strong economic recovery from 1995 onwards also  coincided with the decline tax revenues as a percentage  of GDP.

Figure 3: tax revenue as a percentage of GDP

image

Source: OECD StatExtract

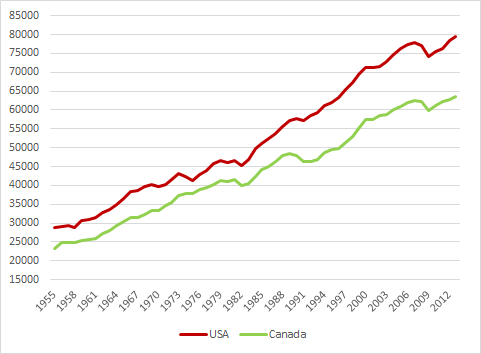
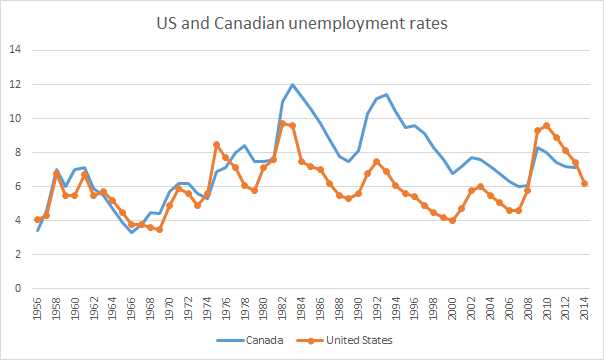
US and Canadian unemployment rates, 1956–2014

image

Source: OECD StatExtract

Unemployed people are defined as those who report that they are without work, that they are available for work and that they have taken active steps to find work in the last four weeks.

The ILO Guidelines specify what actions count as active steps to find work; these include answering vacancy notices, visiting factories, construction sites and other places of work, and placing advertisements in the press as well as registering with labour offices.

Recoveries from recessions across the G-7

The GOP is building a wall on the wrong border

Image

Previous Older Entries Next Newer Entries

Thoughts from the North

Celebrating humanity's flourishing through the spread of capitalism and the rule of law

Fardels Bear

A History of the Alt-Right

Vincent Geloso

Econ Prof at George Mason University, Economic Historian, Québécois

Bassett, Brash & Hide

Celebrating humanity's flourishing through the spread of capitalism and the rule of law

Truth on the Market

Scholarly commentary on law, economics, and more

The Undercover Historian

Beatrice Cherrier's blog

Matua Kahurangi

Celebrating humanity's flourishing through the spread of capitalism and the rule of law

Temple of Sociology

Celebrating humanity's flourishing through the spread of capitalism and the rule of law

Velvet Glove, Iron Fist

Celebrating humanity's flourishing through the spread of capitalism and the rule of law

Why Evolution Is True

Why Evolution is True is a blog written by Jerry Coyne, centered on evolution and biology but also dealing with diverse topics like politics, culture, and cats.

NoTricksZone

Celebrating humanity's flourishing through the spread of capitalism and the rule of law

Homepaddock

A rural perspective with a blue tint by Ele Ludemann

Kiwiblog

DPF's Kiwiblog - Fomenting Happy Mischief since 2003

The Dangerous Economist

Celebrating humanity's flourishing through the spread of capitalism and the rule of law

Watts Up With That?

The world's most viewed site on global warming and climate change

The Logical Place

Tim Harding's writings on rationality, informal logic and skepticism

Doc's Books

A window into Doc Freiberger's library

The Risk-Monger

Let's examine hard decisions!

Uneasy Money

Commentary on monetary policy in the spirit of R. G. Hawtrey

Barrie Saunders

Thoughts on public policy and the media

Liberty Scott

Celebrating humanity's flourishing through the spread of capitalism and the rule of law

Point of Order

Politics and the economy

James Bowden's Blog

A blog (primarily) on Canadian and Commonwealth political history and institutions

Science Matters

Reading between the lines, and underneath the hype.

Peter Winsley

Economics, and such stuff as dreams are made on

A Venerable Puzzle

"The British constitution has always been puzzling, and always will be." --Queen Elizabeth II

The Antiplanner

Celebrating humanity's flourishing through the spread of capitalism and the rule of law

Bet On It

Celebrating humanity's flourishing through the spread of capitalism and the rule of law

History of Sorts

WORLD WAR II, MUSIC, HISTORY, HOLOCAUST

Roger Pielke Jr.

Undisciplined scholar, recovering academic

Offsetting Behaviour

Celebrating humanity's flourishing through the spread of capitalism and the rule of law

JONATHAN TURLEY

Res ipsa loquitur - The thing itself speaks

Conversable Economist

In Hume’s spirit, I will attempt to serve as an ambassador from my world of economics, and help in “finding topics of conversation fit for the entertainment of rational creatures.”

The Victorian Commons

Researching the House of Commons, 1832-1868

The History of Parliament

Articles and research from the History of Parliament Trust

Books & Boots

Reflections on books and art

Legal History Miscellany

Posts on the History of Law, Crime, and Justice

Sex, Drugs and Economics

Celebrating humanity's flourishing through the spread of capitalism and the rule of law

European Royal History

Exploring the Monarchs of Europe

Tallbloke's Talkshop

Cutting edge science you can dice with

Marginal REVOLUTION

Small Steps Toward A Much Better World

NOT A LOT OF PEOPLE KNOW THAT

“We do not believe any group of men adequate enough or wise enough to operate without scrutiny or without criticism. We know that the only way to avoid error is to detect it, that the only way to detect it is to be free to inquire. We know that in secrecy error undetected will flourish and subvert”. - J Robert Oppenheimer.

STOP THESE THINGS

The truth about the great wind power fraud - we're not here to debate the wind industry, we're here to destroy it.

Lindsay Mitchell

Celebrating humanity's flourishing through the spread of capitalism and the rule of law

Alt-M

Celebrating humanity's flourishing through the spread of capitalism and the rule of law