Speaking engagements very lucrative secondary career for public figures
statista.com/chart/3525/was… http://t.co/YNuQb51Ekk—
Statista (@StatistaCharts) June 04, 2015
How much are the top speakers paid?
21 Jun 2015 Leave a comment
in economics of media and culture, entrepreneurship, human capital, labour economics, labour supply Tags: entrepreneurial alertness, superstar wages, superstars, top 1%
US income taxes are highly progressive
19 Jun 2015 Leave a comment
in politics - USA, public economics Tags: earned income tax credit, family tax credits, progressive income taxes, tax incidence, top 1%, welfare state
Why do these top 0.1 percenters get a pass from the Occupied Movement and Twitter Left?
15 Jun 2015 Leave a comment
in applied welfare economics, economics of media and culture, income redistribution, movies, politics - USA, poverty and inequality, Public Choice, TV shows Tags: comedy, Left-wing hypocrisy, Leftover Left, Occupy Wall Street, top 1%, Twitter left
The 25 richest comedians (or why not to go into standup comedy) from @randal_olson randalolson.com/2015/03/04/top… http://t.co/cp3lSnuPOf—
Tyler Vigen (@TylerVigen) March 17, 2015
The Value of Steve Jobs
15 Jun 2015 Leave a comment
in entrepreneurship, industrial organisation, managerial economics Tags: CEO pay, superstar wages, superstars, top 1%

| Peter Klein |
As you have likely heard, Steve Jobs is taking an indeterminate leave of absence from Apple to deal with his continuing health problems. How will this affect Apple? How important is one person — albeit the founder and CEO — to a diversified multinational company with tens of thousands of employees? Apple’s stock slipped slightly on the news of Jobs’ leave (down 2.3 percent today, the first trading day after the announcement), but Jobs’s health problems are well known and Apple’s stock price presumably already included a discount reflecting the possibility he’d step down. To estimate the value of a particular employee to the firm in this way, we need an unanticipated departure, one that isn’t a response to poor performance and isn’t expected in advance.
Sure, enough, there’s an app for that — I mean, there’s a literature on that. An influential 1985 paper by Bruce Johnson, Robert Magee, Nandu…
View original post 429 more words
Supplements to wages and salaries have grown dramatically, but labour compensation inequality has not
12 Jun 2015 Leave a comment
in applied price theory, applied welfare economics, politics - Australia, politics - New Zealand, politics - USA Tags: Leftover Left, Piketty, top 1%
Gross Domestic Income (GDI) is a complete measure of all income earned in the United States. About half is wages, salaries, and benefits. A quarter goes to business-level taxes and the replacement of worn out machinery. Another quarter of gross domestic income is returned to owners of capital, including business owners and private homeowners.
The shares of income returned to workers and owners of capital remain constant over time once benefits, taxes, and depreciation are accounted for – two-thirds of net income goes to labour and one-third goes to capital.
Rather than focus on shares of GDP, a recent preoccupation of the Left over Left, we should focus on shares of labour compensation, that is, wages, salaries and fringe benefits. Both Piketty and his critics agree on that.

via A Walkthrough of Gross Domestic Income | Tax Foundation.
Why no (top 1% driven) middle class wage stagnation in (non-unionised) technologically progressive industries?
11 Jun 2015 Leave a comment
.@CEAChair: Higher productivity needed for increases in income on.wsj.com/1E4jGDQ @MarkMuro1 Agreed. Proof here http://t.co/oZ76aeQdiq—
Jonathan T. Rothwell (@jtrothwell) March 11, 2015
Wages & productivity are growing together in high R&D-STEM industries brook.gs/1D5Pqxc @CEAChair @MarkMuro1 http://t.co/fe5MDomJqE—
Jonathan T. Rothwell (@jtrothwell) March 11, 2015
Why did the top 1% only pick on men when they increased inequality over recent decades?
06 Jun 2015 Leave a comment
in discrimination, gender, human capital, labour economics, labour supply, unions Tags: gender wage gap, middle class stagnation, reversing gender gap, superstar wages, superstars, top 1%, wage stagnation
Gender pay gap in corporate America twitter.com/BuzzFeedAndrew… http://t.co/AOFxcUQ8Rk—
Charts and Maps (@ChartsandMaps) April 12, 2015
Some think that some members of the top 0.1% are underpaid
05 Jun 2015 Leave a comment
in labour economics, sports economics Tags: baseball, superstar wages, superstars, top 0.1%, top 1%
Why Baseball Players Are Actually Underpaid theatlantic.com/business/archi… | http://t.co/qBgcmxLWca—
Charts and Maps (@ChartsandMaps) April 04, 2015
Major league baseball salary growth is slowing http://t.co/Jw6gYG1ylQ—
Charts and Maps (@ChartsandMaps) April 04, 2015
Baseball salaries hit a record high http://t.co/AfvlMEVHbf—
Charts and Maps (@ChartsandMaps) April 12, 2015
Who among the top 1% and top 0.1% increased their share of income most between 1979 and 2005?
03 Jun 2015 Leave a comment
in economic history, entrepreneurship, financial economics, human capital, industrial organisation, labour economics, labour supply, occupational choice, survivor principle Tags: CEO pay, entrepreneurial alertness, Occupy Wall Street, separation of ownership and control, superstar wages, superstars, top 0.1%, top 1%, Twitter left
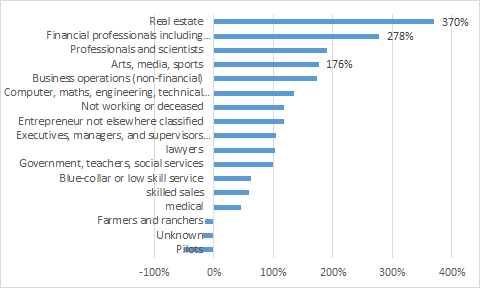
The members of the top 1% whose income increased the most between 1979 and 2005 were real estate professionals followed by financial professionals – see figure 1.
Figure 1: increase in share of national income (including capital gains) received by top 1% for each primary taxpayer occupation in top 1% between 1979 and 2005
Source: Jon Bakija, Adam Cole and Bradley T. Heim “Jobs and Income Growth of Top Earners and the Causes of Changing Income Inequality: Evidence from U.S. Tax Return Data”.
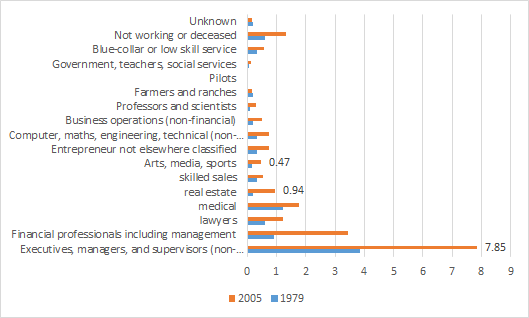
Figure 2 shows that the fastest-growing shares among the top 1% as in figure 1 are not necessarily the largest occupational group are those income earners. Moreover, their fortunes seem largely unrelated to each other.
Figure 2: Percentage of national income (including capital gains) received by top 1%, and each primary taxpayer occupation in top 1%
Source: Jon Bakija, Adam Cole and Bradley T. Heim “Jobs and Income Growth of Top Earners and the Causes of Changing Income Inequality: Evidence from U.S. Tax Return Data”.
The next members of the top 1% in terms of income growth were rather respectable group:professionals and scientists and arts, media and sports. The latter,arts, media and sports get a complete pass on their membership of the top 1% despite their great success in increasing their incomes since 1979 at the expense apparently on the bottom 99% if the Twitter Left is to be believed.
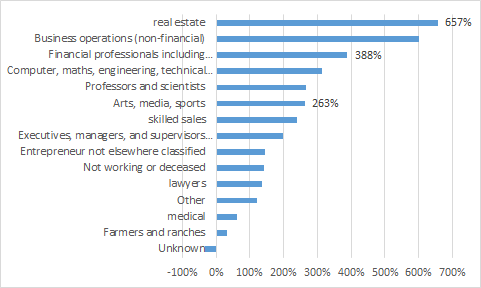
Figure 3: increase in share of national income (including capital gains) received by top 0.1% for each primary taxpayer occupation in top 0.1%between 1979 and 2005
Source: Jon Bakija, Adam Cole and Bradley T. Heim “Jobs and Income Growth of Top Earners and the Causes of Changing Income Inequality: Evidence from U.S. Tax Return Data”.
Arts, media and sports superstars are one of the fastest-growing members of the top 0.1% – see figure 3. Again, the arts, media and sports superstars get a complete pass on their membership of the top 0.1% from the Twitter Left. Most of the other occupations in the top 0.1% don’t strike me as anything other than working rich – see figure 3 and figure 4.
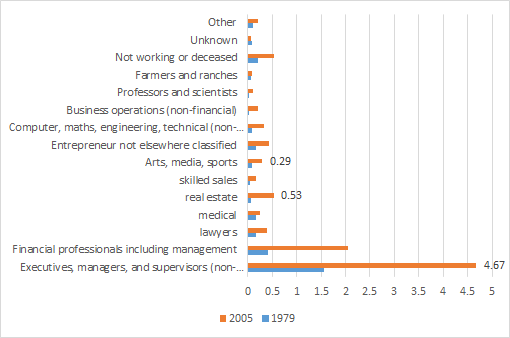
As with the top 1%, the top 0.1% of income earners are a mixed bag of occupations – see figure 4. Their fortunes are unrelated to each other terms of the forces driving there are increased incomes.
Figure 4: Percentage of national income (including capital gains) received by top 0.1%, and each primary taxpayer occupation in top 0.1%
Source: Jon Bakija, Adam Cole and Bradley T. Heim “Jobs and Income Growth of Top Earners and the Causes of Changing Income Inequality: Evidence from U.S. Tax Return Data”.
How much of the top 0.1% are now working rich in the USA, 1916–2013, and Canada, 1946–2007
01 Jun 2015 Leave a comment
in economic history, entrepreneurship, human capital, industrial organisation, labour economics, labour supply, occupational choice, survivor principle Tags: Canada, CEO pay, creative destruction, entrepreneurial alertness, super-entrepreneurs, superstar wages, superstars, top 0.1%, top 1%, working rich
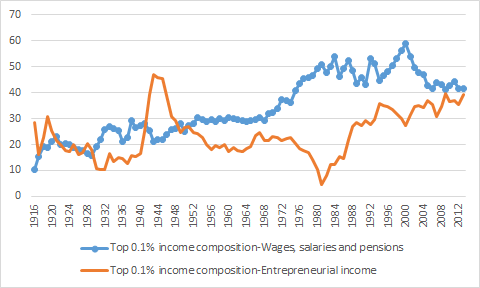
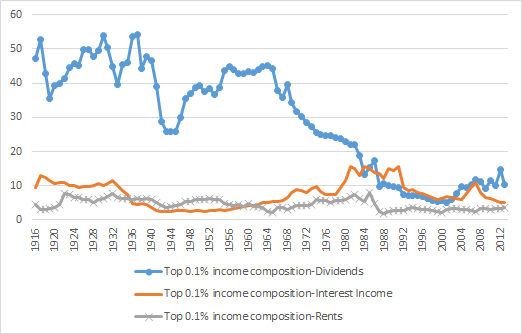
Piketty and Saez (2003) concluded that a substantial fraction of the rise in top incomes was due to surging top wage incomes. They concluded that top executives (the ‘working rich’) replaced top capital owners (the ‘rentiers’) at the top of the income hierarchy.
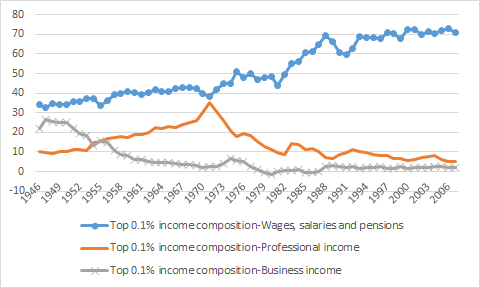
That conclusion still holds for both the USA and Canada. The largest portion of the top 0.1% in both countries have become those earning wages. The top 0.1% are top wage earners who work for their livings founding, building or directing businesses.
Figure 1: percentage of top 0.1% with wages, salaries, pensions or entrepreneurial incomes, USA, 1916 – 2013
Source: Alvaredo, Facundo, Anthony B. Atkinson, Thomas Piketty and Emmanuel Saez, The World Top Incomes Database.
Figure 2: percentage of top 0.1% with incomes from interest, dividends and rents, USA, 1916 – 2013
Source: Alvaredo, Facundo, Anthony B. Atkinson, Thomas Piketty and Emmanuel Saez, The World Top Incomes Database.
Figure 3: percentage of top 0.1% with wage salary and pension incomes, business incomes and professional incomes, Canada, 1946 – 2007
source : Alvaredo, Facundo, Anthony B. Atkinson, Thomas Piketty and Emmanuel Saez, The World Top Incomes Database.
Figure 4: percentage of top 0.1% with dividend, interest or investment incomes, Canada, 1946 – 2007

Source: Alvaredo, Facundo, Anthony B. Atkinson, Thomas Piketty and Emmanuel Saez, The World Top Incomes Database.
Does Inequality Reduce Economic Growth: A Sceptical View
30 May 2015 Leave a comment
in applied price theory, applied welfare economics, comparative institutional analysis, development economics, economic history, entrepreneurship, growth disasters, growth miracles, income redistribution, politics - Australia, politics - New Zealand, politics - USA, Public Choice, public economics, rentseeking Tags: entrepreneurial alertness, Leftover Left, taxes and the labour supply, The inequality and growth, Thomas Piketty, top 1%, Twitter left
Tim Taylor, the editor of the Journal of Economic Perspectives, has written a superb blog post on why we should be sceptical about a strong relationship between inequality and economic growth. Taylor was writing in response to the OECD’s recent report "In It Together: Why Less Inequality Benefits All,".
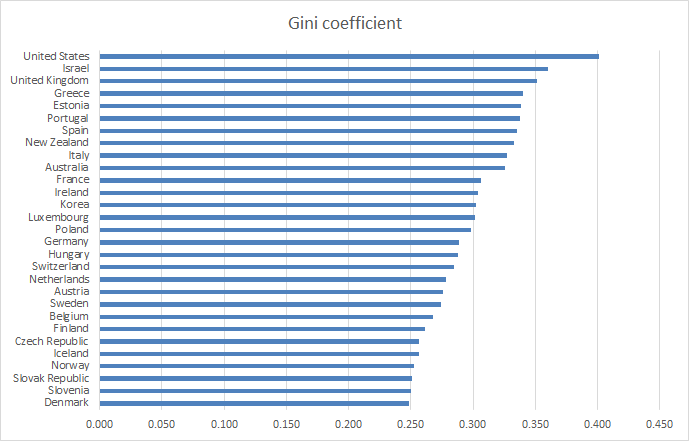
Taylor’s basic point is economists have enough trouble working out what causes economic growth so trawling within that subset of causes to quantify the effects of rising or falling inequality inequality seems to be torturing the data to confess. The empirical literature is simply inconclusive as Taylor says:
A variety of studies have undertaken to prove a connection from inequality to slower growth, but a full reading of the available evidence is that the evidence on this connection is inconclusive.
Most discussions of the link between inequality and growth are notoriously poor of theories connecting two. There are three credible theories in all listed in the OECD’s report:
The report first points out (pp. 60-61 that as a matter of theory, one can think up arguments why greater inequality might be associated with less growth, or might be associated with more growth. For example, inequality could result less growth if:
1) People become upset about rising inequality and react by demanding regulations and redistributions that slow down the ability of an economy to produce growth;
2) A high degree of persistent inequality will limit the ability and incentives of those in the lower part of the income distribution to obtain more education and job experience; or
3) It may be that development and widespread adoption of new technologies requires demand from a broad middle class, and greater inequality could limit the extent of the middle class.
About the best theoretical link between inequality and economic growth is what Taylor calls the "frustrated people killing the goose that lays the golden eggs." Excessive inequality within a society results in predatory government reactions at the behest of left-wing or right-wing populists.

Taylor refers to killing the goose that laid the golden egg as dysfunctional societal and government responses to inequality. He is right but that is not how responses to inequality based on higher taxes and more regulation are sold. Thomas Piketty is quite open about he wants a top tax rate of 83% and a global wealth tax to put an end to high incomes:
When a government taxes a certain level of income or inheritance at a rate of 70 or 80 percent, the primary goal is obviously not to raise additional revenue (because these very high brackets never yield much).
It is rather to put an end to such incomes and large estates, which lawmakers have for one reason or another come to regard as socially unacceptable and economically unproductive…
The left-wing parties don’t say let’s put up taxes and redistribute so that is not something worse and more destructive down the road. Their argument is redistribution will increase growth or at least not harm it. That assumes the Left is addressing this issue of not killing the goose that lays the golden egg at all.

Once you discuss the relationship between inequality and growth in any sensible way you must remember your John Rawls. Incentives encourage people to work, save and invest and channels them into the occupations where they make the most of their talents. Taylor explains:
In the other side, inequality could in theory be associated with faster economic growth if: 1) Higher inequality provides greater incentives for people to get educated, work harder, and take risks, which could lead to innovations that boost growth; 2) Those with high incomes tend to save more, and so an unequal distribution of income will tend to have more high savers, which in turn spurs capital accumulation in the economy.
Taylor also points out that the OECD’s report is seriously incomplete by any standards because it fails to mention that inequality initially increases in any poor country undergoing economic development:
The report doesn’t mention a third hypothesis that seems relevant in a number of developing economies, which is that fast growth may first emerge in certain regions or industries, leading to greater inequality for a time, before the gains from that growth diffuse more widely across the economy.
At a point in its report, the OECD owns up to the inconclusive connection between economic growth and rising inequality as Taylor notes:
The large empirical literature attempting to summarize the direction in which inequality affects growth is summarised in the literature review in Cingano (2014, Annex II).
That survey highlights that there is no consensus on the sign and strength of the relationship; furthermore, few works seek to identify which of the possible theoretical effects is at work. This is partly tradeable to the multiple empirical challenges facing this literature.
The OECD’s report responds to this inclusiveness by setting out an inventory of tools with which you can torture the data to confess to what you want as Taylor notes:
There’s an old saying that "absence of evidence is not evidence of absence," in other words, the fact that the existing evidence doesn’t firmly show a connection from greater inequality to slower growth is not proof that such a connection doesn’t exist.
But anyone who has looked at economic studies on the determinants of economic growth knows that the problem of finding out what influences growth is very difficult, and the solutions aren’t always obvious.
The chosen theory of the OECD about the connection between inequality and economic growth is inequality leads to less investment in human capital at the bottom part of the income distribution.
[Inequality] tends to drag down GDP growth, due to the rising distance of the lower 40% from the rest of society. Lower income people have been prevented from realising their human capital potential, which is bad for the economy as a whole
I found this choice of explanation curious. So did Taylor as the problem already seems to have been solved:
There are a few common patterns in economic growth. All high-income countries have near-universal K-12 public education to build up human capital, along with encouragement of higher education. All high-income countries have economies where most jobs are interrelated with private and public capital investment, thus leading to higher productivity and wages.
All high-income economies are relatively open to foreign trade. In addition, high-growth economies are societies that are willing to allow and even encourage a reasonable amount of disruption to existing patterns of jobs, consumption, and ownership. After all, economic growth means change.
In New Zealand, interest free student loans are available to invest in higher education as well as living allowances for those with parents on a low income. There are countries in Europe with low levels of investment in higher education but that’s because of high income taxes not because of inequality.
The OECD’s report is fundamentally flawed which is disappointing because most research from the OECD is to a good standard.
via CONVERSABLE ECONOMIST: Does Inequality Reduce Economic Growth: A Skeptical View.
The rise and rise of working billionaires
23 May 2015 Leave a comment

Everyone is much better off than 40 years ago
19 May 2015 Leave a comment
in applied welfare economics, economic history, labour economics, poverty and inequality Tags: middle class stagnation, The Great Enrichment, top 1%, wage stagnation
More evidence of the rise and rise of the working rich, who build businesses
17 May 2015 1 Comment
in economic history, entrepreneurship Tags: CEOs, creative destruction, entrepreneurial alertness, superstar wages, superstars, top 1%
Er: more taxes on capital and wealth, anyone? (CBO latest). http://t.co/PT95Py3USu—
Richard V. Reeves (@RichardvReeves) November 17, 2014


Recent Comments