How many of the richest Americans inherited their fortune? Find out. buff.ly/1DNM3g2 http://t.co/QlarE5yAdT—
HumanProgress.org (@humanprogress) August 14, 2015
More on the rise and the rise of the working super rich
15 Aug 2015 Leave a comment
in applied price theory, applied welfare economics, economic history, entrepreneurship, industrial organisation, survivor principle Tags: antimarket bias, entrepreneurial alertness, superstar wages, superstars, top 0.1%, top 1%, top wage earners
Union density rates in Scandinavia since 1960
15 Aug 2015 Leave a comment
in economic history, labour economics, unions Tags: Denmark, Finland, Norway, Sweden, union membership, union power, union wage premium
Union membership has been very high all the time in Norway, Sweden, Denmark and Finland.
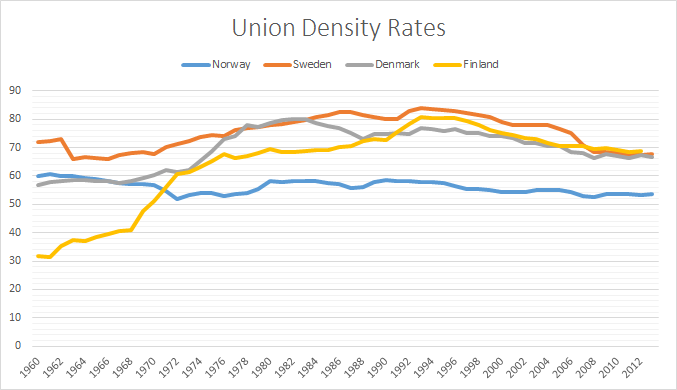
Source: OECD Stat Extract.
Creative destruction in car manufacturing
14 Aug 2015 Leave a comment
in development economics, economic history, entrepreneurship, growth miracles, industrial organisation, international economics, survivor principle Tags: automotive industry, car industry, comparative advantage, creative destruction, entrepreneurial alertness, manufacturing industry, market selection, The meaning of competition
Changing shares of car production since 1950
(source bit.ly/1hn1l0Y) http://t.co/VPhianlBBX—
Max Roser (@MaxCRoser) August 07, 2015
Crime in the Big Apple
14 Aug 2015 Leave a comment
in economic history, economics of crime, law and economics, politics - USA Tags: crime and punishment, criminal deterrence, law and order, New York City
Nice WSJ graph of the remarkable decline in crime in NYC since 2002. on.wsj.com/19XvVY5 http://t.co/iLDNufelVB—
Miles Kimball (@mileskimball) December 31, 2013
The Middle East and North Africa looked very different in 1914
14 Aug 2015 Leave a comment
in economic history, war and peace Tags: Africa, age of empires, British empire, colonialism, Middle Eastern history, Middle Eastern politics, World War I
The Middle East and North Africa looked very different in 1914. vox.com/a/maps-explain… (map via @LMDiplo) http://t.co/j056KtFUDN—
Vox Maps (@VoxMaps) June 10, 2015
Union density rates in Germany, France and Italy
14 Aug 2015 Leave a comment
in economic history, Euro crisis, labour economics, unions, urban economics Tags: Eurosclerosis, France, German unification, Germany, Italy, union membership, union power, union wage premium
There are large differences in unionisation rates between the three countries. France has always had low levels of unionisation which halved since the 1970s. Italy had a sharp boost in union membership in the number of unions in the 1960s and 70s. This may have been associated with increased urbanisation. Union membership rate stayed pretty high in Italy ever since with a small taper downwards. Germany had stable unionisation rates prior to German unification after which the numbers about halved up in a slow taper.
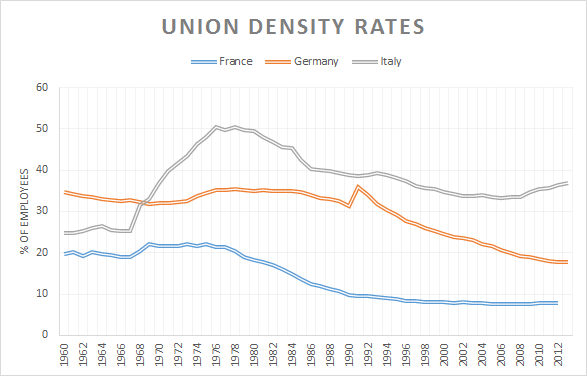
Source: OECD Stat Extract.
The fracking revolution
14 Aug 2015 Leave a comment
in economic history, energy economics, politics - USA Tags: creative destruction, fracking
Apparently, some people still buy CDs
13 Aug 2015 Leave a comment
in economic history, economics of media and culture, industrial organisation, survivor principle Tags: CDs, creative destruction, legacy media
In the last 40 years, there have been huge shifts in how Americans spend money on music
redef.com/original/less-… http://t.co/jumI47aYAn—
Conrad Hackett (@conradhackett) August 05, 2015
@metiria @NZGreens 20,000 drop in children in hardship in 2014
13 Aug 2015 Leave a comment
in applied welfare economics, economic history, income redistribution, labour economics, politics - New Zealand, poverty and inequality, Public Choice, welfare reform Tags: child poverty, family poverty, family tax credits, Leftover Left, New Zealand Greens, Twitter left
The material hardship measure shows a falling child material hardship rate using a threshold equivalent to the ‘standard’ EU level, down from a peak of 21% immediately after the GFC to 14% in 2014.
Using the more severe threshold, there was a slight rise through the GFC to 10% and a small fall to 8%, the level it was at before the GFC.
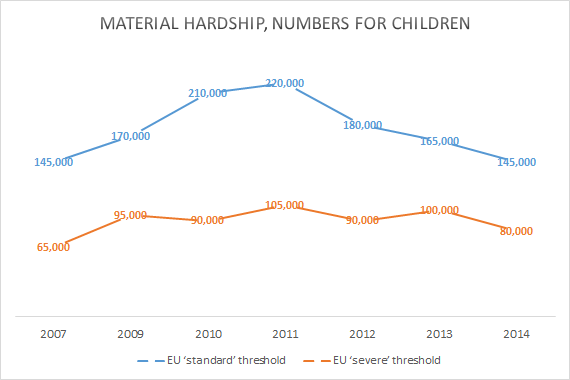
Source: Bryan Perry, Household Incomes in New Zealand: trends in indicators of inequality and hardship 1982 to 2014 – Ministry of Social Development, Wellington (August 2015), p. 133.
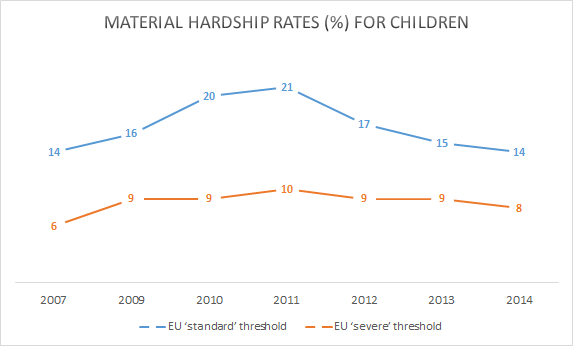
Source: Bryan Perry, Household Incomes in New Zealand: trends in indicators of inequality and hardship 1982 to 2014 – Ministry of Social Development, Wellington (August 2015), p. 133.
Maori and Pasifika economic progress since 1988
13 Aug 2015 Leave a comment
in applied welfare economics, discrimination, economic history, labour economics, politics - New Zealand, poverty and inequality Tags: Maori economic development
From a longer-term perspective, all groups showed a strong rise from the low point in the mid 1990s through to 2010. In real terms, overall median household income rose 47% from 1994 to 2010: for Maori, the rise was even stronger at 68%, and for Pacific, 77%.
These findings for longer- term trends are robust, even though some year on year changes may be less certain. For 2004 to 2010, the respective growth figures were 21%, 31% and 14%.

Source: Bryan Perry, Household Incomes in New Zealand: trends in indicators of inequality and hardship 1982 to 2014 – Ministry of Social Development, Wellington (August 2015), Table D6.
@WJRosenbergCTU A brief history of rising equality in New Zealand
13 Aug 2015 Leave a comment
in applied price theory, applied welfare economics, economic history, economics of media and culture, income redistribution, labour economics, politics - New Zealand, poverty and inequality, Public Choice Tags: capitalism and freedom, Leftover Left, The Great Enrichment, The Great Fact, top 1%, Twitter left
Bill Rosenberg at the Council of Trade Unions was good enough to tweet a Treasury chart that shows next to no increases in inequality in New Zealand for at least 20 years.
A brief history of inequality-from Treasury paper Fig4. Note Employment Contracts Act,GST,income tax,benefit cuts,WFF http://t.co/y4w3cUsgjD—
Bill Rosenberg (@WJRosenbergCTU) June 27, 2015
Inequality in both market and disposable incomes has been stable for a good 20 years, as the above tweet shows, while inequality in consumption has been falling. To back this interpretation of mine up, coincidentally today Bryan Perry published his annual report on income and inequality under the banner of the Ministry of Social Development.
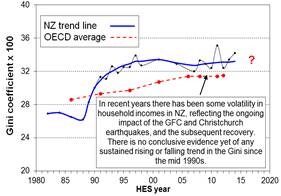
His report showed that there be no significant increase in New Zealand in at least 20 years.
@metiria @NZGreens child poverty is driven by housing unaffordability – by Green opposition to RMA reform
13 Aug 2015 1 Comment
in applied welfare economics, economic history, economics of regulation, labour economics, politics - New Zealand, poverty and inequality, urban economics Tags: antimarket bias, child poverty, expressive voting, family poverty, green rent seeking, housing affordability, land use planning, Leftover Left, New Zealand Greens, NIMBYs, rational ignorance, rational irrationality, RMA, zoning
#moreinclusivenz @povertymonitor Killer graphs & #infographics by NZ Children's Commissioner. Shameful content, NZ http://t.co/mG987C5kh0—
Isabella Cawthorn (@fixiebelle) July 26, 2015
Nothing much has happening to child poverty before housing costs in New Zealand since the early 1980s. It is after housing costs poverty that is crucifying the children in New Zealand.
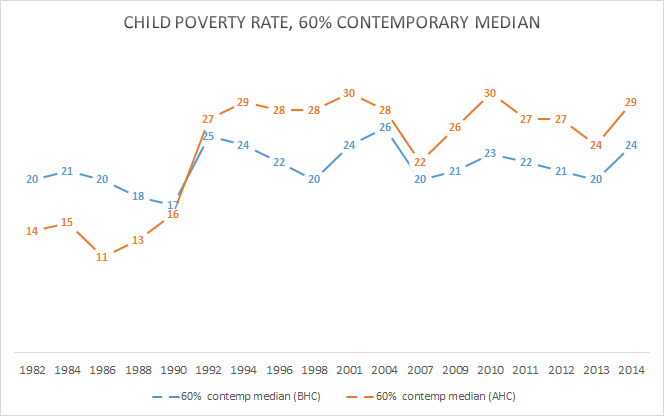
Source: Bryan Perry, Household Incomes in New Zealand: trends in indicators of inequality and hardship 1982 to 2014 – Ministry of Social Development, Wellington (August 2015), Table F6 and table F7.
An economy that is not working for all of us, is simply not working. http://t.co/zZu0LOy7ED—
Green Party NZ (@NZGreens) August 13, 2015
From HES 2013 to HES 2014 median household income rose 5% in real terms (5% above the CPI inflation rate)…
On the AHC moving line measures, child poverty rates in HES 2014 are around the same as their peak after the GFC. A good amount of the rise from HES 2013 to HES 2014 is due to the large rise in the BHC median, as noted above, rather than a change in the numbers in low income per se.
The parties that oppose measures to increase the supply of land and reduce the cost of housing through reform of the Resource Management Act and its many restraints on the supply of land are the New Zealand Labour Party and New Zealand Greens.
Children's views on poverty #childpovertynz occ.org.nz/assets/Uploads… http://t.co/wZHJ19QcpN—
Child Poverty NZ (@povertymonitor) September 08, 2015
Has NZ child poverty doubled as @MaxRashbrooke said?
13 Aug 2015 Leave a comment
in applied welfare economics, economic history, politics - New Zealand Tags: child poverty, family poverty, Leftover Left
An economy that is not working for all of us, is simply not working. http://t.co/zZu0LOy7ED—
Green Party NZ (@NZGreens) August 13, 2015https://twitter.com/JimRose69872629/status/631634249737605120
https://twitter.com/JimRose69872629/status/631635425271001088

Lindsay Mitchell put me onto a quote by veteran grumbler Max Rashbrooke that the child poverty rate doubled in New Zealand:
In a system where income goes disproportionately to the already well-off, ordinary workers are missing out on the rewards of their efforts, to the tune of billions of dollars a year. Welfare benefits, cut by a quarter in 1991 and increased just 8 per cent in the last budget, are far too low to meet people’s basic needs.
The result is a doubling of child poverty and the return of childhood diseases unknown in most developed countries – a national embarrassment, as one researcher described it.
Poverty, income and inequality data is collected in loving detail by Brian Perry every year for the Ministry of Social Development.
Figure 1: % child poverty in New Zealand (before and after housing costs), 60% 1998 median constant value, 1982 – 2013
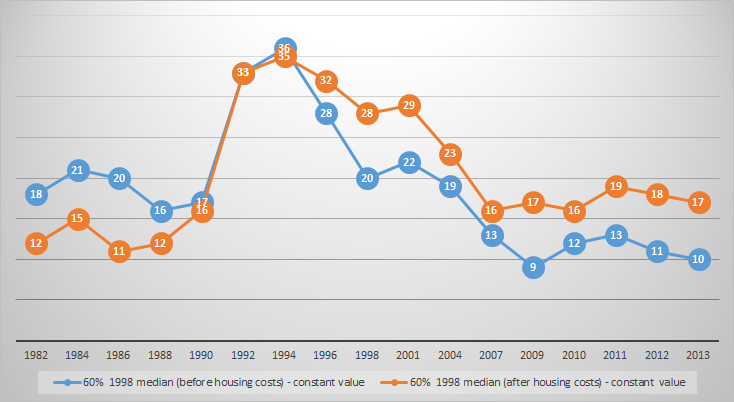
Source:
View original post 509 more words
Mises on the task of the historian
13 Aug 2015 Leave a comment
in economic history, Ludwig von Mises Tags: political correctness
Italian unemployment incidence by duration since 1983
12 Aug 2015 Leave a comment
in business cycles, economic history, Euro crisis, job search and matching, labour economics, macroeconomics, unemployment Tags: employment law, equilibrium unemployment rate, Eurosclerosis, Italy, labour market regulation, natural unemployment rate, unemployment duration
Unemployment of more than a year was slowly tapering down in Italy before the global financial crisis, but ever so slowly.
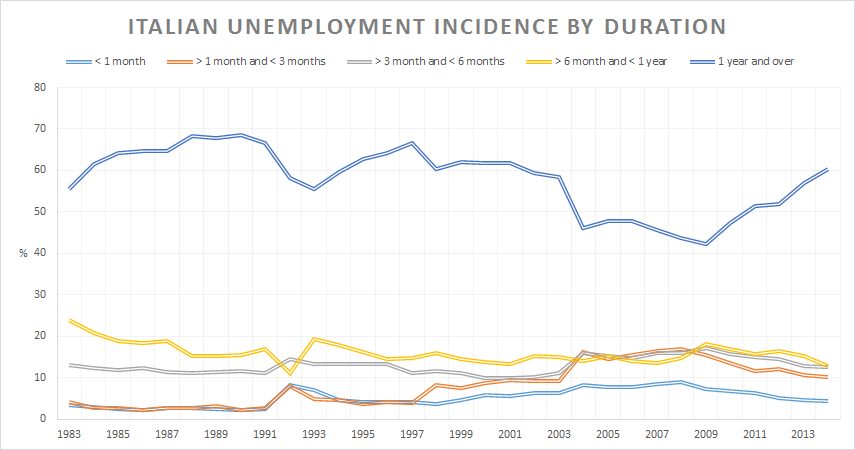
Source: OECD StatExtract.


Recent Comments