The demand and supply for vaccinations
24 Jul 2015 Leave a comment
in economic history, economics of information, economics of media and culture, health economics Tags: anti-vaccination movement, expressive voting, rational ignorance, rational irrationality, vaccinations, vaccines
@Income_Equality there’s an Internet you know – was there next to no unemployment prior to the mid-1980s in New Zealand?
24 Jul 2015 Leave a comment
in business cycles, econometerics, economic growth, economic history, job search and matching, labour economics, labour supply, macroeconomics, politics - New Zealand, Public Choice, unemployment, unions, welfare reform Tags: antimarket bias, Don Brash, economic reform, expressive voting, Homer Simpson, Leftover Left, lost decades, makework bias, neoliberalism, rational ignorance, rational irrationality, Sir Roger Douglas, Twitter left
Today, Closing The Gap – The Income Inequality Project boldly claimed today that there was next to no unemployment in New Zealand prior to the onset of the curse of neoliberalism.

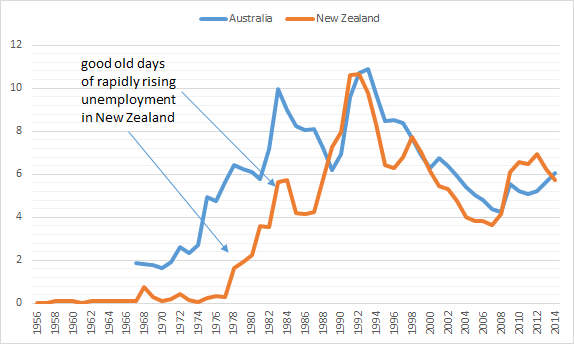
There is an Internet on computers now where it is easy to find data showing that the unemployment rate was rising rapidly in New Zealand in the 1970s and in double digits by the end of the 1980s – see figure 1.
Figure 1: harmonised unemployment rates, Australia and New Zealand, 1956-2014
Source: OECD StatExtract.
Figure 1 shows unemployment was rising rapidly in the 1970s and wasn’t much different by the end of the 1970s to the unemployment rates recorded after about 2000 in New Zealand.

One of the reasons that Sir Roger Douglas wrote There’s Got To Be A Better Way was the rapidly rising unemployment in New Zealand and the stagnant economic growth in the late 1970s and early 1980s.

New Zealand was one of the most regulated economies, so much so that Prime Minister David Lange said:
We ended up being run very similarly to a Polish shipyard.
As for those jobs on the railways, the then Reserve Bank Governor Don Brash said in 1996:
Railways cut its freight rates by 50 percent in real terms between 1983 and 1990, reduced its staff by 60 percent, and made an operating profit in 1989/90, the first for six years.
More on unemployment: In 1955 the New Zealand’s prime minister knew all unemployed personally.
– Atkinson’s new book http://t.co/x37Vxya97C—
Max Roser (@MaxCRoser) July 24, 2015
Creative destruction in family spending in the 20th century
24 Jul 2015 Leave a comment
in applied welfare economics, economic history, politics - USA Tags: creative destruction, living standards, The Great Enrichment
Change in Family spending in the 20th c. bit.ly/195NbKb http://t.co/9wd27BGzpT—
Catherine Mulbrandon (@VisualEcon) September 08, 2014
Average effective retirement ages by gender, Australia and New Zealand, 1970 – 2012
24 Jul 2015 1 Comment
in economic history, labour economics, labour supply, politics - Australia, politics - New Zealand Tags: ageing society, Australia, demographic crisis, economics of retirement, effective retirement ages, female labour force participation, female labour supply, male labour force participation, male labour supply, old age pensions, older workers, retirement ages, social insurance, Social Security, welfare state
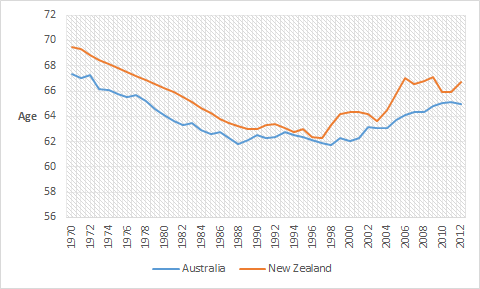
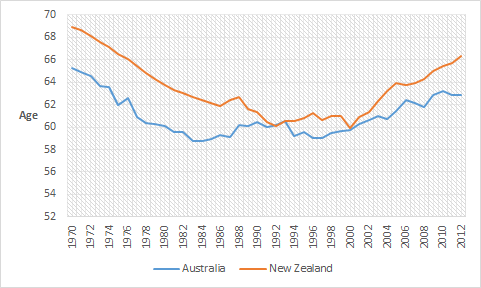
Figures 1 and 2 shows a sharp increase in the average effective retirement age for men and women in both Australia and New Zealand between 1970 and 1990. After that, retirement ages for men in both countries stabilised for about a decade. effective retirement age than Australia.
Figure 1: average effective retirement age for men, Australia and New Zealand, 1970 – 2012, (five-year average)
Source: OECD Pensions at a Glance.
Interestingly, in the 1970s and 1980s, New Zealand had an old-age pension scheme, known as New Zealand Superannuation, whose eligibility age was lowered from 65 to 60 in one shot in 1975. This old-age pension in New Zealand had no income test or assets test, but there was for a time a small surcharge on any income of pensioners. Nonetheless, New Zealand had a higher effective retirement age than in Australia where the old-age pension eligibility age is 65 with strict income and assets tests.
Figure 2: average effective retirement age for women, Australia and New Zealand, 1970 – 2012, (five-year average)
Source: OECD Pensions at a Glance.
Figure 1 and figure 2 also shows that the sharp increase in effective retirement ages in New Zealand for both men and women after the eligibility age for New Zealand’s old-age pension was increased from 60 to 65 over 10 years.
Figures 1 and 2 also show the gradual increase in effective retirement ages for Australian men and women from the end of the 1990s.
Some of the kidnapped ODA activists have been freed and can speak out at last!
23 Jul 2015 Leave a comment
in development economics, economic history, growth disasters, growth miracles, Marxist economics Tags: activists, anticapitalist mentality, antiforeign bias, antimarket bias, do gooders, expressive voting, Left-wing hypocrisy, Leftover Left, mass kidnappings, ODA, overseas aid, rational ignorance, rational irrationality, The Guardian

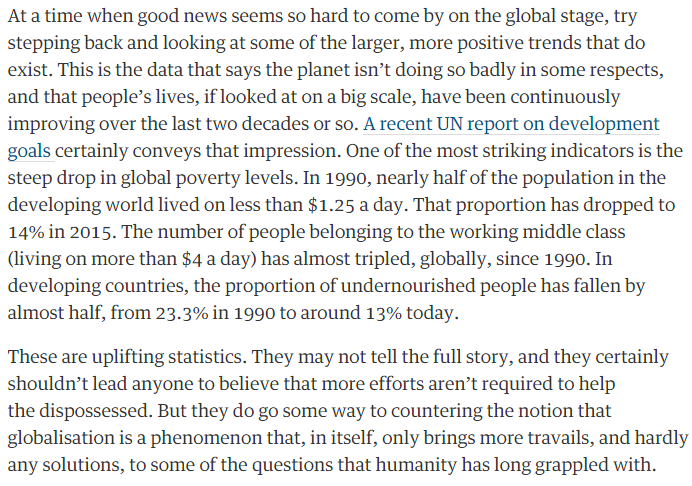
The role of the spread of capitalism and globalisation in massively reducing extreme poverty just gets a mention, begrudgingly, but it’s better than nothing From a newspaper of record of the Left over Left.
Herbert Hoover and the onset of the Great Depression
23 Jul 2015 Leave a comment
in business cycles, economic history, economics of regulation, great depression, industrial organisation, labour economics, macroeconomics, unions Tags: Herbert Hoover, Lee Ohanian
Average effective retirement ages by gender, USA and UK, 1970 – 2012
23 Jul 2015 Leave a comment
in economic history, gender, labour economics, labour supply Tags: ageing society, British economy, demographic crisis, economics of retirement, effective retirement ages, female labour force participation, female labour supply, male labour force participation, male labour supply, old age pensions, older workers, retirement ages, social insurance, Social Security, welfare state
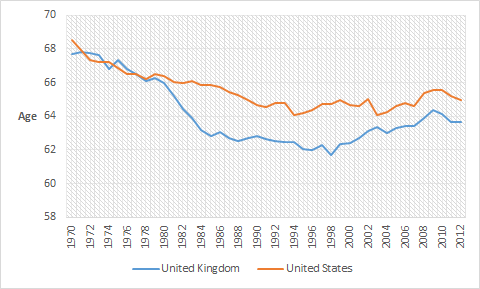
Figure 1 shows a divergence in the 1970s where there is a sharp increase in the average effective retirement age for men in the UK over a short decade. After that, British retirement ages for men started to climb again in the late 1990s. Figure 1 also shows that the gentle taper in the effective retirement age for American men stopped at the 1980s and started to climb again in the 2000s.
Figure 1: average effective retirement age for men, USA and UK, 1970 – 2012, (five-year average)
Source: OECD Pensions at a Glance.
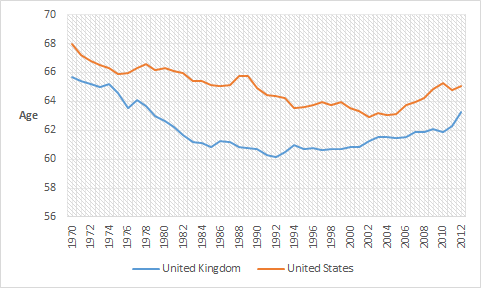
Figure 2 shows similar results to figure 1 for British and American women. That is, falling effective retirement ages for both British and American women in the 1970s and 1980s followed by a slow climb again during the 1990s.
Figure 2: average effective retirement age for women, USA and UK, 1970 – 2012, (five-year average)
Source: OECD Pensions at a Glance.
Fact Checking @Income_Equality – child poverty in 2014 was at 24% compared to 14% in 1982
22 Jul 2015 Leave a comment
in applied welfare economics, economic history, labour economics, politics - New Zealand, population economics, poverty and inequality, urban economics Tags: child poverty, family poverty, green rent seeking, housing prices, land prices, land supply, Leftover Left, NIMBYs, top 1%
Closing The Gap – The Income Equality Project said today that “child poverty in New Zealand in 2014 was 24% as compared 14% in 1982”. What do they mean by this and what, importantly, does this trend imply for problem definition for child poverty policy?
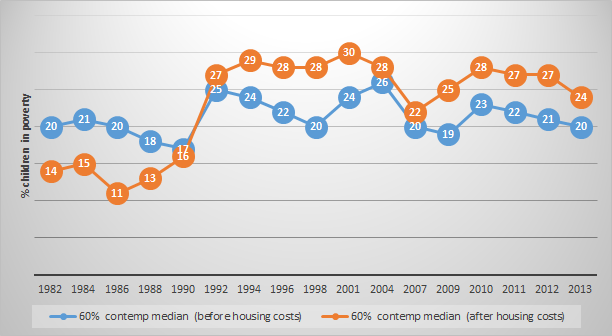
Figure 1 below shows their numbers, which is child poverty in New Zealand after housing costs for poverty thresholds of 60% relative to a contemporary median as calculated by the Ministry of Social Development’s Brian Perry – the New Zealand expert on these matters.
Figure 1: % child poverty in New Zealand (before and after housing costs), 60% relative to contemporary median, 1982 – 2013
Source: Bryan Perry, Household incomes in New Zealand: Trends in indicators of inequality and hardship 1982 to 2013. Ministry of Social Development (July 2014), Tables F.6 and F.7.
The first thing to notice is, which is important, in figure 1 is before housing costs child poverty under the 60% relative to the contemporary median poverty threshold chosen by Closing The Gap – The Income Equality Project has been pretty stable for 30 years the New Zealand. Crisis, what crisis?
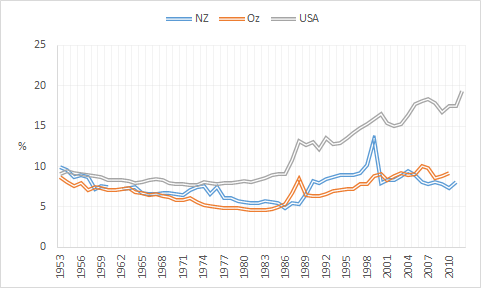
The top 1%’s New Zealand branch has not being doing its job – see figure 2. The New Zealand top 1% has failed miserably in further oppressing the proletariat, extracting more and more of their labour surplus, and grinding working class children into deeper and deeper poverty to increase their already excessive incomes – see figure 2. You’re fired as the until recently registered Democrat Donald Trump would say.
Figure 2: top income shares, New Zealand, Australia and USA
Source: top incomes-parisschoolofeconomics
Before housing costs child poverty has not risen for 30 years as shown in figure 1, which is the chosen threshold of child poverty of the Closing The Gap – The Income Equality Project.
The story about trends in child poverty is very different for child poverty when after housing costs child poverty rates are estimated – see figure 1.
Figure 1 shows a large increase in after housing costs child poverty in New Zealand in the late 1980s when there was a deep recession and double-digit unemployment. Since the early 1990s, as figure 1 shows, after housing costs child poverty has slowly tapered down from the high 30% in the mid-1990s to 24% now and that is despite the global financial crisis, which was the top 1%’s fault if the Left over Left is to be believed.
For before housing costs child poverty – as can be seen from figure 1 – there was an increase in child poverty before housing costs when there was a deep recession at the end of the 1980s. After before housing costs child poverty is now the same as it was both 20 and 30 years ago – see figure 1 .
In the longer run after housing costs child poverty rates in 2013 were close to double what they were in the late 1980s mainly because housing costs in 2013 were much higher relative to income than they were in the late 1980s.
– Bryan Perry, 2014 Household Incomes Report – Key Findings. Ministry of Social Development (July 2014).
Now to the rub. If it is after housing costs child poverty that has risen in New Zealand and stayed high, as it has, the focus should be on what factors are driving up housing costs rather than what factors are driving down wages and incomes of ordinary worker. Before housing costs child poverty is no worse than it was 20 and 30 years ago – see figure 1.
New QV figures show Auckland house prices are up a massive 16.1% on last year, now estimated to reach $1m by Aug '16. http://t.co/DwAU79ozCy—
New Zealand Labour (@nzlabour) June 09, 2015
The cause of the large increase in housing costs and housing prices is abundantly clear. Restrictions on the supply of land that result from the Resource Management Act and policies made under that law such as the Auckland urban limit. That is the proper problem definition for public policy. Restrictions on land supply is driving up child poverty because more and more of the incomes of the poor is housing costs.
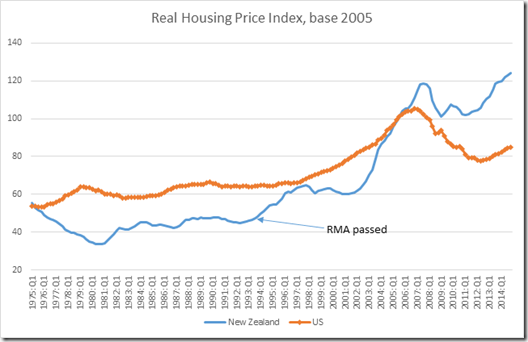
Source: Federal Reserve Bank of Dallas.
The most straightforward and fastest way of reducing child poverty and family poverty in New Zealand is lowering housing costs through deregulation of land supply.

Land supply deregulation is well within the realm of public policy choice. Parliament cannot legislate wage increases without accompanying productivity increases, but it can reduce restrictions on the supply of land as a result of the Resource Management Act.

Any discussion of child poverty and family poverty in New Zealand should refer to trends in both before and after housing cost in child poverty.
Will the Govt intervene in Auckland's housing crisis? Or will home ownership become a preserve of the wealthy? http://t.co/CK2AnCeuYB—
Green Party NZ (@NZGreens) February 05, 2015
A comparison of these diverging trends between before housing cost and after housing costs child poverty rates since 1982 gives a much clearer picture of what is increasing child poverty. The cause is housing costs as a result of ever tightening regulation on the supply of new urban land and in particular in Auckland at the behest of the middle-class voters courted by the Greens and Labour Party. It is the left-wing parties in New Zealand which opposed the most practical steps to reduce child poverty, which is land supply deregulation.
Union and non-union manufacturing job losses compare
22 Jul 2015 Leave a comment
in economic history, industrial organisation, labour economics, survivor principle, unions Tags: creative destruction, union power, union wage premium
Those reading Nick Kristof's pro-union piece should also consider their impact on job growth economy.com/dismal/analysi… http://t.co/xJwbJQmQth—
Modeled Behavior (@ModeledBehavior) February 19, 2015
Earthrise over Apollo 11 lunar module returning to dock with command module
22 Jul 2015 Leave a comment
in economic history, technological progress Tags: creative destruction, moon landings
Earthrise over Apollo 11 lunar module, returning from moon to dock with command module, 46 years ago today: #NASA http://t.co/OPGJcDDEf9—
Michael Beschloss (@BeschlossDC) July 22, 2015
The impact of neoliberalism on labour market freedom in Argentina, Brazil, Chile and Venezuela
22 Jul 2015 Leave a comment
in development economics, economic history, economics of regulation, growth disasters, growth miracles, labour economics, labour supply, minimum wage, unions Tags: Argentina, Brazil, Chile, conspiracy theories, employment law, employment regulation, Index of Economic Freedom, Leftover Left, Mont Pelerin Society, neoliberalism, Twitter left, Venezuela
All was quiet on the neoliberalism front in Latin America for the last 20 years. In yet another defeat for the Mont Pelerin Society led transnational conspiracy, labour market freedom has declined in the four countries in figure 1. I’ve always had my doubts about the ability of a transnational conspiracy to be led by a society with such a crappy website.
Figure 1: Index of Economic Freedom, Argentina, Brazil, Chile and Venezuela, 95 – 2015
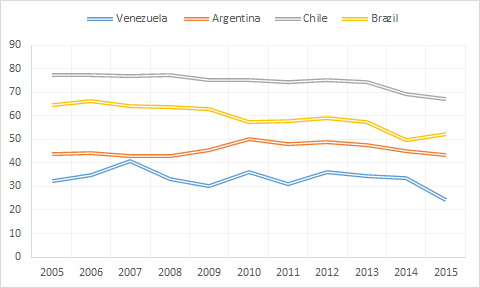
Source: Index of Economic Freedom 2015.
Capitalism and Pope Francis
22 Jul 2015 1 Comment
in development economics, economic history, economics of religion, growth disasters, growth miracles Tags: capitalism and freedom, East Asian Tigers, Latin American popularism, Pope Francis, The Great Escape, The Great Fact
https://twitter.com/Mark_J_Perry/status/620591953290375169/photo/1
Pope's plan to curtail use of fossil fuels will hurt the poor, see chart and @FurchtgottRoth tinyurl.com/oy5w5o3 http://t.co/YWEloL04MK—
Mark J. Perry (@Mark_J_Perry) June 21, 2015
How the Apollo 11 Moon Landing Worked
21 Jul 2015 Leave a comment
in economic history Tags: moon landing
How the Apollo 11 Moon Landing Worked (Infographic) oak.ctx.ly/r/3dn34 http://t.co/CWehIuPx8F—
SPACE.com (@SPACEdotcom) July 21, 2015
Trends in labour market freedom in the UK, USA, Germany and France – Index of Economic Freedom rankings
21 Jul 2015 Leave a comment
in economic history, economics of regulation, global financial crisis (GFC), job search and matching, labour economics, labour supply, law and economics, minimum wage, politics - USA, unions Tags: British economy, employment law, employment regulation, Eurosclerosis, France, Germany, Index of Economic Freedom
The writers of the Index of Economic Freedom at the Heritage foundation really loves the USA and didn’t think much of the Conservative Party – Liberal Democratic Party coalition government because labour market freedom actually fell in the UK during their administration. Bring back Tony Blair, all is forgiven. The information on their website throws no insight into why this reduction in labour market freedom in Britain happened.
Figure 1: Index of Economic Freedom, Argentina, Brazil, Chile and Venezuela, 95 – 2015 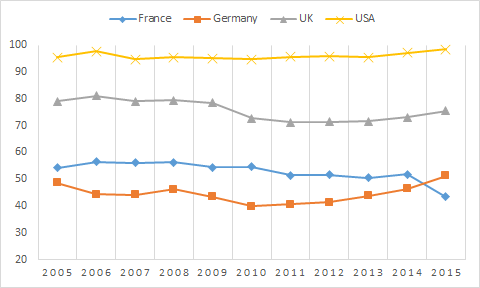
Source: Index of Economic Freedom 2015.
Fortunately for Germany, labour market freedom increased over the course of the global financial crisis and its aftermath. This helps explains low unemployment in Germany during that period. Nothing much happened in France in regard to labour market freedom.


Recent Comments