
I might do most of these. Do you?
31 May 2015 2 Comments
in economics of media and culture, entrepreneurship, industrial organisation Tags: cell phones, creative destruction, entrepreneurial alertness, PCs, smart phones

How to show the emergence of a working super rich while attempting to argue they are a rentier class
28 May 2015 Leave a comment
in financial economics, industrial organisation, managerial economics, organisational economics, survivor principle, theory of the firm Tags: CEO pay, Leftover Left, leveraged buyouts, market for corporate control, mergers and takeovers, superstar wages, superstars, Twitter left
The Washington Centre for Equitable Growth in a review of Thomas Piketty accidentally contradicted their own arguments about the emergence of the top 0.1%. They quote Piketty:
on page 302 of his book that the rise in labour income “primarily reflects the advent of ‘supermanagers,’ that is, top executives of large firms who have managed to obtain extremely high, historically unprecedented compensation packages for their labour.”
according to the Washington Centre for Equitable Growth:
these supermanagers were being vastly overly compensated given their questionable contributions to productivity.
The Washington Centre for Equitable Growth then goes on the argue that in 1979, most of the top managers worked for large, publicly traded firms but by 2005 more were working in closely held firms.
Who are today’s supermanagers and why are they so wealthy? equitablegrowth.org/research/today… http://t.co/Ts2OkOUk5g—
Equitable Growth (@equitablegrowth) December 03, 2014
I wish to explore this point about the biggest gains in both percentage terms and magnitude were among privately held business professionals and they are vastly overcompensated relative to their productivity. The key to the argument as explained in a link to a Robert Solow article by the Washington Centre for Equitable Growth is:
Piketty is of course aware that executive pay at the very top is usually determined in a cosy way by boards of directors and compensation committees made up of people very like the executives they are paying.
Piketty is equally direct about the ability of top managers to set their own pay:
It is only reasonable to assume that people in a position to set their own salaries have a natural incentive to treat themselves generously or at the least to be rather optimistic in gauging their marginal productivity.
Emmanuel Saez is less coy:
…while standard economic models assume that pay reflects productivity, there are strong reasons to be sceptical, especially at the top of the income ladder where the actual economic contribution of managers working in complex organizations is particularly difficult to measure. In this scenario, top earners might be able partly to set their own pay by bargaining harder or influencing executive compensation committees.
When arguing that the optimal top income tax rate is 83%, Piketty, Saez, and Stantcheva push for that high top tax rate in part because top executives are more likely to bargain for higher pay when tax rates are lower and receive funds that might go elsewhere within the firm.
Emmanuel Saez and Gabriel Zucman explore the new wealth divide in the U.S. equitablegrowth.org/research/explo… http://t.co/WKJKAigAPN—
Equitable Growth (@equitablegrowth) October 24, 2014
The only comment I could find on the increasing number of privately held companies that pay top executives so well is frustration by the Washington Centre for Equitable Growth that it complicates statistical collection. No other analysis is undertaken.
Xavier Gabaix and Augustin Landier found back in 2008 that what a major company’s CEO earns is directly proportional to the size of the firm that they are responsible for running. Executive compensation closely track the evolution of average firm value. During 2007 – 2009, firm value decreased by 17%, and CEO pay by 28%. During 2009-2011, firm value increased by 19% and CEO pay by 22%. Xavier Gabaix and Augustin Landier also found that compensation for executives has risen with the market capitalization. From 1980 to 2003, the average value of the top 500 companies rose by a factor of six. Two commonly used indexes of chief executive compensation show close to a proportional six-fold matching increase.
What intrigued me about this casual reference to the great number of super managers employed by privately held firms is the argument that they have a cosy relationship with their board of directors immediately collapses. That argument about executive pay is usually in the context of the separation of ownership from control. In large publicly held companies the executives are subject to less scrutiny by shareholders as few of them have a large enough individual stake in the company to gain from the extra effort of monitoring their pay packages.
When the pay packages of top executives is questioned, it is always pointed out that there is an easy way to test for whether top executives cheat shareholders by overpaying themselves.

This simple test is comparing the pay of large private companies and public companies with a large or a few share holders with public companies with diffuse share holdings. Private equity typically also pay its top executives very well, even though the capacity to dupe public shareholders are not a factor.
Privately owned companies and public companies with a few large shareholders can easily keep track of the pay packages of the executives and the board of directors hired to monitor them. Private equity ownership have high pay-for-performance but also significant CEO co-investment.
The standard argument for excessive compensation for CEOs is free rider problems prevent shareholders from doing sufficient monitoring of executive compensation practices, and that the problems have been getting worse over time. For example, in a classic paper, Bebchuk and Fried (2004) argued that executive compensation is set by CEOs themselves rather than boards of directors on behalf of shareholders,
This argument does not apply to private companies with a few shareholders but they still offer large pay packages to their top executives. Companies, be they public or private that pay any employee more than they contribute risks takeover and loss of market share and failure through higher costs.

The burst of takeovers and leverage buyouts in the 1980s were partly driven by opportunities to profit from reducing corporate slack and downsizing flabby corporate headquarters of large publicly listed companies. Cleaning out the overpaid executives and overstaffing in the headquarters of large corporations was an express purpose of these takeovers and leveraged buyouts.
The response of the Left over Left of the day was support regulation to stop these mergers and takeovers rather than applauding them as giving lazy, overpaid top executives a kick up the backside and from the boot out the door. This regulation to make hostile takeovers more difficult undermined the market the corporate control rather than strengthened it as Michael Jensen explains:
This political activity is another example of special interests using the democratic political system to change the rules of the game to benefit themselves at the expense of society as a whole.
In this case, the special interests are top-level corporate managers and other groups who stand to lose from competition in the market for corporate control. The result will be a significant weakening of the corporation as an organizational form and a reduction in efficiency.
Central to the hypothesis of the Twitter Left of CEOs overpaying themselves is there is free cash within the business they pocket in pay rises, fringe benefits and lavished corporate headquarters rather than pay out in dividends or invest in profitable investments.

CEOs with high pay packages are now much more likely than 20 or 30 years ago to be employed in private companies where the shareholders have far greater opportunities to ensure they get value for money.
All modern theories of the focus in part or in full on reducing opportunistic behaviour, cheating and fraud in employment and commercial relationships. The market for corporate control, and mergers and takeovers realise large benefits from displacing underperforming manager teams. Premiums in hostile takeover offers historically exceed 30% on average. Acquiring-firm shareholders on average earn about 4% in hostile takeovers and roughly zero in mergers.
Another reason for high CEO pay in both public and private companies is CEOs tend to be more risk adverse than their shareholders. The shareholders in any one company has a diversified portfolio and protected by limited liability if the company fails because of a risky venture. Moreover, shareholders receive nothing in dividends if the company breaks even so they would prefer that managers pursue business ventures likely to do more than break even.
The agent principal conflict ears as long as the company breaks even, the CEO gets paid. Out of career concerns, a CEO does not want to be at the head of a company that fails because his re-employment prospects are quite grim. High-risk/high-reward ventures are less attractive to top executives because if they fail, their human capital that is specific to the failed company is worthless elsewhere.
To encourage CEOs to take risks, paying them were share options makes them more interested in risky ventures because their pay goes up in line with the risks they take which they would otherwise not take but for option being paid in options. Privately owned companies are well aware of this risk aversion among their chief executives which is why they pay them so well and often in share options and bonuses for taking risks.
The Washington Centre for Equitable Growth simply did not address the reasons for privately owned companies paying the top executives so well.
The incomes of executives, managers, financial professionals, and technology professionals who are in the top 0.1% is very sensitive to stock market fluctuations. This volatility in the pay of CEOs is inconsistent with the notion that their pay is linked to their ability to form cosy relationships with the boards of directors rather than with their performance.

These top 0.1% CEOs are working super rich whose fortunes rise and fall with the businesses they direct. Top CEOs are paid so much more because they direct the fortunes of large enterprises. In such cases, a small amount of extra talent is worth because the benefits of that small amount of extra talent are spread over such a large firm.
@WJRosenbergCTU How the unions argued for the Employment Contracts Act when arguing strongly against it
25 May 2015 1 Comment
in economic growth, economic history, economics of regulation, industrial organisation, job search and matching, labour economics, unions Tags: Employment Contracts Act, employment law, employment protection laws, employment regulation, labour market deregulation, lost decades, union power
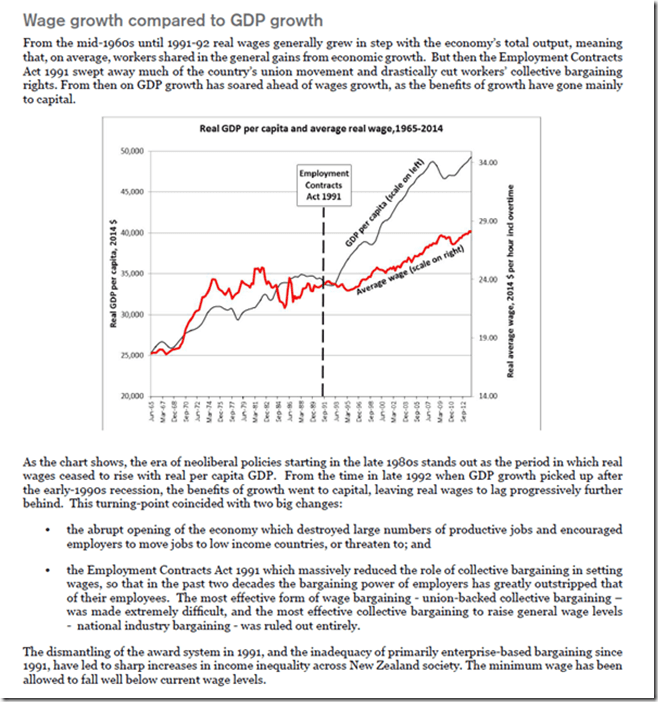
The Council of Trade Unions scored something of an own goal in the 2014 election campaign when it was denouncing the Employment Contracts Act 1991 as the reason for wages growth have not kept up with GDP per capita growth since its passage in 1991. Its evidence in chief against the deregulation of the New Zealand labour market is in the snapshot below showing their graph of real GDP per capita and average real wages from 1965 to 2014.
Source: Low Wage Economy | New Zealand Council of Trade Unions – Te Kauae Kaimahi.
The chart selected by the Council of Trade Unions shows several distinct trends in wages growth and real GDP growth per capita in New Zealand. None of these trends nor breaks in trends support the hypothesis that the days prior to the Employment Contracts Act 1991 were the good old days where workers shared generally in gains from economic growth.
From about 1970 to 1975 in the snapshot below of the Council of Trade Unions chart there was rapid real wages growth, well in excess of real growth in per capita GDP. This wages breakout was followed by some ups and downs but essentially wages in 1995 were no different from what they were in 1975. Real wages were about $24 per hour in real terms in New Zealand for about 20 years – from 1975 to 1995.
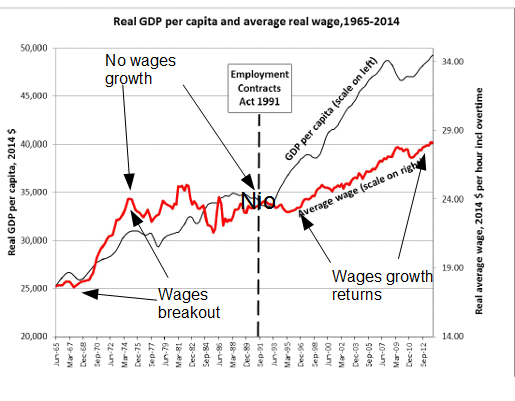
These are the good old days in the eyes of the Council of Trade Unions. No real wages growth for 20 years. There was no real GDP per capita growth from 1975 until 1979 nor in the five years leading up to the passage of the Employment Contracts Act 1991 in the chart selected by the Council of Trade Unions in the snapshot above.
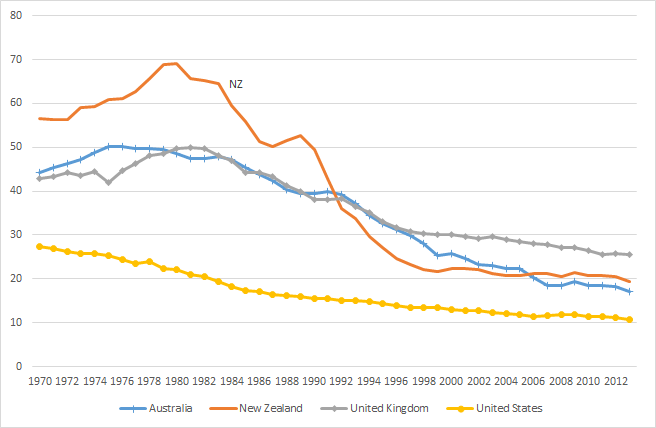
The period leading up to 1975 in the preceding wages breakout was the zenith of union membership with nearly 70% of all workers belonging to a union – see figure 1. What followed from 1975 was a long declining in trade union membership that did not end until just after the Employment Contracts Act in 1991 – see figure 1.
Figure 1: Trade union densities, New Zealand, Australia, United Kingdom and United States, 1970–2013
Source: OECD StatExtract.
Whatever happened to union power in New Zealand happened before the passage of the Employment Contracts Act 1991 and with it the deregulation of the New Zealand labour market. 20 years of no real wages growth and economic stagnation may explain part of the decline of unions in New Zealand.
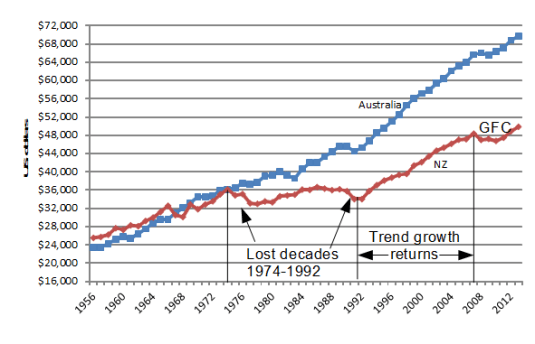
Real GDP per capita growth was pretty stagnant after 1975 to 1994 in the chart of data selected by the Council of Trade Unions, which is why I have previously referred to 1974 to 1992 as New Zealand’s Lost Decades – see figures 2 and 3.
Figure 2: Real GDP per New Zealander and Australian aged 15-64, converted to 2013 price level with updated 2005 EKS purchasing power parities, 1956-2013, $US
Source: Computed from OECD Stat Extract and The Conference Board, Total Database, January 2014, http://www.conference-board.org/economics
Figure 2 shows that New Zealand lost two decades of productivity growth between 1974 and 1992 after level pegging with Australia for the preceding two decades.
These lost decades of growth are the unions’ good old days but workers cannot share in the general gains of economic growth when there isn’t any economic growth as the chart selected by the Council of Trade Unions and figure 2 both show.
New Zealand returned to trend growth in real GDP per working age New Zealander between 1992 and 2007, which is straight after the passage of the Employment Contracts Act 1991 – see figure 2. Coincidence?
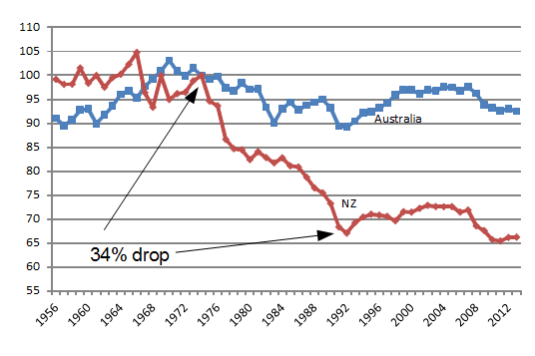
Figure 3: Real GDP per New Zealander and Australian aged 15-64, converted to 2013 price level with updated 2005 EKS purchasing power parities, 1.9 per cent detrended, base 100 = 1974, 1956-2013, $US
Source: Computed from OECD Stat Extract and The Conference Board, Total Database, January 2014, http://www.conference-board.org/economics
In Figure 3, a flat line equates to a 1.9% annual growth rate in real GDP per working age person; a falling line is a below trend growth rate; a rising line is an above 1.9% growth rate of real GDP per working age person. The trend growth rate of 1.9% per working age person is the 20th century trend growth rate that Edward Prescott currently estimates for the global industrial leader, which is the United States of America.
Figure 3 shows that there was a 34% drop against trend growth in real GDP per working age New Zealander between 1974 and 1992; a return to trend growth between 1992 and 2007; and a recession to 2010. this 34% drop against trend productivity growth is looked upon by the Council of Trade Unions as some sort of good old days.
A long period of no labour productivity growth and little real GDP per capita growth are pretty good reasons to rethink New Zealand’s economic policies at a fundamental level, which is exactly what happened after 1984 with the election of a Labour Government.
The unions have conveniently provided another explanation for the Lost Decades of growth in New Zealand from 1974 to 1992. That is the rapid growth of real wages ahead of real GDP per capita in the seven years before growth stalled in New Zealand in 1974 in the snapshot above. This real wages breakout was followed by two decades of lost growth.
Most ironically of all, steady growth in real wages in New Zealand did not return until after the passage of the Employment Contracts Act in 1991! After nearly 20 years of no real wages growth, real wages growth returned at long last in 1995.
After staying at about $24 per hour for 20 years from 1975 in the good old days of union power and collective bargaining, average wages in New Zealand have increased from $24 an hour to about $28 per hour by 2014 in one of the most deregulated labour markets in the world.
The Council of Trade Unions regards the return of real wages growth after a 20 year hiatus as an unwelcome development or something to complain about.
Big business is getting bigger
22 May 2015 Leave a comment
If it seems like big business is getting bigger, it is: 53eig.ht/1L127cr http://t.co/OX9eSj01yc—
(@FiveThirtyEight) May 18, 2015
The International diffusion of the Internet
17 May 2015 Leave a comment
in development economics, economic history, entrepreneurship, growth disasters, growth miracles, industrial organisation, survivor principle Tags: China, creative destruction, international technology diffusion, technology diffusion
The robots are coming, the robots are coming to property values
16 May 2015 Leave a comment
in applied price theory, economics of media and culture, entrepreneurship, industrial organisation, survivor principle, technological progress, transport economics, urban economics Tags: agglomeration, compensating differentials, creative destruction, driverless cars, drones, entrepreneurial alertness, land prices, land supply
A few years ago, Casey Mulligan wrote a fascinating little op-ed about the impact of drones on land prices and urban living.

As drones and driverless cars make it cheaper to move people around cities, the value of inner-city land will fall simply because their proximity to the action has diminished.
With drones and driverless cars, it will be easier to bring something in on the just-in-time basis rather than have it on hand as inventory or within walking distance because traffic congestion makes it too slow to call it up from the suburbs through the conventional commercial transport.
But we live in a world of trade-offs. More people may want to move into the city because it’s so much easier to move around and call things up by drone, driverless car and the share economy, so this may intensify agglomeration effects and increased land prices. Another big day out for the two handed economist.
Creative destruction in recorded music sales
16 May 2015 1 Comment
in entrepreneurship, industrial organisation, Music, survivor principle Tags: creative destruction, entrepreneurial alertness
CHART: Recorded Music Sales Have Collapsed and Were At a 40+ Year Low in 2013 http://t.co/p0zIdbutSx—
Mark J. Perry (@Mark_J_Perry) May 07, 2015

The Rise and Rise of the Super Working Rich
15 May 2015 1 Comment
in economic history, entrepreneurship, financial economics, human capital, industrial organisation, labour economics, occupational choice, property rights, survivor principle, theory of the firm Tags: entrepreneurial alertness, Eugene Fama, Leftover Left, separation of ownership and control, super-rich, superstar wages, superstars, top 1%, Twitter left, working rich
The rise of the rentiers is nothing new. What is new is the degree of financial globalization and liberalization that has supercharged the fortunes of the super-wealthy even beyond robber baron levels. But it’s no mystery how to reverse this. It’s a matter of setting better rules for markets and taxing earners at the top a bit more.
In the course of a deranged rant against the entrepreneurs in society, the Atlantic collected an excellent set of information suggesting that the working rich have replaced rentiers as the super-rich. Rentiers are the idle rich. A rentier is a person or entity receiving income derived from patents, copyrights, interest, etc.

In The Evolution of Top Incomes: A Historical and International Perspective (NBER Working Paper No. 11955), Thomas Piketty and Emmanuel Saez concluded that:
While top income shares have remained fairly stable in Continental European countries or Japan over the past three decades, they have increased enormously in the United States and other English speaking countries.
This rise in top income shares is not due to the revival of top capital incomes, but rather to the very large increases in top wages (especially top executive compensation). As a consequence, top executives (the “working rich”) have replaced top capital owners at the top of the income hierarchy over the course of the twentieth century…

The Twitter Left claim that the surge in top compensation in the United States is attributable to an increased ability of top executives to set their own pay and to extract rents at the expense of shareholders. Obviously, from the chart below the pay the top 0.1% goes up and down with the share market. Top wages do not seem to have any independent power to dupe shareholders into overpaying them in bad times.
Xavier Gabaix and Augustin Landier found back in 2008 that what a major company’s CEO earns is directly proportional to the size of the firm that they are responsible for running. Executive compensation closely track the evolution of average firm value. During 2007 – 2009, firm value decreased by 17%, and CEO pay by 28%. During 2009-2011, firm value increased by 19% and CEO pay by 22%.
Xavier Gabaix and Augustin Landier also found that compensation for executives has risen with the market capitalization. From 1980 to 2003, the average value of the top 500 companies rose by a factor of six. Two commonly used indexes of chief executive compensation show close to a proportional six-fold matching increase.
Better executive decisions create more economic value. If the number of big companies is greater than the number of good chief executives, competitive bidding will push up executive pay to reflect the value of the talent that is available.
What happens to share prices when there is a surprise CEO resignation? Up or down? Apple went up and down in billions on news of Steve Jobs’ health.
When Hewlett Packard’s CEO Mark Hurd resigned unexpectedly, the value of HP stock dropped by about $10 billion! This makes his $30 million in annual compensation a bargain for shareholders. The fall in share price represents the difference between what the market expected from Hurd as Hewlett Packard’s CEO and what the market expects from his successor. Was Hurd under-paid?
There is an easy way to test for whether top executives cheat public shareholders. Compare the pay of large private companies, and public companies with a large or a few share holders, with public companies with diffuse share holdings. Private equity typically also pay its top executives very well, even though the capacity to dupe public shareholders are not a factor.
The burst of takeovers and leverage buyouts in the 1980s were very much driven by opportunities to profit from reducing corporate slack and downsizing flabby corporate headquarters of large publicly listed companies.
The response of the Left over Left of the day was support regulation to stop these mergers and takeovers rather than applauding them as giving lazy capitalists their comeuppance. This regulation undermined the market the corporate control rather than strengthened it as Michael Jensen explains:
This political activity is another example of special interests using the democratic political system to change the rules of the game to benefit themselves at the expense of society as a whole.
In this case, the special interests are top-level corporate managers and other groups who stand to lose from competition in the market for corporate control. The result will be a significant weakening of the corporation as an organizational form and a reduction in efficiency.
Central to the hypothesis of the Twitter Left of CEOs overpaying themselves is there is free cash within the business they pocket in pay rises, fringe benefits and lavished corporate headquarters rather than pay out in dividends or invest in profitable investments.

The interests and incentives of managers and shareholders frequently conflict over the optimal size of the firm and the payment of free cash to shareholders. What to pay the top executives is a minor manifestation of this common entrepreneurial difference of opinion the future of the business.
These conflicts in entrepreneurial judgements are severe in firms with large free cash flows–more cash than profitable investment opportunities. Jensen defines free cash flow as follows:
Free cash flow is cash flow in excess of that required to fund all of a firm’s projects that have positive net present values when discounted at the relevant cost of capital. Such free cash flow must be paid out to shareholders if the firm is to be efficient and to maximize value for shareholders.
Payment of cash to shareholders reduces the resources under managers’ control, thereby reducing managers’ power and potentially subjecting them to the monitoring by the capital markets that occurs when a firm must obtain new capital. Financing projects internally avoids this monitoring and the possibility that funds will be unavailable or available only at high explicit prices.
Michael Jensen developed a theory of mergers and takeovers based on free cash flows that explains:
- the benefits of debt in reducing agency costs of free cash flows,
- how debt can substitute for dividends,
- why diversification programs are more likely to generate losses than takeovers or expansion in the same line of business or liquidation-motivated takeovers,
- why bidders and some targets tend to perform abnormally well prior to takeover.
Michael Jensen noted that free cash flows allowed firms’ managers to finance projects earning low returns which, therefore, might not be funded by the equity or bond markets. Examining the US oil industry, which had earned substantial free cash flows in the 1970s and the early 1980s, he wrote that:
[the] 1984 cash flows of the ten largest oil companies were $48.5 billion, 28 percent of the total cash flows of the top 200 firms in Dun’s Business Month survey.
Consistent with the agency costs of free cash flow, management did not pay out the excess resources to shareholders. Instead, the industry continued to spend heavily on [exploration and development] activity even though average returns were below the cost of capital.
Jensen also noted a negative correlation between exploration announcements and the market valuation of these firms—the opposite effect to research announcements in other industries. Not surprisingly, after a successful corporate takeover, there is major changes to realise the untapped benefits they saw in the company that the incumbent management were not seizing capturing:
Corporate control transactions and the restructurings that often accompany them can be wrenching events in the lives of those linked to the involved organizations: the managers, employees, suppliers, customers and residents of surrounding communities.
Restructurings usually involve major organizational change (such as shifts in corporate strategy) to meet new competition or market conditions, increased use of debt, and a flurry of recontracting with managers, employees, suppliers and customers.
All modern theories of the focus in part or in full on reducing opportunistic behaviour, cheating and fraud in employment and commercial relationships. The market the corporate control, and mergers and takeovers realise large benefits from displacing underperforming manager teams. Premiums in hostile takeover offers historically exceed 30 percent on average. Acquiring-firm shareholders on average earn about 4 percent in hostile takeovers and roughly zero in mergers.

In terms of corporate control, Eugene Fama divides firms into two types: the managerial firm, and the entrepreneurial firm.
The entrepreneurial firms are owned and managed by the same people (Fama and Jensen 1983b). Mediocre personnel policies and sub-standard staff retention practices within entrepreneurial firms are disciplined by these errors in judgement by owner-managers feeding straight back into the returns on the capital that these owner-managers themselves invested. Owner-managers can learn quickly and can act faster in response the discovery of errors in judgement. The drawback of entrepreneurial firms is not every investor wants to be hands-on even if they had the skills and nor do they want to risk being undiversified.
The owners of a managerial firm advance, withdraw, and redeploy capital, carry the residual investment risks of ownership and have the ultimate decision making rights over the fate of the firm (Klein 1999; Foss and Lien 2010; Fama 1980; Fama and Jensen 1983a, 1983b; Jensen and Meckling 1976).
Owners of a managerial firm, by definition, will delegate control to expert managerial employees appointed by boards of directors elected by the shareholders (Fama and Jensen 1983a, 1983b). The owners of a managerial firm will incur costs in observing with considerable imprecision the actual efforts, due diligence, true motives and entrepreneurial shrewdness of the managers and directors they hired (Jensen and Meckling 1976; Fama and Jensen 1983b).
Owners need to uncover whether a substandard performance is due to mismanagement, high costs, paying the employees too much or paying too little, excessive staff turnover, inferior products, or random factors beyond the control of their managers (Jensen and Meckling 1976; Fama and Jensen 1983b, 1985).
Many of the shareholders in managerial firms have too small a stake to gain from monitoring managerial effort, employee performance, capital budgets, the control of costs and the stinginess or generosity of wage and employment policies (Manne 1965; Fama 1980; Fama and Jensen 1983a, 1983b; Williamson 1985; Jensen and Meckling 1976). This lack of interest by small and diversified investors does not undo the status of the firm as a competitive investment nor introduce slack in the monitoring of payments to top executives.

Large firms are run by managers hired by diversified owners because this outcome is the most profitable form of organisation to raise capital and then find the managerial talent to put this pool of capital to its most profitable uses (Fama and Jensen 1983a, 1983b, 1985; Demsetz and Lehn 1985; Alchian and Woodward 1987, 1988).
More active investors will hesitate to invest in large managerial firms whose governance structures tolerate excessive corporate waste and do not address managerial slack and and overpaid executives. Financial entrepreneurs will win risk-free profits from being alert and being first to buy or sell shares in the better or worse governed firms that come to their notice.
The risks to dividends and capital because of manifestations of corporate waste, reduced employee effort, and managerial slack and aggrandisement in large managerial firms are risks that are well known to investors (Jensen and Meckling 1976; Fama and Jenson 1983b). Corporate waste and managerial slack also increase the chances of a decline in sales and even business failure because of product market competition (Fama 1980; Fama and Jensen 1983b).
Investors will expect an offsetting risk premium before they buy shares in more ill-governed managerial firms. This is because without this top-up on dividends, they can invest in plenty of other options that foretell a higher risk-adjusted rate of return. The discovery of monitoring or incentive systems that induce managers to act in the best interest of shareholders are entrepreneurial opportunities for pure profit (Fama and Jensen 1983b, 1985; Alchian and Woodward 1987, 1988; Demsetz 1983, 1986; Demsetz and Lehn 1985; Demsetz and Villalonga 2001).
Investors will not entrust their funds to who are virtual strangers unless they expect to profit from a specialisation and a division of labour between asset management and managerial talent and in capital supply and residual risk bearing (Fama 1980; Fama and Jensen 1983a, 1983b; Demsetz and Lehn 1985). There are other investment formats that offer more predictable, more certain rate of returns.
Competition from other firms will force the evolution of devices within the firms that survive for the efficient monitoring the performance of the entire team of employees and of individual members of those teams as well as managers (Fama 1980, Fama and Jensen 1983a, 1983b; Demsetz and Lehn 1985). These management controls must proxy as cost-effectively as they can having an owner-manager on the spot to balance the risks and rewards of innovating.
The reward for forming a well-disciplined managerial firm despite the drawbacks of diffuse ownership is the ability to raise large amounts in equity capital from investors seeking diversification and limited liability (Demsetz 1967; Jensen and Meckling 1976; Fama 1980; Fama and Jensen 1983b; Demsetz and Lehn 1985). Portfolio investors may know little about each other and only so much about the firm because diversification and limited liability makes this knowledge less important (Demsetz 1967; Jensen and Meckling 1976; Alchian and Woodward 1987, 1988).
It is unwise to suppose that portfolio investors will keep relinquishing control over part of their capital to virtual strangers who do not manage the resources entrusted to them in the best interests of the shareholders (Demsetz 1967; Williamson 1985; Fama 1980, 1983b; Alchian and Woodward 1987, 1988).
Managerial firms who are not alert enough to develop cost effective solutions to incentive conflicts and misalignments will not grow to displace rival forms of corporate organisation and methods of raising equity capital and loans, allocating legal liability, diversifying risk, organising production, replacing less able management teams, and monitoring and rewarding employees (Fama and Jensen 1983a, 1983b; Fama 1980; Alchian 1950).
Entrepreneurs will win profits from creating corporate governance structures that can credibly assure current and future investors that their interests are protected and their shares are likely to prosper (Fama 1980; Fama and Jensen 1983a, 1983b, 1985; Demsetz 1986; Demsetz and Lehn 1985). Corporate governance is the set of control devices that are developed in response to conflicts of interest in a firm (Fama and Jensen 1983b).
At bottom, the private sector is highly successful designing forms of organisation that allow large sums of money, billions of dollars to be raised in the capital market and entrusted to management teams.
via The Rise and Rise of the Super-Rich – The Atlantic and How the Richest 400 People in America Got So Rich – The Atlantic.
Digital News readers are cheapies
14 May 2015 Leave a comment
in economics of media and culture, entrepreneurship, industrial organisation, survivor principle Tags: creative destruction, digital media, entrepreneurial alertness, legacy media, newspapers
Is the supply of gods a natural monopoly?
14 May 2015 Leave a comment
in economics of religion, industrial organisation Tags: natural monopolies
Creative destruction in magazines
13 May 2015 Leave a comment
in economic history, economics of media and culture, entrepreneurship, industrial organisation, survivor principle Tags: creative destruction, entrepreneurial alertness, Internet, legacy media, magazines, market selection


Recent Comments