this is the line set at a chosen level in a reference year (now 2007), and held fixed in real terms (CPI adjusted)
the concept of ‘poverty’ here is – have the incomes of low-income households gone up or down in real terms compared with what they were previously?
‘moving line’:
this is the fully relative line that moves when the median moves (e.g. if median rises, the poverty line rises and reported poverty rates increase even if low incomes stay the same)
the concept of ‘poverty’ here is – have the incomes of low-income households moved closer or further away from the median?
Is child poverty in New Zealand 245,000 children or 305,000 children?
260,000 kids in income poverty, 180,000 in material hardship, 10% in severe poverty, 3in5 in poverty for a long time http://t.co/Oy5cWftvwU— Child Poverty NZ (@povertymonitor) May 21, 2015
If you base your estimate of child poverty on the 60% of median income after housing costs moving line, which is the number of low income households who moved further away from 60% of median income, a median which increased by 5% last year, the figure is 305,000 children after housing costs. 45,000 children are in households that is not as close to the median as last year but are not necessarily any poorer than last year in terms of money coming into the house.
If you base your estimate on the anchored line, which is the number of low income households whose income has gone up on down compared to what they were on previously,the number of children in poverty has increased from 235,000 to 245,000 after housing costs. About 10,000 children are poorer than last year – poorer enough than last year to be classified as in poverty.
The average commute by public transport is 40 minutes as compared to less than 25 in a car. 74% of Aucklanders drive to work and another 9% are a passenger in a car.
No information was available on those who bike to work because only 1% of Aucklanders bike to work. Only 2% of all New Zealanders take a bike to work. The sample size was therefore too small. Yet another reason to ban bikes at night. Few commute on this mode of transport in Auckland.
The near identical commuting distances irrespective of the mode of transport except walking is further evidence that people are quite discerning in balancing commuting times and job selection as per the theory of compensating differentials. Indeed, average commuting times in Auckland are much the same as the average commuting time in America.
Improving the commuting times in one mode of transport will mean people simply take the mode of peak hour transport that is suddenly become less congested while others who were not going to commute at peak times or start commuting at peak times as Anthony Downs explains:
If that expressway’s capacity were doubled overnight, the next day’s traffic would flow rapidly because the same number of drivers would have twice as much road space.
But soon word would spread that this particular highway was no longer congested. Drivers who had once used that road before and after the peak hour to avoid congestion would shift back into the peak period. Other drivers who had been using alternative routes would shift onto this more convenient expressway. Even some commuters who had been using the subway or trains would start driving on this road during peak periods.
Within a short time, this triple convergence onto the expanded road during peak hours would make the road as congested as it was before its expansion.
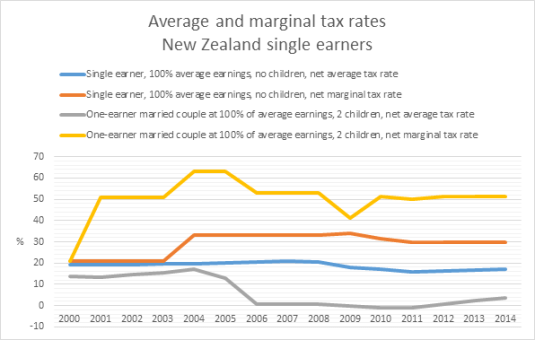
Interesting to notice that in New Zealand and the USA after these increases in marginal tax rates on single taxpayers, their economies slowed down. What appears to have happened is a number of people reached the next income tax marginal tax rate threshold.
21% would have been a good guess of the average and marginal tax rates of the New Zealand single earner or couple including with children and even a second earner in 2001. New Zealand average and marginal tax rates have been on a wild ride since the year 2000.
As the above chart shows, while the average tax rate of a single earner with no children is pretty much unchanged at about 20%, he now faces a marginal tax rate of 30% or more rather than 21% in 2001.
For a married couple with one income, as the above chart shows, their average tax rate has been about zero for a good 10 years now but their net marginal tax rate is a good 50% or more because of abatement rates on family tax credits, which is a skewed incentive situation. A large income effect from the family tax credit encourages the consumption of leisure but a high marginal tax rate discourages working more.
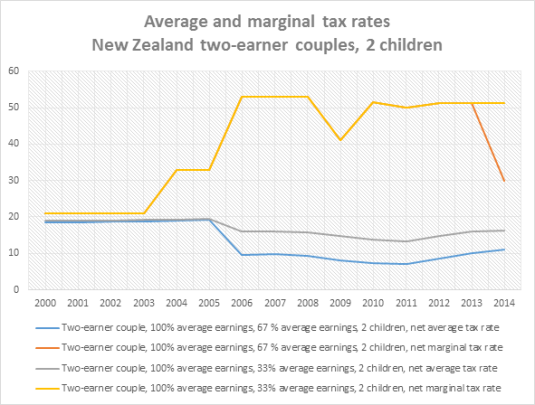
For two earner couples, their average tax rates have fallen because of family tax credits but their marginal tax rates have gone through the roof as the above chart shows. A tax system that discourages quite severely any further work or investment in human capital by average earners may have adverse effects on the long-term trend growth rate of New Zealand.
Ratio of Median Salary of Top 25 Highest Paid MLB Player to Avg. Worker Pay Increased from 100:1 to 700:1 Since 1988 http://t.co/5zLktBXS3D— Mark J. Perry (@Mark_J_Perry) August 18, 2015
to 51% for one earner couples with two children in 2001 and stayed up above 50% until 2014; and
to 33% for single earners with no children in 2004 because income growth pushed them into the next tax rate bracket which then dropped down to 30% in 2011.
to 33% in 2004 for two earner couples with the second earner earning 33% of average earnings and then increased to 53% in 2006 and stayed high thereafter;
to 33% in 2004 for a two earner couple with the second earner earning 67% of average earnings and then increased further to 53% in 2006 and stayed high until 2014 when their marginal income tax rate dropped to 30%; and
These large increases in marginal tax rates on single earners and families coincided with a slowing of the economy in about 2005. The economy started to pick up again when there were tax cuts introduced by the incoming National Party Government. Is that more than a coincidence?
A flat line in the above figure is growth at the trend growth rate of 1.9% of the USA in the 20th century. A rising line is above trend growth for that year while a falling lined is below trend rate in GDP per working age person.
In the lost decades of New Zealand growth between 1974 In 1992, New Zealand lost 34% against trend growth which was never recovered. There was about 13 years of sustained growth at about the trend rate or slightly above that between 1992 and 2005. The entire income gap between Australia and New Zealand open up during these lost decades of growth between 1974 and 1992.
Australia grew pretty much in its trend rate of growth since the 1950s. The so-called resources boom is not visible such as showing up as above trend rate growth.
In the UK, foreign-born are much more likely to be over qualified than native born highly educated not in education with less difference between men and women. More men than women are overqualified for their jobs in the UK. Over qualification is less of a problem in the UK than in the USA and Canada.
In the USA and Canada, there are few differences between native and foreign born men in over-qualification rates. Foreign-born women tend to be more over-qualified than native born women in the USA and more so in Canada. Many more workers are overqualified for their jobs in the USA and Canada as compared to the UK.
There are large differences in the percentage of people with tertiary degrees and the education premium between these three countries that are outside the scope of this blog post. These trends may explain differences in the degree of educational mismatch.
To begin with, under human capital theories of labour market and job matching, what appears to be over-schooling substitutes for other components of human capital, such as training, experience and innate ability. Not surprisingly, over-schooling is more prominent among younger workers because they substitute schooling for on-the-job training. A younger worker of greater ability may start in a job below his ability level because he or she expects a higher probability to be promoted because of greater natural abilities. Sicherman and Galor (1990) found that:
overeducated workers are more likely to move to a higher-level occupation than workers with the required level of schooling
Investment in education is a form of signalling. Workers invest so much education that they appear to be overqualified in the eyes of officious bureaucrats. The reason for this apparent overinvestment is signalling superior quality as a candidate. Signalling seems to be an efficient way of sorting and sifting among candidates of different ability. The fact that signalling survives in market competition suggests that alternative measure ways of measuring candidate quality that a more reliable net of costs are yet to be discovered.
Highly educated workers, like any other worker, must search for suitable job matches. Not surprisingly, the first 5 to 10 years in the workforce are spent in half a dozen jobs as people seek out the most suitable match in terms of occupation, industry and employer. Some of these job seekers who are highly educated will take less suitable jobs while they search on-the-job for better matches. Nothing is free or instantly available in life including a good job match.
A more obvious reason for over qualification is some people like attending university and other forms of education for the sheer pleasure of it.
Anyone who encounters the words over-qualified and over-educated should immediately recall concepts such as the pretence to knowledge, the fatal conceit, and bureaucratic busybodies. As Edwin Leuven and Hessel Oosterbeek said recently:
The over-education/mismatch literature has for too long led a separate life of modern labour economics and the economics of education.
We conclude that the conceptional measurement of over-education has not been resolved, omitted variable bias and measurement error are too serious to be ignored, and that substantive economic questions have not been rigorously addressed.
Why Evolution is True is a blog written by Jerry Coyne, centered on evolution and biology but also dealing with diverse topics like politics, culture, and cats.
In Hume’s spirit, I will attempt to serve as an ambassador from my world of economics, and help in “finding topics of conversation fit for the entertainment of rational creatures.”
“We do not believe any group of men adequate enough or wise enough to operate without scrutiny or without criticism. We know that the only way to avoid error is to detect it, that the only way to detect it is to be free to inquire. We know that in secrecy error undetected will flourish and subvert”. - J Robert Oppenheimer.


Recent Comments