13 Aug 2015
by Jim Rose
in applied price theory, applied welfare economics, economic history, economics of media and culture, income redistribution, labour economics, politics - New Zealand, poverty and inequality, Public Choice
Tags: capitalism and freedom, Leftover Left, The Great Enrichment, The Great Fact, top 1%, Twitter left
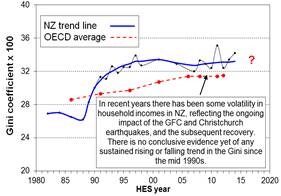
Bill Rosenberg at the Council of Trade Unions was good enough to tweet a Treasury chart that shows next to no increases in inequality in New Zealand for at least 20 years.
Inequality in both market and disposable incomes has been stable for a good 20 years, as the above tweet shows, while inequality in consumption has been falling. To back this interpretation of mine up, coincidentally today Bryan Perry published his annual report on income and inequality under the banner of the Ministry of Social Development.
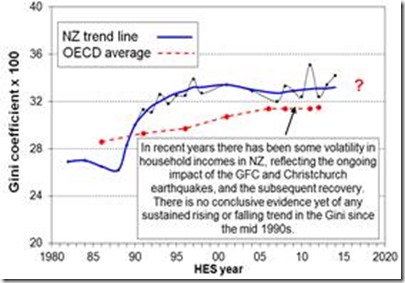
His report showed that there be no significant increase in New Zealand in at least 20 years.
13 Aug 2015
by Jim Rose
in business cycles, discrimination, gender, human capital, job search and matching, labour economics, labour supply, macroeconomics, occupational choice
Tags: female labour force participation, male labour force participation, recessions and recoveries
13 Aug 2015
by Jim Rose
in labour economics, politics - Australia, politics - New Zealand, politics - USA, unions
Tags: Australia, British economy, union membership, union power, union wage premium
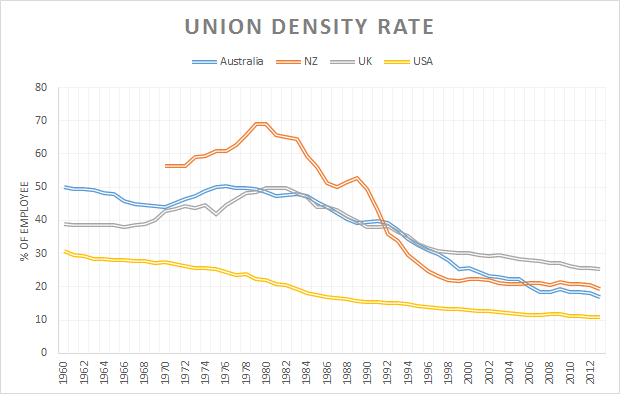
Unions have been in a long-term decline in Australia, New Zealand, the UK and the USA for as far back as survey and administrative data can be collected. There is a bit of a hump in union membership in the mid-1970s in New Zealand, Australia and the UK but that was about it.
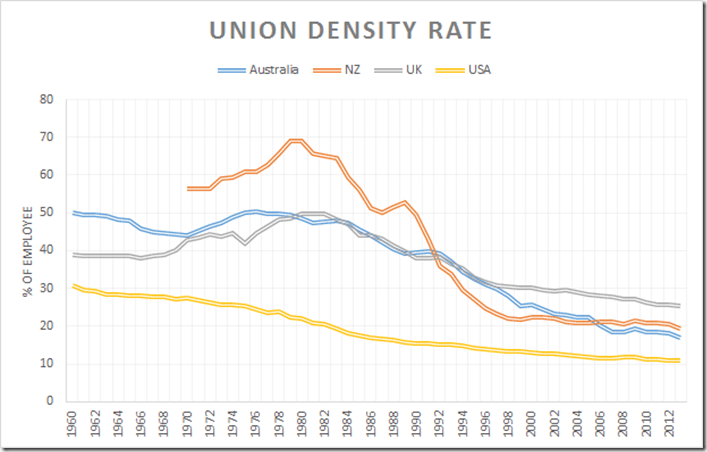
Source: Source: OECD and J.Visser, ICTWSS database (Institutional Characteristics of Trade Unions, Wage Setting, State Intervention and Social Pacts, 1960-2010), version 3.0 (http://www.uva-aias.net/).
13 Aug 2015
by Jim Rose
in applied welfare economics, economic history, economics of regulation, labour economics, politics - New Zealand, poverty and inequality, urban economics
Tags: antimarket bias, child poverty, expressive voting, family poverty, green rent seeking, housing affordability, land use planning, Leftover Left, New Zealand Greens, NIMBYs, rational ignorance, rational irrationality, RMA, zoning
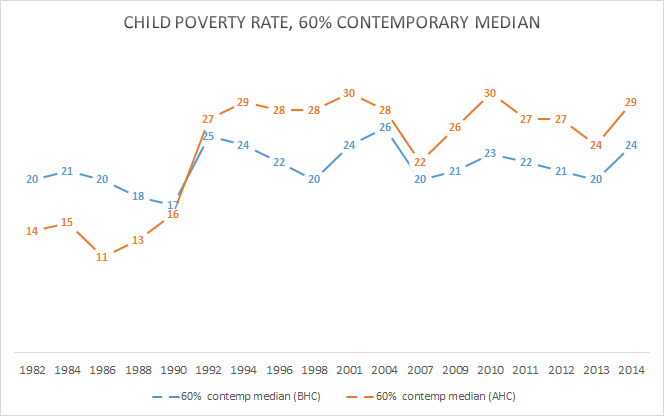
Nothing much has happening to child poverty before housing costs in New Zealand since the early 1980s. It is after housing costs poverty that is crucifying the children in New Zealand.
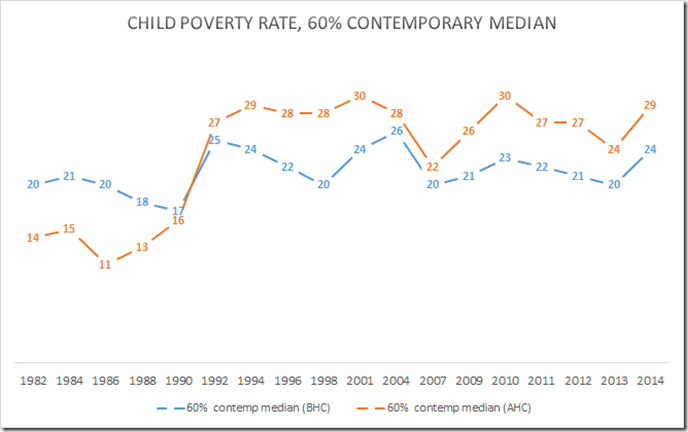
Source: Bryan Perry, Household Incomes in New Zealand: trends in indicators of inequality and hardship 1982 to 2014 – Ministry of Social Development, Wellington (August 2015), Table F6 and table F7.
From HES 2013 to HES 2014 median household income rose 5% in real terms (5% above the CPI inflation rate)…
On the AHC moving line measures, child poverty rates in HES 2014 are around the same as their peak after the GFC. A good amount of the rise from HES 2013 to HES 2014 is due to the large rise in the BHC median, as noted above, rather than a change in the numbers in low income per se.
Bryan Perry (2015, pp. 3, 7).
The parties that oppose measures to increase the supply of land and reduce the cost of housing through reform of the Resource Management Act and its many restraints on the supply of land are the New Zealand Labour Party and New Zealand Greens.
12 Aug 2015
by Jim Rose
in business cycles, economic history, Euro crisis, job search and matching, labour economics, macroeconomics, unemployment
Tags: employment law, equilibrium unemployment rate, Eurosclerosis, Italy, labour market regulation, natural unemployment rate, unemployment duration
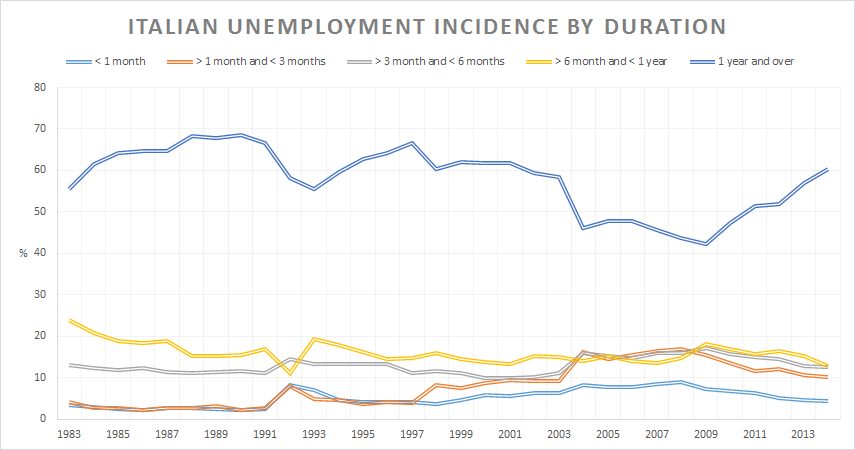
Unemployment of more than a year was slowly tapering down in Italy before the global financial crisis, but ever so slowly.
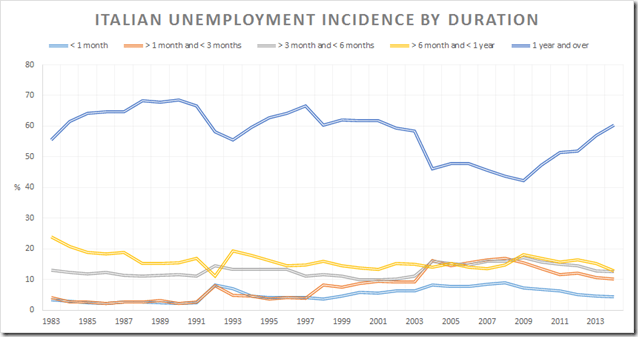
Source: OECD StatExtract.
11 Aug 2015
by Jim Rose
in economic history, Euro crisis, fiscal policy, job search and matching, labour economics, labour supply, macroeconomics, unemployment, welfare reform
Tags: equilibrium unemployment rate, Eurosclerosis, German unification, Germany, natural unemployment rate, poverty traps, unemployment duration, unemployment insurance, welfare state
German long term unemployment has been pretty stable albeit with an up-and-down after German unification. There is also a fall in long-term unemployment after some labour market reforms around 2005.

Source: OECD StatExtract.
11 Aug 2015
by Jim Rose
in applied price theory, applied welfare economics, comparative institutional analysis, development economics, growth disasters, growth miracles, health and safety, human capital, industrial organisation, international economics, labour economics, survivor principle
Tags: agricultural economics, expressive voting, fair trade, rational irrationality
10 Aug 2015
by Jim Rose
in applied price theory, applied welfare economics, comparative institutional analysis, currency unions, economic growth, economic history, economics of regulation, entrepreneurship, Euro crisis, fiscal policy, global financial crisis (GFC), income redistribution, labour economics, labour supply, macroeconomics, Marxist economics, poverty and inequality, Public Choice, public economics, rentseeking
Tags: British disease, entrepreneurial alertness, Eurosclerosis, France, German unification, Germany, growth of government, sick man of Europe, social insurance, Sweden, taxation and entrepreneurship, taxation and investment, taxation and labour supply, welfare state
The Washington Centre for Equitable Growth recently tweeted that inequality harms growth in the USA as compared to Sweden, France, Germany and the UK. It was relying on some dodgy OECD research.
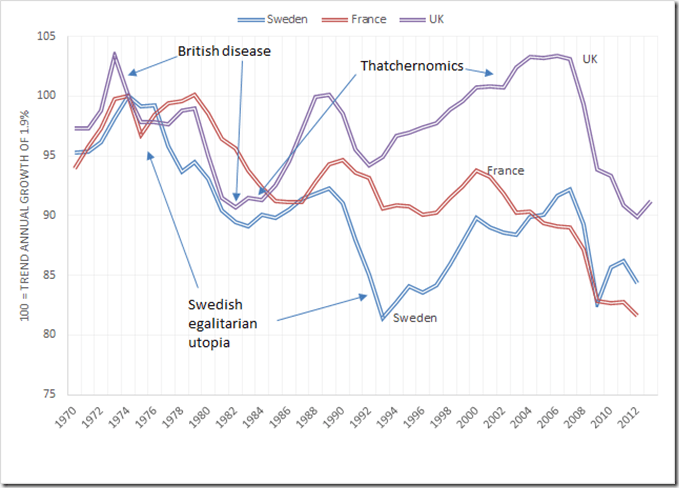
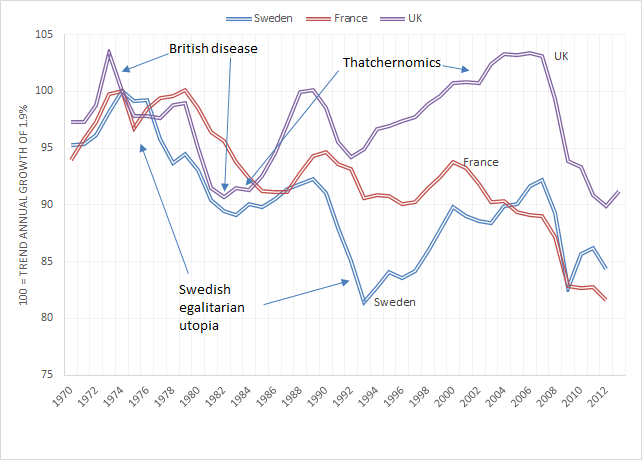
The Washington Centre for Equitable Growth did not check their inequality ratios they tweeted against trends in economic growth and economic policy since 1970, which I have reproduced in figure 1. Germany is not included in figure 1 because German data on growth is thrown askew by German unification.
Figure 1: Real GDP per British, French and Swede aged 15-64, 2014 US$ (converted to 2014 price level with updated 2011 PPPs), 1.9 per cent detrended, 1970-2013
Source: Computed from OECD Stat Extract and The Conference Board. 2015. The Conference Board Total Economy Database™, May 2015, http://www.conference-board.org/data/economydatabase/
Figure 1 shows that France has been in a long-term decline since the late 1970s despite the blessings of a more equal society than the USA as championed by the Washington Centre for Equitable Growth. In figure 1, a flat line is growth in real GDP per working age person, PPP, at the same rate as the USA for the 20th century, which was 1.9% per year. A falling line in figure 1 indicates growth of less than 1.9% while a rising line indicates growth in real GDP per working age person, PPP, in excess of 1.9%. In figure 1, France hardly ever grew at the trend rate of growth for the USA of 1.9% per year and was frequently well below that rate.

Sweden tells a slightly different story in figure 1 because of regime change in the early 1990s when Sweden adopted more liberal economic policies where taxes and government spending were reduced:
The rapid growth of the state in the late 1960s and 1970s led to a large decline in Sweden’s relative economic performance. In 1975, Sweden was the 4th richest industrialised country in terms of GDP per head. By 1993, it had fallen to 14th.
That regime change reversed a long economic decline since 1970 under the egalitarian policies of the Swedish Social Democratic Party. Under the Swedish Social Democratic Party, Sweden was almost always growing at less than the trend rate of growth of the USA, which was 1.9%. That position reversed only when there was a turn away from big government and high taxes.

Figure 1 tells a similar story for the British economy: a long economic decline in the 1970s when Britain was the sick man of Europe. Under Thatchernomics, Europe had a long economic boom for 20 years or more – see figure 1.
In the 1970s, under the high taxes of the Heath, Callaghan and Wilson administrations, as figure 1 shows, Britain was the sick man of Europe. With the election of the Thatcher Government, Britain soon grew at better than the US trend growth rate for nearly 20 years through few exceptions.
10 Aug 2015
by Jim Rose
in applied welfare economics, comparative institutional analysis, economic growth, economic history, economics of regulation, industrial organisation, labour economics, labour supply, macroeconomics, survivor principle
Tags: Eurosclerosis, Sweden, taxation and entrepreneurship, taxation and investment, taxation and labour supply, welfare state
10 Aug 2015
by Jim Rose
in business cycles, human capital, job search and matching, labour economics, labour supply, macroeconomics, politics - New Zealand, unemployment
Tags: equilibrium unemployment rate, hysteresis, long-term unemployment, natural unemployment rate, unemployment duration, unemployment rates
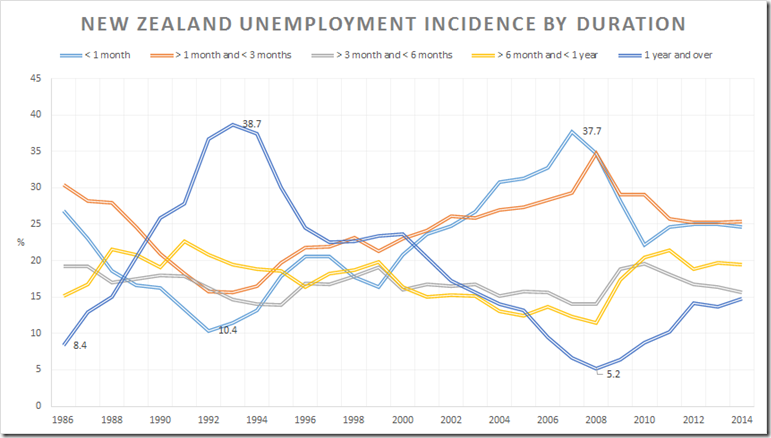
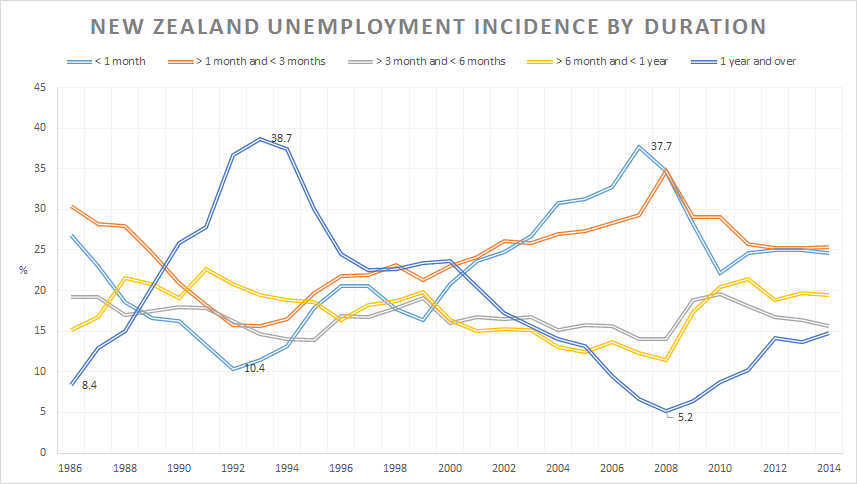
There has been bit of a wild ride in long-term unemployment in New Zealand. Long-term unemployment – longer than one year – ranging from just over 8% of unemployment in 1986 to nearly 40% in 1992 then down to 5% in 2008. Clearly the duration of unemployment in New Zealand is highly sensitive to the business cycle unlike the case in the USA or UK.
Source: OECD StatExtract.
This sensitivity of long-term unemployment to the business cycle does not bode well for the hypothesis of hysteresis where human capital depreciates the longer a jobseeker is out of employment. For this hypothesis to hold, there must be some enduring aspect of long-term unemployment rather than just going up and down with the business cycle rather noticeably.

The rival hypothesis to hysteresis is the long-term unemployed tend to be those who have a lot of trouble getting employment, which is why they end up been unemployed for a long time. Again in New Zealand, these less employable jobseekers appear to be able to find jobs quite easily when the labour market is good.
09 Aug 2015
by Jim Rose
in business cycles, economic history, global financial crisis (GFC), job search and matching, labour economics, labour supply, macroeconomics, unemployment
Tags: British disease, British economy, equilibrium unemployment rate, Margaret Thatcher, natural unemployment rate, unemployment duration, unemployment rates
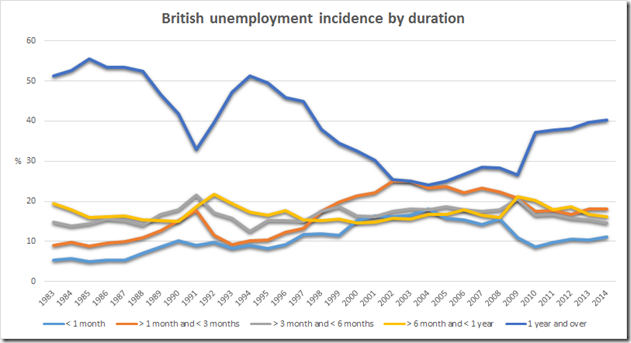
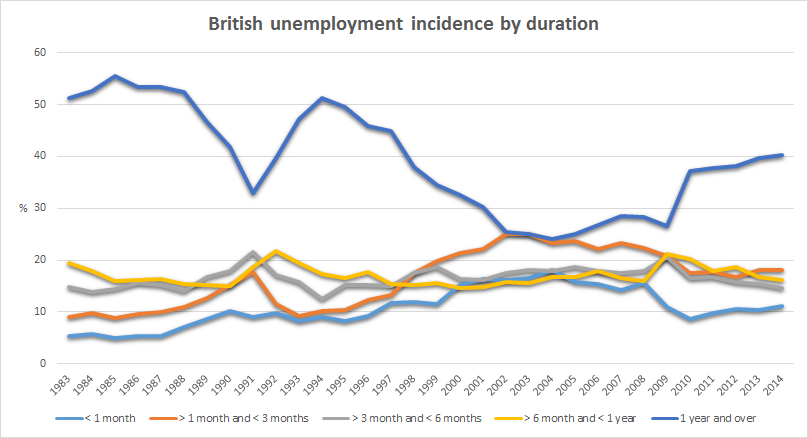
In contrast to the USA, there is been a long-term decline in long-term unemployment, that is unemployment of more than a year, in the British economy over the 1990s. The situation then stabilised and then increased after the global financial crisis. There is also a rather rapid fall in long-term unemployment in the mid-1980s as the British economy recovered under Thatchernomics
Source: OECD StatExtract.
08 Aug 2015
by Jim Rose
in budget deficits, great recession, job search and matching, labour economics, labour supply, macroeconomics, politics - USA, unemployment, welfare reform
Tags: natural unemployment rate, taxation and labour supply, unemployment duration, unemployment insurance, unemployment rates, welfare state
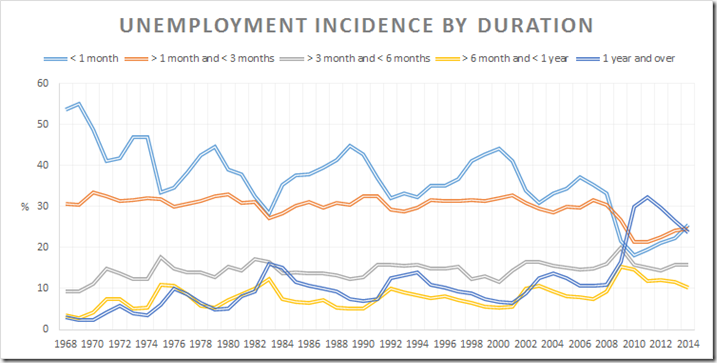
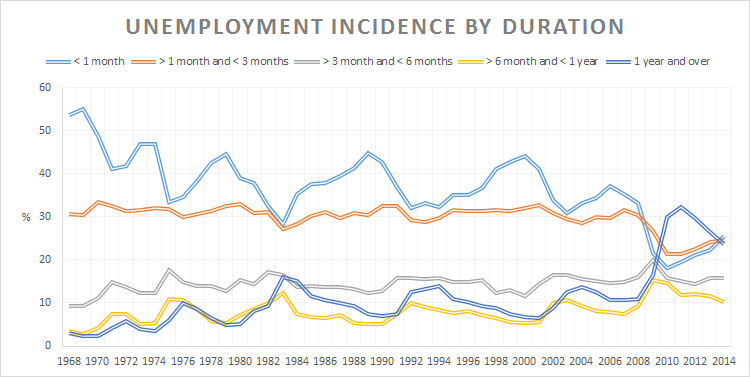
The Great Recession was the first recession in the USA in a good 40 to 50 years where the composition of employment changed by much. Even the big recession at the beginning of the 1980s did not do much to the composition of unemployment by duration in the USA.
Source: OECD StatExtract.
Those unemployed for more than a year moved from barely double digits even in a bad recession prior to 2008 to coming on one-third of all unemployed. Likewise, those unemployed for less than a month halved from 40% to 20%. Something changed in the US labour market with the Great Recession and the long extensions of unemployment insurance from 26 weeks to 52 weeks and then 99 weeks.
Previous Older Entries Next Newer Entries



Recent Comments