Two dogs of an investment propped up a $20 billion portfolio that a few years later was worth less than 1/5 of that. Both of these stalwarts are now worth not even one dollar.
Source:New Zealand Treasury – information released under the Official Information Act, January 2016.
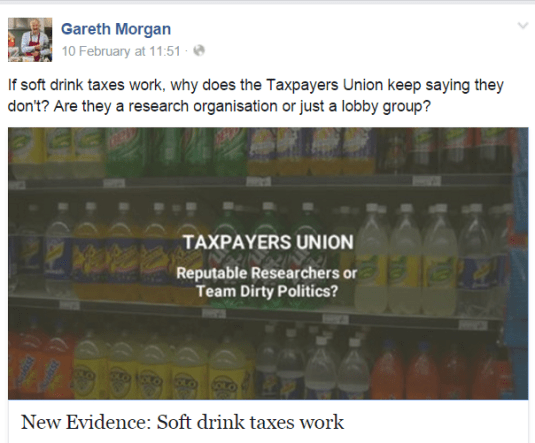
Do-gooding curmudgeon Gareth Morgan takes great pride in his positions on public policy and health and safety such as a sugar tax are evidence-based.
He is quick to suggest that those that disagree with them are ignorant or steeped in moral turpitude, preferably both. His offsider has even suggested that I am too dogmatic to bother arguing with. Me!
It will be a slow train coming before Gareth Morgan takes an evidence-based health and safety approach to bikes and swimming. They are dangerous activities that should be banned if he is to be consistent. Morgan is a keen motorcyclist and recently asked for exclusive access to a seaside batch.
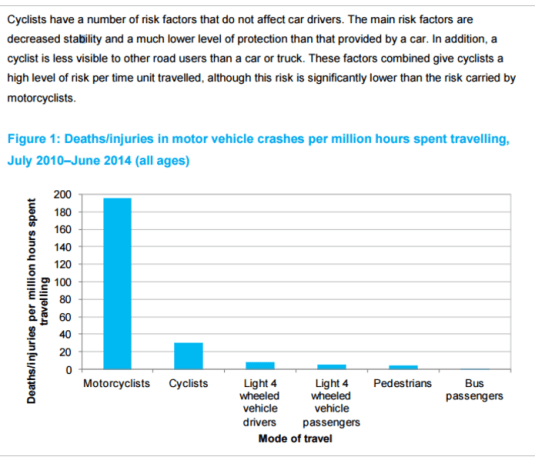
As I have previously argued, all the evidence suggests that riding a bike is dangerous. Both motorcycles and bicycles are way more dangerous than travelling by car.
Riding a motorbike and a bike should both be banned to protect motorcyclists and bicyclists from themselves. Like people who drink sugary drinks, they just do not understand the risks.
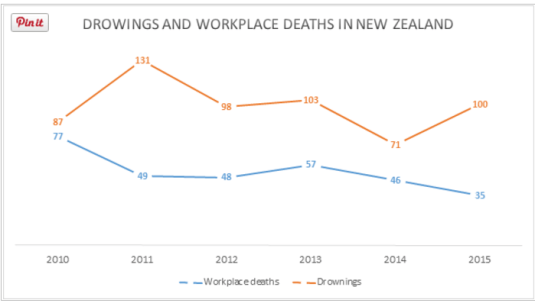
Swimming is an even more dangerous activity with multiple fatalities of a weekend common in summer. Again, people do not understand the risks of swimming both in the city and in rivers. They must be protected from themselves.
The argument that Gareth Morgan and his entourage will make in response to a demand for bans is the exact same one made against the food police.
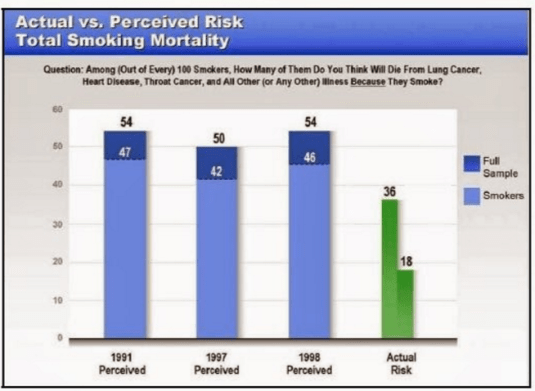
I am sure Morgan will point out that people know that riding a bike or swimming is dangerous. Even those living in a cave also know that drinking sugary drinks and having a smoke is also dangerous. Indeed, the evidence is people overestimate the risks of these socially disapproved activities rather than underestimate them.
The argument that Morgan and his entourage would use against banning bikes, motorbikes and swimming is voluntary assumption of risk.
We live in a free society. If people want to lead a risky life, they are free to do so as long as they do not harm others.
Morgan is quick to point out the cost of the public health system of sugary drinks and other targets of the food police andthe safety Nazis.
Last time I looked, bicycle and motorbike accidents resulting trips to emergency wards and other expenses to the taxpayer.
You cannot have it both ways. Arguing that the fiscal cost of sugary drinks and other roads is a rationale for regulating their consumption. That argument applies just as strongly to the case for – updated banning motorbikes, bicycles and swimming.
Here is a quick doco by @vice on our trip around North Korea – North Korean Motorcycle Diaries http://t.co/R0XPBhK0py
Until Gareth Morgan’s do-gooding extends to calling for the banning of a passion of his life, which is motorcycling, his evidence-based crusades do not have much standing.
You cannot reject voluntary assumption of risk on a selective basis especially when you engage in one of those risky activities yourself.
UPDATE: Morgan has in the past called for the insurance levy on motorbikes to reflect risk better than is the case now.
…research we’ve done at theMotorcycle Safety Advisory Councilindicates that the risk of serious and expensive injury on a motorcycle is around 45 times higher per person-kilometre travelled as it is for occupants of other vehicles.
And we have a lot more bumps, scrapes and bruises per person-kilometre as well.
It gets worse. We also found that up to 31 per cent of our injuries arise from incidents involving no other vehicles. In other words we do this to ourselves because we can’t handle the road conditions.
Now of course we can blame the road as some of us are wont to do, but the reality is in most cases it’s pure incompetence or lack of self-management.
Any charging regime that gives riders an incentive to ride within their level of competence, to self-manage risk by wearing better protective clothing for example, or even lifting competency levels has to be a win-win doesn’t it?
This is not a call for a ban. Moreover, this is just a calm discussion of actuarial risk and the rampant cross-subsidies in the New Zealand universal, no fault accident compensation scheme.
Buried in at all these remarks by Morgan is people have the right to take risks and ride a bike if they want. No similar courtesy to people who like sugary drinks and those who support their right to drink and eat what they please. No similar courtesy to honest disagreement over whether a sugar tax is worth the trouble and strife.
What I must also add is the Morgan Foundation is a famous advocate of sugar taxes but a little-known advocate of actuarially fair insurance levies on motorbike. If the notoriety was the other way around, this debate would have more credibility. That is why I missed it in the first draft of this post.
I am still waiting for Gareth Morgan to call for bans on advertising of motorbikes and bicycles to children and on children’s television because they are impressionable. Why are motorbike and bicycle ads safe for children but cigarette and junk food ads not?
Milton Friedman argued that people agree on most social objectives, but they differ often on the predicted outcomes of different policies and institutions. This leads us to Robert and Zeckhauser’s taxonomy of disagreement
Positive disagreements can be over questions of: 1. Scope: what elements of the world one is trying to understand? 2. Model: what mechanisms explain the behaviour of the world? 3. Estimate: what estimates of the model’s parameters are thought to obtain in particular contexts?
Values disagreements can be over questions of: 1. Standing: who counts? 2. Criteria: what counts? 3. Weights: how much different individuals and criteria count?
Any positive analysis tends to include elements of scope, model, and estimation, though often these elements intertwine; they frequently feature in debates in an implicit or undifferentiated manner. Likewise, normative analysis will also include elements of standing, criteria, and weights, whether or not these distinctions are recognised.
Obesity by Occupation: In US police, firefighters, & security lead the pack. #dataviz
The origin of political disagreement is a broad church in a liberal democracy. Those you disagree with are not evil, they just disagree with you. As Karl Popper observed:
There are many difficulties impeding the rapid spread of reasonableness. One of the main difficulties is that it always takes two to make a discussion reasonable. Each of the parties must be ready to learn from the other.
Feel-good policies attacking sugar in drinks will do nothing but provoke opposition and delay the day when people confront the fact that they are going to the fatter than their parents and their grandparents because they are richer.
I lost 18kg after I was diagnosed with type II diabetes. Giving up sugary drinks and biscuits contributed maybe 2 kg to that weight reduction. Central to that weight production was I was well motivated.
A rise in the price of a sugary drink and the political fight over that turns friends into enemies and is a distraction from the larger cause.
Greg Mankiw was on point when he said that do we really think that meddling at this micro level of sugary drinks serves any purpose and can government be trusted to micromanage our lives with pushes rather than nudges:
To what extent should we use the power of the state to protect us from ourselves? If we go down that route, where do we stop?
Taxing soda may encourage better nutrition and benefit our future selves. But so could taxing candy, ice cream and fried foods. Subsidizing broccoli, gym memberships and dental floss comes next. Taxing mindless television shows and subsidizing serious literature cannot be far behind.
Even as adults, we sometimes wish for parents to be looking over our shoulders and guiding us to the right decisions. The question is, do you trust the government enough to appoint it your guardian?
I came across this data showing that New Zealand and Sweden had the same sized public sectors in the mid-1980s some years ago. The data could not be found again for a long time in the OECD statistical databases. One reason was the OECD changed its name to general disbursements.
The size of the public sector in Australia has not changed much for 30 odd years. The public sector has been in a long decline in Sweden and New Zealand since peaks as a percentage of nominal GDP in the late 1980s and early 1990s respectively.
I know of no comments on the large size of the New Zealand public sector as measured by general government expenditure in the late 1980s. Its contribution to the stagnant economic growth of that time is worth exploring.
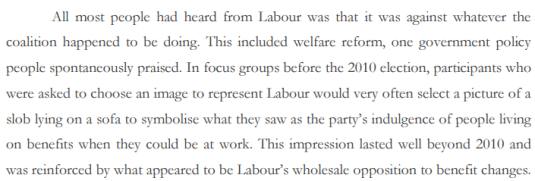
The focus group work of Lord Ashcroft after the 2015 British general election reinforces what was learnt about the New Zealand Labour Party’s drift away from the values of the working class.
In the 2014 election in New Zealand, the Labour Party promised to extend the in work tax credit for families to welfare beneficiaries. This was worth about $60 a week.
The following week was the worst week that Labour Party MPs and party workers experienced in their door-knocking. In their own Heartland electorates, the Labour Party door knockers received a hostile response to that proposal.
Working class Labour voters believe they had earned that family tax credit by working and it should not be paid to people who do not earn it by working.
There is a re-occurring theme among those who stopped voting labour everywhere is that Labour Party is are now too concerned about scroungers and are not interested enough in rewarding strivers, and in particular those who strive to improve themselves in the working class.
Ashcroft’s research after the 2010 British general election found that British voters who had stopped voting Labour after previously supporting it believed that the Labour Party did not have the right answers to important questions. 7 out of 10 of these voters believe that the expenditure cuts of the Conservative party when necessary.
Importantly for labour parties everywhere, two thirds of voters would take a lot of persuading before they voted for the British Labour Party again. Labour would need to change quite fundamentally before they did so again.
Many said they would wait until Labour had been re-elected and served a full term before they themselves considered voting Labour again. That means two thirds of the vote lost by Labour were unwilling to vote Labour again until the 2025 general election. They had really given up on Labour despite their support for it in the past. Issues such as a perception that Labour elected the wrong brother as its leader in 2010 were minor in comparison to this.
Fortunately for the Conservative Party, research among Labour Party members and Labour supporters in the trade unions tells a very different message as to why Labour lost the 2010 British general election.
These Labour Party members and supporters thought the voters were wrong to not vote for them according to the Ashcroft research after the 2010 election:
They thought they had lost because people did not appreciate what Labour had achieved; that voters had been influenced by the right-wing media; and that while Labour’s policies had been right, they had not been well communicated.
More than three quarters thought their party had not deserved to lose, and most rejected the idea that the Labour government had been largely to blame for the economic situation.
They thought the swing voters they had lost (and needed to win back) were ignorant, credulous and selfish. More than half thought the coalition would prove so unpopular that Labour would probably win the 2015 election without having to change very much.
The strength of British Labour in the eyes of many voters is it is seen as compassionate and concerned about fairness. Unfortunately for British Labour, many of the people who do not currently vote for Labour but are receptive to these messages of compassion and fairness re fiscal conservatives according to the Ashcroft research:
I found in my focus groups that this message was best received by those already most inclined to vote for the party.
It was less effective for those who had harder questions, particularly about how all this compassion and decency would be paid for. As one of our participants put it, ‘it’s all well and good to say we’re nicer people and we care about you more, but I want someone who can sort out the country’.
Why Evolution is True is a blog written by Jerry Coyne, centered on evolution and biology but also dealing with diverse topics like politics, culture, and cats.
In Hume’s spirit, I will attempt to serve as an ambassador from my world of economics, and help in “finding topics of conversation fit for the entertainment of rational creatures.”
“We do not believe any group of men adequate enough or wise enough to operate without scrutiny or without criticism. We know that the only way to avoid error is to detect it, that the only way to detect it is to be free to inquire. We know that in secrecy error undetected will flourish and subvert”. - J Robert Oppenheimer.


 The argument that Morgan and his entourage would use against banning bikes, motorbikes and swimming is voluntary assumption of risk.

 I am still waiting for Gareth Morgan to call for bans on advertising of motorbikes and bicycles to children and on children’s television because they are impressionable. Why are motorbike and bicycle ads safe for children but cigarette and junk food ads not?
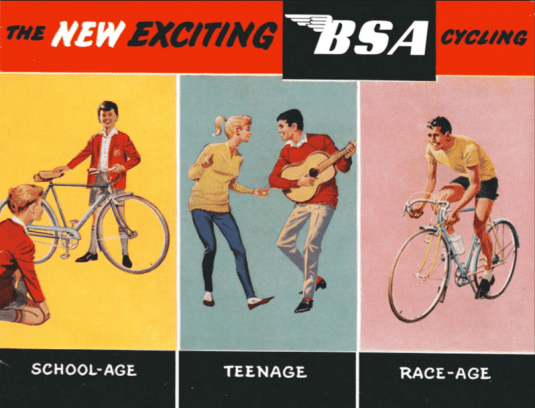


Recent Comments