Australia's most cherished winning streak is alive … barely. #gdp @jmcduling #ausbiz http://t.co/53kCMdi8a6 pic.twitter.com/0yEP3wpA9R
— SMH/Age Business (@BusinessDay) September 2, 2015
Longest time without a recession
02 Sep 2015 Leave a comment
in business cycles, economic growth, economic history, fiscal policy, global financial crisis (GFC), great recession, macroeconomics, monetary economics, politics - Australia, politics - New Zealand, politics - USA Tags: Australia, recessions and recoveries
Did Obama’s fiscal stimulus work?
30 Aug 2015 Leave a comment
in budget deficits, business cycles, fiscal policy, great recession, macroeconomics, politics - USA Tags: fiscal stimulus, obama
The ups and downs of the Greek economy
25 Aug 2015 1 Comment
in budget deficits, business cycles, currency unions, economic history, Euro crisis, fiscal policy, macroeconomics, Public Choice, rentseeking Tags: Eurosclerosis, Greece, sovereign debt crisis, sovereign defaults
@ObsoleteDogma @rodrikdani http://t.co/xKx43wjWHy—
David Andolfatto (@dandolfa) June 30, 2015
The current sizes of government
19 Aug 2015 Leave a comment
in fiscal policy, Public Choice Tags: size of government
Marginal tax rates of New Zealand average households since 2000
19 Aug 2015 Leave a comment
in economic growth, fiscal policy, labour economics, labour supply, macroeconomics, politics - Australia, politics - New Zealand Tags: Australia, lost decades, marriage and divorce, productivity shocks, real business cycles, taxation and labour supply
In 2000 in New Zealand, the marginal tax rates of single earners, married couples and dual income couples were 21%.
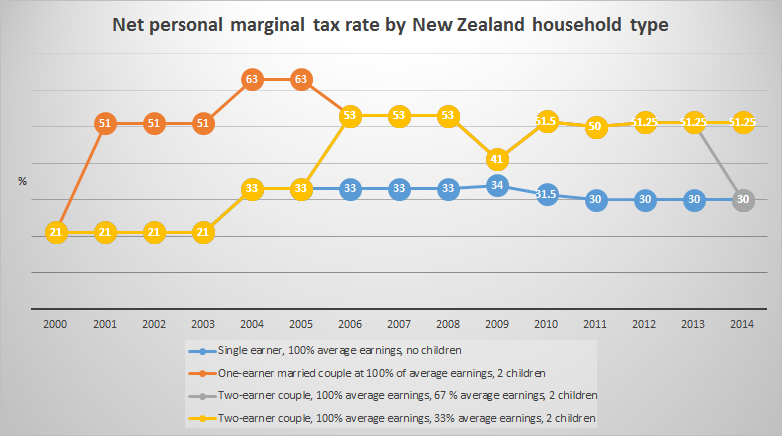
Sources: OECD StatExtract.and OECD Taxing Wages.
Net personal marginal income tax rates increased:
- to 51% for one earner couples with two children in 2001 and stayed up above 50% until 2014; and
- to 33% for single earners with no children in 2004 because income growth pushed them into the next tax rate bracket which then dropped down to 30% in 2011.
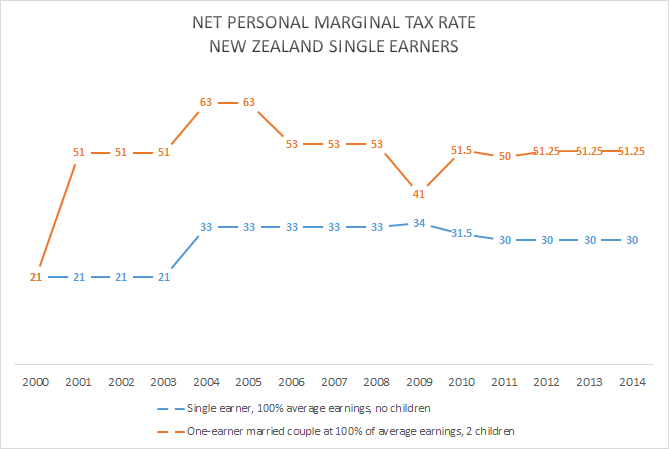
Sources: OECD StatExtract.and OECD Taxing Wages.
Net personal marginal income tax rates increased:
- to 33% in 2004 for two earner couples with the second earner earning 33% of average earnings and then increased to 53% in 2006 and stayed high thereafter;
- to 33% in 2004 for a two earner couple with the second earner earning 67% of average earnings and then increased further to 53% in 2006 and stayed high until 2014 when their marginal income tax rate dropped to 30%; and
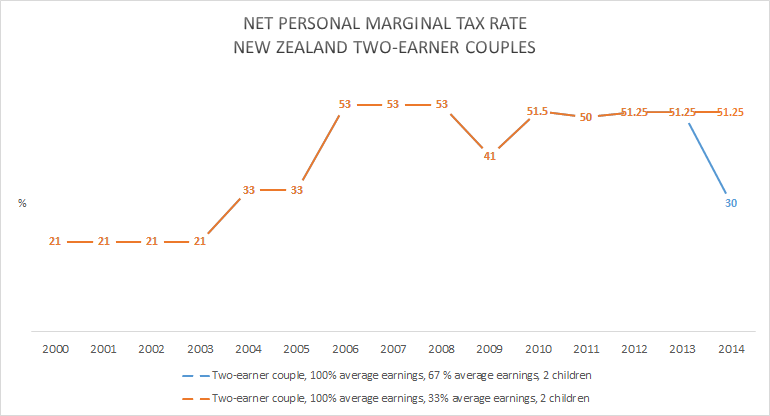
Sources: OECD StatExtract.and OECD Taxing Wages.
These large increases in marginal tax rates on single earners and families coincided with a slowing of the economy in about 2005. The economy started to pick up again when there were tax cuts introduced by the incoming National Party Government. Is that more than a coincidence?
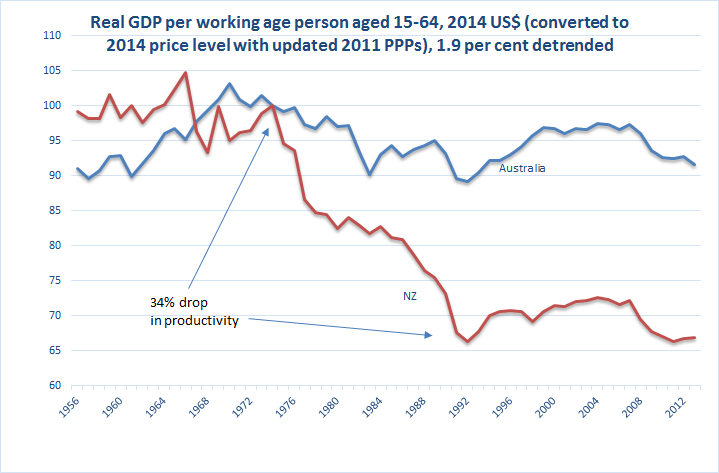
Sources: Computed from OECD StatExtract and The Conference Board. 2015. The Conference Board Total Economy Database™, May 2015, http://www.conference-board.org/data/economydatabase/.
A flat line in the above figure is growth at the trend growth rate of 1.9% of the USA in the 20th century. A rising line is above trend growth for that year while a falling lined is below trend rate in GDP per working age person.
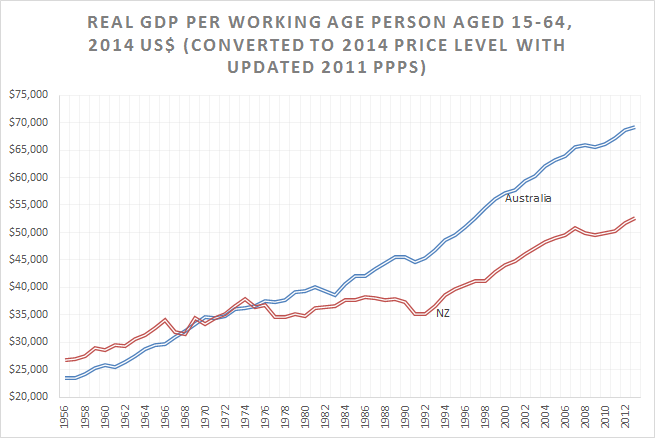
In the lost decades of New Zealand growth between 1974 In 1992, New Zealand lost 34% against trend growth which was never recovered. There was about 13 years of sustained growth at about the trend rate or slightly above that between 1992 and 2005. The entire income gap between Australia and New Zealand open up during these lost decades of growth between 1974 and 1992.
Sources: Computed from OECD StatExtract and The Conference Board. 2015. The Conference Board Total Economy Database™, May 2015, http://www.conference-board.org/data/economydatabase/.
Australia grew pretty much in its trend rate of growth since the 1950s. The so-called resources boom is not visible such as showing up as above trend rate growth.
The benefits and costs of the @NZSuperFund since its inception
17 Aug 2015 Leave a comment
in applied price theory, applied welfare economics, economic growth, economic history, entrepreneurship, financial economics, fiscal policy, industrial organisation, labour economics, labour supply, macroeconomics, politics - New Zealand, public economics Tags: ageing society, company tax rate, deadweight cost of taxes, demographic crisis, efficient markets hypothesis, laffer curve, New Zealand superannuation fund, old age pensions, retirement savings, social insurance, sovereign wealth funds, taxation and entrepreneurship, taxation and investment, taxation and labour supply
Most mutual funds still can't beat their benchmark read.bi/1GkTig1 http://t.co/r7ezoDGJbV—
BI Chart of the Day (@chartoftheday) June 03, 2015
The New Zealand Superannuation Fund, the sovereign wealth fund part funding New Zealand’s old-age pension from 2029/2030 onwards, has been a bit of a wild ride. Sometimes the earnings of the Fund were well below and sometimes earning well above the long-term bond rate.
![image_thumb[3]](https://utopiayouarestandinginit.com/wp-content/uploads/2015/08/image_thumb310.png "image_thumb[3]")
Source: New Zealand Superannuation Fund Annual Report 2014.
Since its inception, the Fund earned an average annual return of 9.78%, which was 5.06% above the long-term bond rate, and 1.03% above its reference portfolio.

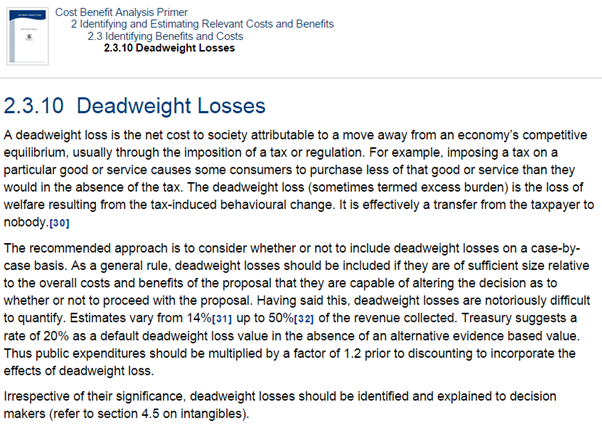
No information was given in the annual report of the New Zealand Superannuation Fund on the marginal dead weight cost of the taxes raised to fund the New Zealand Superannuation Fund to see whether there is any net benefit to taxpayers from its establishment and continued operation.
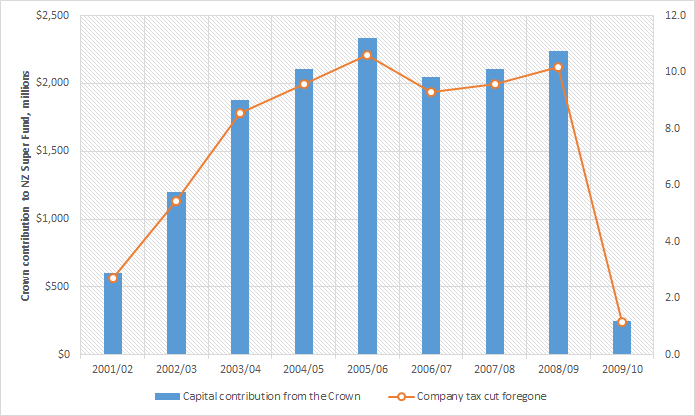
The New Zealand Government has contributed $14.88 billion to the fund from prior its inception in 2001 to the suspension of contributions in 2009 by the incoming National Party Government.
Source: New Zealand Treasury.
Over the nine years in which contributions were made, the company tax rate of 28% could have easily been up to 10 percentage points lower.
The New Zealand Treasury estimates that a one percentage point cut in the company tax costs about $220 million in forgone revenue if there are no other changes to the tax system. These are static estimates that do not include any feedback from greater investment and higher growth.
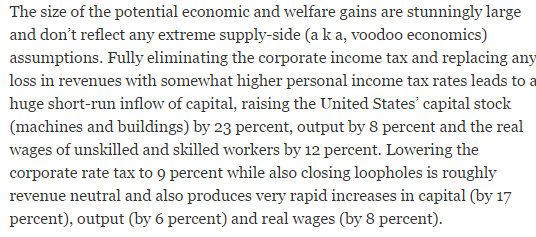
The New Zealand Superannuation Fund must beat the market every single year to make up for the deadweight cost of its funding, a premium for the investment risk added to the Crown’s portfolio and the cost to New Zealand’s growth rate of higher than otherwise taxes on income, entrepreneurship and investment.
Source: Abolish the Corporate Income Tax – The New York Times.
UK has the lowest company tax rate in the G20
16 Aug 2015 Leave a comment
in applied price theory, economic growth, fiscal policy, macroeconomics, politics - Australia, politics - New Zealand, politics - USA, Public Choice, public economics Tags: British economy, company tax rate, company taxation, optimal tax theory, race to the top, tax competition
IFS Friday Figure: UK has the lowest corporate tax rate in the G20 #Budget2015 announced a 2% cut by 2020 #IFSFriFig http://t.co/T4Oq6ZXYd4—
IFS (@TheIFS) July 24, 2015
Explanation of the Greece Bailout in 90 Seconds
13 Aug 2015 Leave a comment
in budget deficits, business cycles, currency unions, economic growth, fiscal policy, international economic law, international economics, International law, macroeconomics Tags: credible commitments, Eurosclerosis, game theory, Greece, sovereign bailouts, sovereign defaults
Recurrent business cycles without shocks – the role of lumpy investments
11 Aug 2015 Leave a comment
in business cycles, economic growth, Edward Prescott, entrepreneurship, financial economics, fiscal policy, industrial organisation, macroeconomics, Milton Friedman, monetarism, monetary economics Tags: Edward Prescott, mega sports events, mega-projects, Mexico, Norway, prosperity and depression, R&D, real business cycles, Richard Rogerson, Robert Barro, technology diffusion lags
Think it is time for a re-post of @LHSummers' brilliant, brilliant paper on RBC from 1986. minneapolisfed.org/research/qr/qr… http://t.co/S7tGIjEebI—
Simon H (@simonhinrichsen) August 10, 2015
The brilliant monetary economist Scott Freeman was one of the 1st to show the existence of real business cycles without the need of shocks to drive the ups and downs of the economy. He did this when taking time off from showing that much of the apparent correlation between the nominal and the real side of the economy is due to the endogenous response of money created by banks to fluctuations in real activity.
In 1999, Scott Freeman co-wrote Endogenous Cycles and Growth with Indivisible Technological Developments. The paper was about large, discrete technological improvements that required the accumulation of research or infrastructural investment over time before any benefits for realised in terms of increased output. With these lead-times for research or infrastructure investments, growth paths display cyclical patterns even in the absence of any shocks.
This lumpiness over time implied that a costly process such as research or construction must be completed on a large scale before the greatest part of a project’s benefits in output can be realized as Freeman and co. argue:
There are numerous examples of big research or infrastructural projects that are characterized by huge investments and relatively long development periods, where most of the benefits occur only after the project is complete.
Freeman and his co-authors gave as examples space research and satellite programs and major medical research. These are examples of prolonged and costly R & D whose benefits come primarily at the conclusion of the project.
Lags in the development of a new drug between the commencement of the R&D project and any revenues received is routinely now more than a decade. The Human Genome Project seems to be going on without end with few initial benefits.
Infrastructural examples given by Freeman and his co-authors included the installation of telephone, the internet, transportation shipping canals, interregional highways, railroads, mass transit or electricity transmission projects. All of these projects with long lead times, once completed that may increase the productivity of many economic sectors in addition to increasing output in the area concerned. In many cases there are no benefits whatsoever of the project and to after it is completed many years in the future. Oil pipelines can take up to a decade to build.
The 1973 oil price crisis launched a research and development program into alternative sources of energy and alternative sources of oil and gas supply that has lasted to this day.
Classic further examples of long lead times are mega sports events such as the World Cup and Olympic Games. Years of planning, development and construction for any benefits or revenues are obtained.
What is important in terms of the random shocks that drive the business cycle as championed by Ed Prescott is there are a range of sectors within the economy where there are long lead times before the investment leads to any outputs. Not surprisingly the first article in the real business cycle literature included in its title “time to build“.
Rabah Arezki, Valerie Ramey, and Liugang Sheng in “News Shocks in Open Economies: Evidence from Giant Oil Discoveries” explore a related theme of real business cycles without shocks. In particular, they investigate news of productivity enhancements. They look at what happens to economies that discover oil. An oil discovery is a well identified “news shock.”
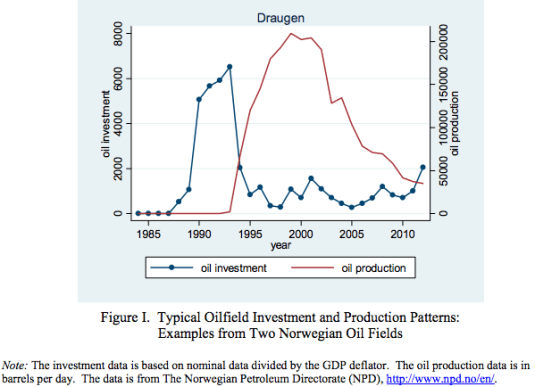
An oil discovery is well publicised and creates an incentive to invest in oil drilling. More importantly, there is news of greater income in the future but no change in current labour productivity or technological opportunities.
Rabah,Valerie, and Liugang found that after big oil discoveries, during the period of investment, the newly rich oil country borrows from abroad to build oil wells, oil pipelines and associated port infrastructure, obviously, but also borrows to finance higher consumption now. Consumption goes up and stays up in permanent income hypothesis fashion.
Interestingly, employment declines because of the wealth effect from the future income but there is no higher productivity of labour to encourage more work today. Investment rises soon after the news of the oil discovery arrives, while GDP does not increase for 5 years or more.
This is consistent with experience in the oil-rich Arab countries where there was increased consumption of leisure in anticipation of high future income is based on oil.
The same happened in Norway where massive investment was funded by foreign borrowing that led to annual current account deficits of up to 15% of GDP. Domestic savings fell away because Norwegians anticipated higher future incomes and started spending some of it now as predicted by the permanent income hypothesis. Norway now has a huge sovereign wealth fund able to fund a large part of its demographic burden from an ageing society.
After Mexico’s discovery of oil in the early 1970s, investment was high in oil and related industries. Consumption—by households and government—rose because of the increase in prospective real income. Since real GDP was not yet high, Mexico borrowed to pay for both the oil investment and the higher current consumption. Mexico’s foreign debt increased from $3.5 billion or 9% of GDP in 1971 to $61 billion or 26% of GDP in 1981. This boom in consumption and investment occurred without any productivity shock. All that was required was the ability to borrow.
Once the oil comes on line, the economy concern exports oil and pays back debt. This is when GDP including oil production finally rises a good five years and often more after the oil discovery. Consumption continues for its previous high rates while investment falls as the oil wells and pipelines have been built.
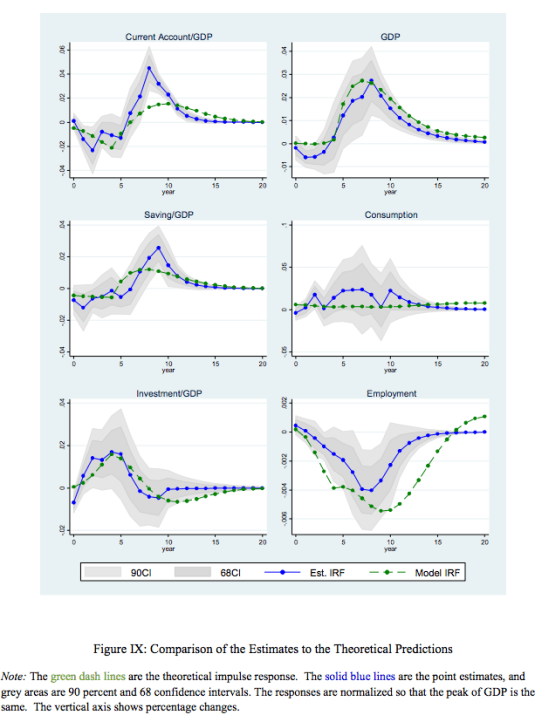
As with Scott Freeman, the long lead times not only can lead to large swings in investment, lumpy investments can also lead to increases in consumption, savings and employment without any productivity shocks.
Keynesian macroeconomics postulated that the economy slips into recessions for all sorts of reasons such as shifts and turns in the animal spirits and a loss of consumer confidence leading to a fall in autonomous investment and autonomous consumption. A collapse in autonomous investment and autonomous consumption is the Keynesian explanation for the great depression.
Both Keynesian macroeconomics and real business cycle theories at least at the outset couldn’t explain why there were recessions. Both attributed to them to causes they were yet to explain.
Keynesian macroeconomics could not explain what drove the waves of optimism and pessimism that either sharply increased or reduced investment. At bottom, Keynesian macroeconomics makes an unjustified assumption that technological progress unfolds at a relatively smooth rate and it attributes volatility in the economy to fluctuations in investment unrelated to trends in productivity.
The key inside of Keynesian macroeconomics was that inflation and unemployment were inversely correlated, so as one went up, the other went down as Milton Friedman explains.
Marvellously simple. A key that apparently unlocks the mystery of long-continued unemployment: inadequate autonomous spending or too low a propensity to consume. Increase either, or both, being careful simply not to go too far, and full employment could be attained.
What a wonderful prescription: for consumers, spend more out of your income, and your income will rise; for governments, spend more, and aggregate income will rise by a multiple of your additional spending; tax less, and consumers will spend more with the same result.
Though Keynes himself, and even more, his disciples, produced much more sophisticated and subtle versions of the theory, this simple version contains the essence of its great appeal to non-economists and especially governments.
A well-functioning economy should have no business cycles – no bouts of high inflation or persistent unemployment as Richard Rogerson explained:
So if there are cycles, that’s an indication of a malfunctioning economy. That idea permeated thinking for many years and was deeply ingrained. In effect, if an economy is in recession, someone should fix it.
The Keynesians only retreated as their empirical predictions were thoroughly discredited in the 1970s stagflation. Ad hoc auxiliary hypotheses were included about the supply-side in the Keynesian paradigm to prop up the old-time religion, not find new paths as Robert Barro put it:
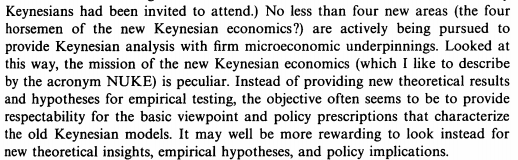
At least Prescott and other real business cycle theorists accepted that they must eventually unpack productivity drops and name causes that can be explored further to be found persuasive or perhaps wanting. They argued that periods of temporarily low output growth need not be market failures, but could follow from temporarily slow improvements in production technologies.
As research progressed, real business cycles were viewed as recurrent fluctuations in an economy’s incomes, products, and factor inputs—especially labour—due to changes in technology, tax rates and government spending, tastes, government regulation, terms of trade, and energy prices.
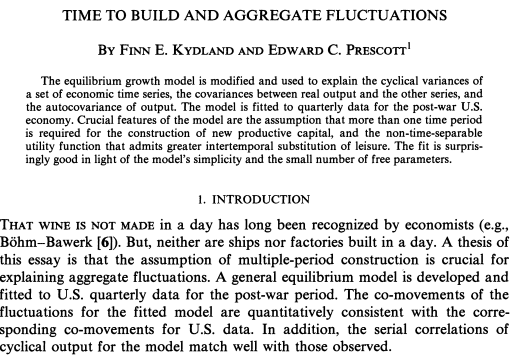
Scott Freeman took this research further. He, his colleagues and his progeny showed that real business cycles can occur without any productivity rises and falls whatsoever. All that was needed was the ability to borrow and invest across time to finance lumpy investments. These lumpy investments can be anything from oil wells, dams to new drugs, anywhere involving time to build and capital accumulation:
HT: The Grumpy Economist: Arezki, Ramey, and Sheng on news shocks.
German unemployment incidence by duration since 1983
11 Aug 2015 Leave a comment
in economic history, Euro crisis, fiscal policy, job search and matching, labour economics, labour supply, macroeconomics, unemployment, welfare reform Tags: equilibrium unemployment rate, Eurosclerosis, German unification, Germany, natural unemployment rate, poverty traps, unemployment duration, unemployment insurance, welfare state
German long term unemployment has been pretty stable albeit with an up-and-down after German unification. There is also a fall in long-term unemployment after some labour market reforms around 2005.

Source: OECD StatExtract.
How @equitablegrowth showed inequality helps growth when arguing inequality harms growth
10 Aug 2015 1 Comment
in applied price theory, applied welfare economics, comparative institutional analysis, currency unions, economic growth, economic history, economics of regulation, entrepreneurship, Euro crisis, fiscal policy, global financial crisis (GFC), income redistribution, labour economics, labour supply, macroeconomics, Marxist economics, poverty and inequality, Public Choice, public economics, rentseeking Tags: British disease, entrepreneurial alertness, Eurosclerosis, France, German unification, Germany, growth of government, sick man of Europe, social insurance, Sweden, taxation and entrepreneurship, taxation and investment, taxation and labour supply, welfare state
The Washington Centre for Equitable Growth recently tweeted that inequality harms growth in the USA as compared to Sweden, France, Germany and the UK. It was relying on some dodgy OECD research.
.@OECD sees continued rise in growth-harming inequality, reports @PaulHannon29 on.wsj.com/1EZpq1S http://t.co/xt4heZysXT—
Equitable Growth (@equitablegrowth) May 21, 2015
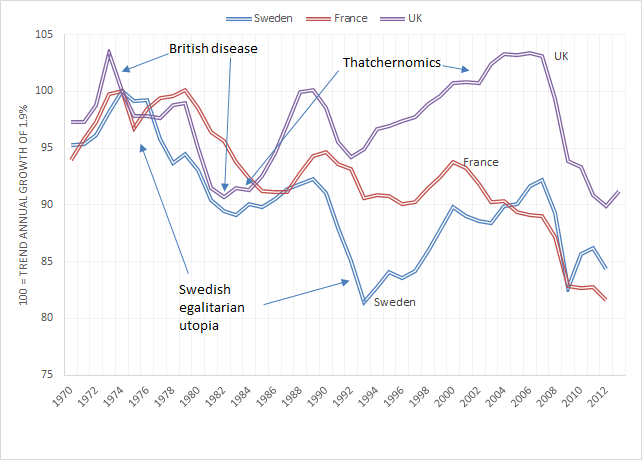
The Washington Centre for Equitable Growth did not check their inequality ratios they tweeted against trends in economic growth and economic policy since 1970, which I have reproduced in figure 1. Germany is not included in figure 1 because German data on growth is thrown askew by German unification.
Figure 1: Real GDP per British, French and Swede aged 15-64, 2014 US$ (converted to 2014 price level with updated 2011 PPPs), 1.9 per cent detrended, 1970-2013
Source: Computed from OECD Stat Extract and The Conference Board. 2015. The Conference Board Total Economy Database™, May 2015, http://www.conference-board.org/data/economydatabase/
Figure 1 shows that France has been in a long-term decline since the late 1970s despite the blessings of a more equal society than the USA as championed by the Washington Centre for Equitable Growth. In figure 1, a flat line is growth in real GDP per working age person, PPP, at the same rate as the USA for the 20th century, which was 1.9% per year. A falling line in figure 1 indicates growth of less than 1.9% while a rising line indicates growth in real GDP per working age person, PPP, in excess of 1.9%. In figure 1, France hardly ever grew at the trend rate of growth for the USA of 1.9% per year and was frequently well below that rate.

Sweden tells a slightly different story in figure 1 because of regime change in the early 1990s when Sweden adopted more liberal economic policies where taxes and government spending were reduced:
The rapid growth of the state in the late 1960s and 1970s led to a large decline in Sweden’s relative economic performance. In 1975, Sweden was the 4th richest industrialised country in terms of GDP per head. By 1993, it had fallen to 14th.
@alexvoronov använda smygfinansiering av Generell Välfärd är alltid av ondo. @NimaSanandaji: bit.ly/1Nar2eV http://t.co/wD0YEgncIE—
Old Whig (@aClassicLiberal) August 05, 2015
That regime change reversed a long economic decline since 1970 under the egalitarian policies of the Swedish Social Democratic Party. Under the Swedish Social Democratic Party, Sweden was almost always growing at less than the trend rate of growth of the USA, which was 1.9%. That position reversed only when there was a turn away from big government and high taxes.

Figure 1 tells a similar story for the British economy: a long economic decline in the 1970s when Britain was the sick man of Europe. Under Thatchernomics, Europe had a long economic boom for 20 years or more – see figure 1.
In the 1970s, under the high taxes of the Heath, Callaghan and Wilson administrations, as figure 1 shows, Britain was the sick man of Europe. With the election of the Thatcher Government, Britain soon grew at better than the US trend growth rate for nearly 20 years through few exceptions.
Graph of the Day: The UK has among the lowest total tax rates on businesses in the G7 http://t.co/l6mMhN9yLD—
CPS Think Tank (@CPSThinkTank) August 04, 2015
The impact of welfare states on life expectancy
07 Aug 2015 Leave a comment
in applied welfare economics, fiscal policy, labour economics, politics - Australia, politics - New Zealand, politics - USA, poverty and inequality, welfare reform Tags: Denmark, Finland, life expectancies, Norway, Sweden, welfare state
New from @iealondon: Scandinavian success is not due to high taxes and welfare spending. iea.org.uk/in-the-media/p… http://t.co/QVH566KNtV—
IEA (@iealondon) July 07, 2015
More evidence of Ricardian equivalence and consumer foresight
05 Aug 2015 Leave a comment
in budget deficits, fiscal policy, public economics Tags: Ricardian equivalence
Swedosclerosis, Eurosclerosis and the British disease compared
05 Aug 2015 2 Comments
in currency unions, economic growth, economic history, economics of regulation, Euro crisis, fiscal policy Tags: British disease, British economy, Eurosclerosis, France, Germany, Italy, sick man of Europe, Sweden, Swedosclerosis
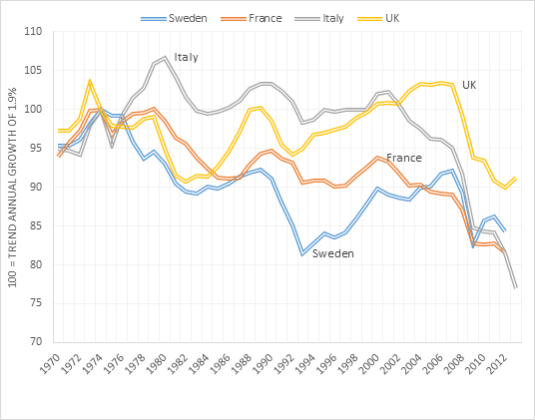
Figure 1 shows stark differences between Sweden, France, Italy and the UK since 1970 in departures from trend growth rates of 1.9% in real GDP per working age person, PPP. Italy did quite OK until 2000 growing at about the trend growth rate of 1.9% after which it fell into a hole so deep that it barely notice the onset of the global financial crisis. Sweden really had been the sick man of Europe until it turned its back on high taxing, welfare state socialism in the early 1990s. France has been in a long decline so much so that the global financial crisis is hard to pick up in the acceleration in its long decline in the mid-1990s. Figure 1 also shows Britain did very well, both under the neoliberal horrors of Thatcherism and the betrayals by Tony Blair of a true Labour Party platform. The UK grew at above the trend annual growth to 1.9% for most of the period from the early 1980s to 2007. The UK has done not so well since the onset of the global financial crisis.
Figure 1: Real GDP per Swede, French, British and Italian aged 15-64, 2014 US$ (converted to 2014 price level with updated 2011 PPPs), 1.9 per cent detrended, 1970-2013
Source: Computed from OECD StatExtract and The Conference Board. 2015. The Conference Board Total Economy Database™, May 2015, http://www.conference-board.org/data/economydatabase/
Note: When the line is flat, the economy is growing at its trend annual growth rate. A falling line means below trend annual growth; a rising line means of above trend annual growth. Detrended with values used by Edward Prescott.
German data was not in figure 1 because German unification threw all of its data into disarray for long-term comparison purposes.
 Utopia, you are standing in it!
Recent Comments