Figure 1: All in less cash transfers average income tax rates at average wage, 2014

Source: OECD tax database
Celebrating humanity's flourishing through the spread of capitalism and the rule of law
27 Jun 2015 Leave a comment
in labour supply, politics - Australia, politics - New Zealand, politics - USA, poverty and inequality, public economics Tags: Australia, British economy, family tax credits, family taxation, in-work tax credits, social insurance, taxation and the labour supply, welfare state
Figure 1: All in less cash transfers average income tax rates at average wage, 2014
Source: OECD tax database
24 Jun 2015 Leave a comment
in comparative institutional analysis, financial economics, income redistribution, politics - New Zealand, Public Choice, public economics Tags: ageing society, demographic crisis, New Zealand superannuation fund, old age pensions, social insurance, sovereign wealth funds, welfare state

The $30 billion New Zealand Superannuation Fund is the best performing sovereign wealth fund over the past five years, generating returns of more than 17 per cent a year.
Those returns easily beat all other sovereign wealth funds that publish their figures, according to a global study by JP Morgan. In the last three years alone, the fund returned an average of 21 per cent a year.
Good thing to do considering that the default deadweight cost of taxation is put by that Treasury to be 20%:
As a general rule, deadweight losses should be included if they are of sufficient size relative to the overall costs and benefits of the proposal that they are capable of altering the decision as to whether or not to proceed with the proposal.
Having said this, deadweight losses are notoriously difficult to quantify. Estimates vary from 14% up to 50% of the revenue collected.
Treasury suggests a rate of 20% as a default deadweight loss value in the absence of an alternative evidence based value. Thus public expenditures should be multiplied by a factor of 1.2 prior to discounting to incorporate the effects of deadweight loss.
This deadweight cost of taxation includes funds contributed to New Zealand government owned investment funds. In a speech last week, the Super Fund chairman Gavin Walker warned that the recent high returns were unlikely to continue in the long-term:
The last few years are likely to have been among the best years the fund will experience for some time,” he said. “On average and over the long-term we expect to earn the rather less exciting figure of 8 per cent [per annum] – but which will still provide a handsome return to New Zealander stakeholders.
The New Zealand Superannuation Fund must beat the market every single year to make up for the deadweight cost of its funding, the usual interest rate on borrowed funds, a premium for the investment risk added to the Crown’s portfolio and the cost to New Zealand’s growth rate of higher than otherwise taxes on income, entrepreneurship and investment.
Most mutual funds still can't beat their benchmark read.bi/1GkTig1 http://t.co/r7ezoDGJbV—
BI Chart of the Day (@chartoftheday) June 03, 2015
23 Jun 2015 Leave a comment
in fiscal policy, macroeconomics, politics - Australia, politics - New Zealand, politics - USA, population economics, public economics Tags: Australia, British economy, New Zealand, taxation and the labour supply
Figure 1: Direct taxes on the average worker in Australia, New Zealand, USA and UK, 2001 – 2012

Source: OECD Factbook 2014
Taxes on the average worker measure the ratio between the amount of taxes paid by the worker and the employer on the country average wage and the corresponding total labour cost for the employer. This tax wedge measures the extent to which the tax system on labour income discourages employment.
The taxes included in the measure are personal income taxes, employees’ social security contributions and employers’ social security contributions. For the few countries that have them, it also includes payroll taxes. The amount of these taxes paid in relation to the employment of one average worker is expressed as a percentage of their labour cost (gross wage plus employers’ social security contributions and payroll tax).
An average worker is defined as somebody who earns the average income of full-time workers of the country concerned in Sectors B-N of the International Standard Industrial Classification (ISIC Rev. 4). The average worker is considered single without children, meaning that he or she does not receive any tax relief in respect of a spouse, unmarried partner or child.
23 Jun 2015 Leave a comment
in economics of love and marriage, labour economics, politics - USA, public economics Tags: earned income tax credit, economics of families, family tax credits
22 Jun 2015 Leave a comment
in human capital, labour economics, labour supply, occupational choice, politics - Australia, politics - New Zealand, politics - USA, public economics, sports economics Tags: British economy, CEO pay, Denmark, economics of migration, endogenous growth theory, Spain, superstar wages, taxation and entrepreneurship, taxation and superstars, taxation and the labour supply, Thomas Piketty, top 1%
Emmanuel Saez is leading a literature showing how sensitive migration decisions of superstars are to top marginal tax rates. Specifically, he and his co-authors studied Spain’s Beckham’s law.
Cristiano Ronaldo moved from Manchester United to Real Madrid in 2009 partly to avoid the announced 50% top marginal income tax in the UK to benefit from “Beckham Law” in Spain. Beckham’s Law was a preferential tax scheme of 24% on foreign residents in Spain. When David Beckham transferred to Real Madrid, the manager of Arsenal football club commented that the supremacy of British soccer was at risk unless the U.K.’s top marginal tax rate changed.
A number of EU member states offer substantially lower tax rates to immigrant football players, including Denmark (1991), Belgium (2002) and Spain (2004). Beckham’s law had a big impact in Spain:
…when Spain introduced the Beckham Law in 2004, the fraction of foreigners in the Spanish league immediately and sharply started to diverge from the fraction of foreigners in the comparable Italian league.
Moreover, exploiting the specific eligibility rules in the Beckham Law, we show that the extra influx of foreigners in Spain is driven entirely by players eligible for the scheme with no effect on ineligible players.

Suez also found evidence from tax reforms in all 14 countries that the location decisions of players are very responsive to tax rates. Suez in another paper with Thomas Piketty wants the top tax rate to be 80%. However, their work on taxation and the labour supply supports a much lower rate:
First, higher top tax rates may discourage work effort and business creation among the most talented – the so-called supply-side effect. In this scenario, lower top tax rates would lead to more economic activity by the rich and hence more economic growth. If all the correlation of top income shares and top tax rates documented on Figure 1 were due to such supply-side effects, the revenue-maximising top tax rate would be 57%.
Suez and Piketty then go on to argue that the pay of chief executives of public companies, a subset of the top 1% and top 0.1%, may not reflect their productivity but that is a much more complicated argument about agency costs and the separation of ownership and control which they make rather weakly.
Much of their other work on top incomes is about the emergence of a working rich whose top incomes are wages earned by holding superstar jobs in a global economy. It would be peculiar and perhaps overzealous to organise the entire taxation of high incomes around the correction of agency costs arising from the separation of ownership and control of some of the companies listed on the stock exchange.
Figure 1: Percentage of national income (including capital gains) received by top 1%, and each primary taxpayer occupation in top 1%, USA

Source: Jon Bakija, Adam Cole and Bradley T. Heim “Jobs and Income Growth of Top Earners and the Causes of Changing Income Inequality: Evidence from U.S. Tax Return Data”.
There is a long history showing how the labour supply of sports stars is highly sensitive to top marginal income tax rates. For a very long time, boxing was the only really big-money sport for athletes:
The 1950s was the era of the 90 percent top marginal tax rate, and by the end of that decade live gate receipts for top championship fights were supplemented by the proceeds from closed circuit telecasts to movie theatres.
A second fight in one tax year would yield very little additional income, hardly worth the risk of losing the title. And so, the three fights between Floyd Patterson and Ingemar Johansson stretched over three years (1959-1961); the two between Patterson and Sonny Liston over two years (1962-1963), as was also true for the two bouts between Liston and Cassius Clay (Muhammad Ali) (1964-1965).
Then, the Tax Reform Act of 1964 cut the top marginal tax rate to 70 percent effective in 1965. The result: two heavyweight title fights in 1965, and five in 1966. You can look it up.
Ufuk Akcigit, Salome Baslandze, and Stefanie Stantcheva found that the migration of superstar inventors is highly responsive to top marginal tax rates.
#Braindrain is real, even quantifiable — as per NBER paper 21024. Geniuses don't tolerate extra taxes easily. http://t.co/HVP8uEFAfz—
Amity Shlaes (@AmityShlaes) June 07, 2015
Ufuk Akcigit, Salome Baslandze, and Stefanie Stantcheva studied the international migration responses of superstar inventors to top income tax rates for the period 1977-2003 using data from the European and US Patent offices.
our results suggest that, given a ten percentage point decrease in top tax rates, the average country would be able to retain 1% more domestic superstar inventors and attract 38% more foreign superstar inventors.

Emmanuel Saez and co-authors also found that a preferential top tax scheme for high earning migrants in their first three years in Denmark was highly successful in attracting highly skilled labour to that country:
…the number of foreigners in Denmark paid above the eligibility threshold (that is the group affected by the tax scheme) doubles relative to the number of foreigners paid slightly below the threshold (those are comparison groups not affected by the tax scheme) after the scheme is introduced.
This effect builds up in the first five years of the scheme and remains stable afterwards. As a result, the fraction of foreigners in the top 0.5% of the earnings distribution is 7.5% in recent years compared to a 4% counterfactual absent the scheme.
This very large behavioural response implies that the resulting revenue-maximising tax rate for a scheme targeting highly paid foreigners is relatively small (about 35%). This corresponds roughly to the current tax rate on foreigners in Denmark under the scheme once we account for other relevant taxes (VAT and excises).

This blog post was motivated by a courageous tweet about Tony Atkinson saying that increases in the top tax rate have little effect on the supply of labour! Not so.
20 Jun 2015 Leave a comment
in economic growth, fiscal policy, human capital, labour economics, labour supply, macroeconomics, politics - USA, public economics Tags: endogenous growth theory, EU, Eurosclerosis, laffer curve, optimal tax theory, taxation and entrepreneurship, taxation and investment, taxation and the labour supply
@asymmetricinfo paper:"How Far Are We From The Slippery Slope? The Laffer Curve Revisited" bit.ly/1HMhmqu http://t.co/D9IffNhd92—
Old Whig (@aClassicLiberal) April 20, 2015
19 Jun 2015 Leave a comment
in politics - USA, public economics Tags: earned income tax credit, family tax credits, progressive income taxes, tax incidence, top 1%, welfare state
12 Jun 2015 Leave a comment
in applied price theory, economic history, politics - USA, Public Choice, public economics Tags: Denmark, growth of government, Norway, optimal tax theory, Scandinavia, size of government, Sweden, welfare state
Efficient taxes gather more revenue and therefore are capable of funding a larger public sector with less political resistance from groups who are net taxpayers. The so-called neoliberal reforms of the 1980s and 1990s actually saved the welfare state by putting it on a revenue raising structure that provoked less political resistance.
A switch to more efficient taxes through tax reforms allows governments to raise the same amount or larger amount of revenue for the same level of political resistance from taxpayers. This is because less revenue and output is wasted by discouraging labour supply, investment, savings and investment in capital with high marginal rates of tax on narrower tax basis. Everyone gains from converging on more efficient modes redistribution.
The Nordic countries have been on to this application of optimal tax theory to expanding the size of government and the welfare state for a long time. The Nordics have high but flat taxes on labour income, low taxes on business income and a high, broad-based consumption tax be it called a VAT or GST as illustrated by a just published Tax Foundation report.
To begin with, the USA has a smaller government because it relies more income taxes than on consumption taxes.

Governments in Europe switched towards consumption taxes such as the VAT or GST because this allowed them to raise a large amount of revenue with broad-based taxes at low rates. A VAT or GST exempts exports and business to business transactions from taxes so that reduced taxpayer resistance.
Scandinavian income taxes raise much more revenue than in the USA because they are rather flat. That is, they tax most people at these high rates, not just high-income taxpayers. The top tax rate in the Scandinavian countries cuts in at about one and a half times average income or less rather than eight times average income as in the USA.
Flat high tax "How do Scandinavian countries pay for their govt spending?" bit.ly/1KZ7jOs @JimPethokoukis http://t.co/33oRg8Ozqh—
Old Whig (@aClassicLiberal) June 11, 2015
The marginal income tax rates including this top income tax rate cuts in a low level of income is also rather high in the Nordic countries relative to the USA’s top income tax rate with the exception of Norway.

Nonetheless the Nordic countries are alert to not killing the goose that laid the golden egg. Company taxes are relatively low in Scandinavian countries as compared to the USA so that businesses do not flee to other jurisdictions.

Top marginal tax rates on dividends and capital gains are not above-average in the Nordic states but their taxes on less mobile tax bases such as from labour and consumption are much higher.

A large welfare state such as those in the Nordic countries require a significant amount of revenue, so the tax base in these countries must be broad. This also means higher taxes on consumption through the VAT or GST and higher taxes on middle-income taxpayers.
Business taxes are a less reliable source of revenue because of capital flight and disincentives to invest. Thus, the Nordics do not place above-average tax burdens on capital income and focus taxation on labour and consumption.
via Sources of Government Revenue across the OECD, 2015 | Tax Foundation and How Scandinavian Countries Pay for Their Government Spending | Tax Foundation.
05 Jun 2015 Leave a comment
in labour economics, minimum wage, public economics Tags: Australia, British economy, Canada, Ireland, progressive taxation, taxation and the labour supply, welfare state
Figure 1: Minimum wage after income tax and social security contributions, US$ PPP, Anglo-Saxon countries, 2013

04 Jun 2015 3 Comments
in economic growth, politics - New Zealand, Public Choice, public economics

Bill English’s 2015 New Zealand Budget foreshadows a $1.5 billion allowance in the 2017 budget for “modest tax cuts”. Any reasonable mock-up of these tax cuts, such as in table 1 using the numbers on the Treasury website for revenue losses for small tax changes show that Prime Minster Key is planning his own fistful of dollars in the lead up to the 2017 election.
Table 1: hypothetical 2017 National Party tax cuts, $1.5 billion
| Current tax rate | New tax rate | Revenue loss, static scoring |
Revenue loss, dynamic scoring |
| 33% | 31.5% | $323m | $274m |
| 30% | 27.5% | $388m | $329.4m |
| 17.5% | 16.5% | $505m | $429.3m |
| Trust tax 33% | Trust tax 31.5% | $135m | $129m |
| Company tax rate 28% | 27.5% | $113m | $90m |
| Total cost | $1.465b | $1251m |
No serious participant in public policy debate could suggest that tax cuts of the size in table 1 will not have incentive effects that will lead to growth in incomes and business profits. There will be offsetting tax revenue increases that make a more ambitious tax package possible in 2017.
The Treasury’s website on revenue losses forecasts that a 1% increase in wages growth will increase tax revenue by $300 million. A 1% increase in the growth rate of taxable business profits will increase tax revenues by $140 million again according to the Treasury. These are big differences.
Any sensible discussion of the 2017 tax cuts should be against a background of what is called dynamic scoring to use the American parlance.
When the NZ Treasury “scores” revenue losses from tax cuts on its website, its estimates of revenue changes assume no changes in behaviour. Dynamic scoring takes behavioural effects into account.
The Congressional Budget Office was recently required to use dynamic scoring when costing major tax policy proposals. New Zealand should follow this path.

Table 2 makes conservative assumptions about the behavioural effects of income tax cuts. I follow Mankiw, N. Gregory and Matthew Weinzierl “Dynamic Scoring: A Back-of-the-Envelope Guide,” Journal of Public Economics (September 2006): 1415-1433. They argue that, in the long run, about 17% of a cut in individual income taxes is recouped through higher economic growth. For a cut in company taxes, their figure is 50%. I assume 15% is recouped in this way for individuals, 20% for companies and 5% for trusts.
Table 2: hypothetical 2017 National Party tax cuts, $1.5 billion, dynamic scoring of revenue effects
| Current tax rate | New tax rate | Revenue loss static Scoring |
Revenue loss dynamic scoring |
| 33% | 31% | $430m | $366m |
| 30% | 27% | $465m | $395m |
| 17.5% | 16.5% | $505m | $429m |
| Trust tax 33% | Trust tax 31% | $180m | $171m |
| Company tax rate 28% | 27% | $225m | $180m |
| Total cost | $1.805b | $1.541b |
The $200-300 million in revenue increases from higher incomes and higher business profits incentivised by lower tax rates is not a trivial sum. It is enough on its own to cut one percentage point of the company tax rate. Spread around as in table 2, there are enough to knock another one-half of a percentage point of the top tax rate, the second top tax rate and the company tax rate. The $1.5 billion in tax cuts planned for 2017 will be neither modest in their size nor in their behavioural effects.
No budget should be published and no party in an election should assert that large changes in the tax system have no behavioural effects. Dynamic scoring makes a big difference to what scale of tax cuts are possible.
There are practical hurdles to dynamic scoring but static scoring has more important ones. The hurdles of dynamic scoring are:
Against that is dynamic scoring removes the bias against pro-growth policies in current budgetary scoring:
[A] theoretical advantage of accurate dynamic scoring is that it is not biased against pro-growth policies compared to the current conventional scoring method. By ignoring macroeconomic effects, the conventional method overstates the true budgetary cost of pro-growth policies, such as infrastructure investments, and understates the cost of anti-growth policies.
To close on some New Zealand politics, Prime Minister Key, who is known as the smiling assassin, overtook the Labour Party and the Greens on their left In the 2015 Budget by increasing welfare benefits for the first time since 1972 in real terms, and by a large amount ($25 a week), and also increasing family tax credits.
Prime Minister Key well then pivot to the right in 2017 with a fistful of dollars to firmly camp himself over both the centre-left in the centre-right to be re-elected for a fourth term against an increasingly hapless and out-manoeuvred opposition.
31 May 2015 Leave a comment
in economic history, politics - USA, public economics, taxation Tags: average tax rates, growth of government, size of government
30 May 2015 2 Comments
in economic history, politics - Australia, politics - New Zealand, politics - USA, public economics Tags: Australia, Canada, growth of government
The tax take is noticeably higher in Canada and New Zealand and has been for a long time.
Figure 1: US, Canadian, Australian and New Zealand tax revenues as a percentage of GDP, 1965–2013

Source: OECD StatExtract.
30 May 2015 Leave a comment
in applied price theory, applied welfare economics, comparative institutional analysis, development economics, economic history, entrepreneurship, growth disasters, growth miracles, income redistribution, politics - Australia, politics - New Zealand, politics - USA, Public Choice, public economics, rentseeking Tags: entrepreneurial alertness, Leftover Left, taxes and the labour supply, The inequality and growth, Thomas Piketty, top 1%, Twitter left
Tim Taylor, the editor of the Journal of Economic Perspectives, has written a superb blog post on why we should be sceptical about a strong relationship between inequality and economic growth. Taylor was writing in response to the OECD’s recent report "In It Together: Why Less Inequality Benefits All,".

Taylor’s basic point is economists have enough trouble working out what causes economic growth so trawling within that subset of causes to quantify the effects of rising or falling inequality inequality seems to be torturing the data to confess. The empirical literature is simply inconclusive as Taylor says:
A variety of studies have undertaken to prove a connection from inequality to slower growth, but a full reading of the available evidence is that the evidence on this connection is inconclusive.
Most discussions of the link between inequality and growth are notoriously poor of theories connecting two. There are three credible theories in all listed in the OECD’s report:
The report first points out (pp. 60-61 that as a matter of theory, one can think up arguments why greater inequality might be associated with less growth, or might be associated with more growth. For example, inequality could result less growth if:
1) People become upset about rising inequality and react by demanding regulations and redistributions that slow down the ability of an economy to produce growth;
2) A high degree of persistent inequality will limit the ability and incentives of those in the lower part of the income distribution to obtain more education and job experience; or
3) It may be that development and widespread adoption of new technologies requires demand from a broad middle class, and greater inequality could limit the extent of the middle class.
About the best theoretical link between inequality and economic growth is what Taylor calls the "frustrated people killing the goose that lays the golden eggs." Excessive inequality within a society results in predatory government reactions at the behest of left-wing or right-wing populists.

Taylor refers to killing the goose that laid the golden egg as dysfunctional societal and government responses to inequality. He is right but that is not how responses to inequality based on higher taxes and more regulation are sold. Thomas Piketty is quite open about he wants a top tax rate of 83% and a global wealth tax to put an end to high incomes:
When a government taxes a certain level of income or inheritance at a rate of 70 or 80 percent, the primary goal is obviously not to raise additional revenue (because these very high brackets never yield much).
It is rather to put an end to such incomes and large estates, which lawmakers have for one reason or another come to regard as socially unacceptable and economically unproductive…
The left-wing parties don’t say let’s put up taxes and redistribute so that is not something worse and more destructive down the road. Their argument is redistribution will increase growth or at least not harm it. That assumes the Left is addressing this issue of not killing the goose that lays the golden egg at all.

Once you discuss the relationship between inequality and growth in any sensible way you must remember your John Rawls. Incentives encourage people to work, save and invest and channels them into the occupations where they make the most of their talents. Taylor explains:
In the other side, inequality could in theory be associated with faster economic growth if: 1) Higher inequality provides greater incentives for people to get educated, work harder, and take risks, which could lead to innovations that boost growth; 2) Those with high incomes tend to save more, and so an unequal distribution of income will tend to have more high savers, which in turn spurs capital accumulation in the economy.
Taylor also points out that the OECD’s report is seriously incomplete by any standards because it fails to mention that inequality initially increases in any poor country undergoing economic development:
The report doesn’t mention a third hypothesis that seems relevant in a number of developing economies, which is that fast growth may first emerge in certain regions or industries, leading to greater inequality for a time, before the gains from that growth diffuse more widely across the economy.
At a point in its report, the OECD owns up to the inconclusive connection between economic growth and rising inequality as Taylor notes:
The large empirical literature attempting to summarize the direction in which inequality affects growth is summarised in the literature review in Cingano (2014, Annex II).
That survey highlights that there is no consensus on the sign and strength of the relationship; furthermore, few works seek to identify which of the possible theoretical effects is at work. This is partly tradeable to the multiple empirical challenges facing this literature.
The OECD’s report responds to this inclusiveness by setting out an inventory of tools with which you can torture the data to confess to what you want as Taylor notes:
There’s an old saying that "absence of evidence is not evidence of absence," in other words, the fact that the existing evidence doesn’t firmly show a connection from greater inequality to slower growth is not proof that such a connection doesn’t exist.
But anyone who has looked at economic studies on the determinants of economic growth knows that the problem of finding out what influences growth is very difficult, and the solutions aren’t always obvious.
The chosen theory of the OECD about the connection between inequality and economic growth is inequality leads to less investment in human capital at the bottom part of the income distribution.
[Inequality] tends to drag down GDP growth, due to the rising distance of the lower 40% from the rest of society. Lower income people have been prevented from realising their human capital potential, which is bad for the economy as a whole
I found this choice of explanation curious. So did Taylor as the problem already seems to have been solved:
There are a few common patterns in economic growth. All high-income countries have near-universal K-12 public education to build up human capital, along with encouragement of higher education. All high-income countries have economies where most jobs are interrelated with private and public capital investment, thus leading to higher productivity and wages.
All high-income economies are relatively open to foreign trade. In addition, high-growth economies are societies that are willing to allow and even encourage a reasonable amount of disruption to existing patterns of jobs, consumption, and ownership. After all, economic growth means change.
In New Zealand, interest free student loans are available to invest in higher education as well as living allowances for those with parents on a low income. There are countries in Europe with low levels of investment in higher education but that’s because of high income taxes not because of inequality.
The OECD’s report is fundamentally flawed which is disappointing because most research from the OECD is to a good standard.
via CONVERSABLE ECONOMIST: Does Inequality Reduce Economic Growth: A Skeptical View.
30 May 2015 Leave a comment
in applied price theory, economic history, entrepreneurship, financial economics, public economics Tags: capital gains tax, dot.com bubble, entrepreneurial alertness, tax arbitrage
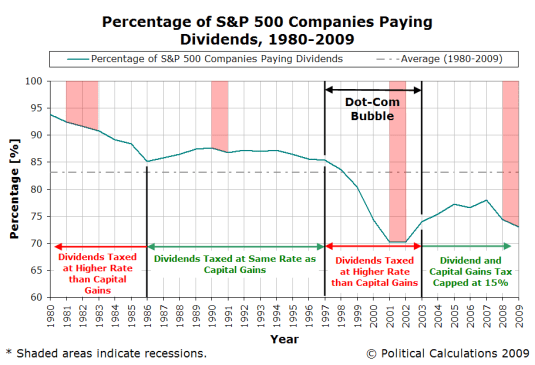
…the Taxpayer Relief Act of 1997 left dividend tax rates unchanged – they continued to be taxed at the same rates as regular income in the United States, which provided a powerful incentive for investors to treat the two kinds of stocks very differently, favouring the low-to-no dividend paying stocks over those that paid out more significant dividends.
At least, until May 2003, when the compromises that led to, and ultimately the signing of the Jobs and Growth Tax Relief Reconciliation Act of 2003 would set both the tax rates for capital gains and for dividends to once again be equal to one another, as they had been in the years from 1986 through 1997…
the founding and rapid growth of new computer and Internet technology-oriented companies in the early 1990s, which grew rapidly to become large companies and which as growth companies, did not pay significant dividends to shareholders, provided the critical mass needed for the 1997 capital gains tax cut to launch the Dot Com Bubble.
via Political Calculations: What Caused the Dot Com Bubble to Begin and What Caused It to End?.
29 May 2015 Leave a comment
in economic history, public economics, Sam Peltzman Tags: Denmark, Finland, growth of government, Norway, Sweden
Peltzman was right! Scandinavian growth in the size of government stopped in the early 1980s.
Figure 1: Danish, Finnish, Norwegian and Swedish tax revenues as a percentage of GDP, 1965–2013

Source: OECD StatExtract.
Celebrating humanity's flourishing through the spread of capitalism and the rule of law
Scholarly commentary on law, economics, and more
Beatrice Cherrier's blog
Celebrating humanity's flourishing through the spread of capitalism and the rule of law
Celebrating humanity's flourishing through the spread of capitalism and the rule of law
Celebrating humanity's flourishing through the spread of capitalism and the rule of law
Why Evolution is True is a blog written by Jerry Coyne, centered on evolution and biology but also dealing with diverse topics like politics, culture, and cats.
Celebrating humanity's flourishing through the spread of capitalism and the rule of law
Celebrating humanity's flourishing through the spread of capitalism and the rule of law
A rural perspective with a blue tint by Ele Ludemann
DPF's Kiwiblog - Fomenting Happy Mischief since 2003
Celebrating humanity's flourishing through the spread of capitalism and the rule of law
The world's most viewed site on global warming and climate change
Tim Harding's writings on rationality, informal logic and skepticism
A window into Doc Freiberger's library
Let's examine hard decisions!
Commentary on monetary policy in the spirit of R. G. Hawtrey
Thoughts on public policy and the media
Celebrating humanity's flourishing through the spread of capitalism and the rule of law
Politics and the economy
A blog (primarily) on Canadian and Commonwealth political history and institutions
Reading between the lines, and underneath the hype.
Economics, and such stuff as dreams are made on
"The British constitution has always been puzzling, and always will be." --Queen Elizabeth II
Celebrating humanity's flourishing through the spread of capitalism and the rule of law
Celebrating humanity's flourishing through the spread of capitalism and the rule of law
WORLD WAR II, MUSIC, HISTORY, HOLOCAUST
Undisciplined scholar, recovering academic
Celebrating humanity's flourishing through the spread of capitalism and the rule of law
Res ipsa loquitur - The thing itself speaks
Celebrating humanity's flourishing through the spread of capitalism and the rule of law
Researching the House of Commons, 1832-1868
Articles and research from the History of Parliament Trust
Reflections on books and art
Posts on the History of Law, Crime, and Justice
Celebrating humanity's flourishing through the spread of capitalism and the rule of law
Exploring the Monarchs of Europe
Cutting edge science you can dice with
Small Steps Toward A Much Better World
“We do not believe any group of men adequate enough or wise enough to operate without scrutiny or without criticism. We know that the only way to avoid error is to detect it, that the only way to detect it is to be free to inquire. We know that in secrecy error undetected will flourish and subvert”. - J Robert Oppenheimer.
The truth about the great wind power fraud - we're not here to debate the wind industry, we're here to destroy it.
Celebrating humanity's flourishing through the spread of capitalism and the rule of law
Celebrating humanity's flourishing through the spread of capitalism and the rule of law
Economics, public policy, monetary policy, financial regulation, with a New Zealand perspective
Celebrating humanity's flourishing through the spread of capitalism and the rule of law
Restraining Government in America and Around the World

Recent Comments